Abstract
Data from the 2007 British Gambling Prevalence Survey were used to examine the psychometric properties of the two problem gambling scales used in the survey: the Canadian Problem Gambling Severity Index (PGSI) and a DSM-IV-based scale. Analysis was based on those who reported any gambling in the past 12 months (between 5483 and 5528 participants for most analyses). The PGSI gave evidence of high internal reliability, uni-dimensionality, and good item-response characteristics. Several PGSI items showed extreme male to female endorsement ratios and a possible conclusion is that the PGSI is under-estimating the prevalence of problem gambling among women. The DSM-IV-based scale showed only satisfactory internal reliability, evidence suggesting bi-dimensionality, and poor performance of at least two items: those relating to gambling-related crime and ‘chasing losses’. The results also suggest that, for population survey purposes, problem gambling/non-problem gambling might best be viewed as lying on a continuum.
Introduction
As awareness of problem gambling grows, and the need to monitor its prevalence is increasingly recognised in the context of more liberal laws governing the provision and promotion of gambling products, there is an ever greater need for sound techniques for survey assessments of problem gambling. A large number of sets of questions, or ‘screens’, have been used at one time or another, of which the South Oaks Gambling Screen (SOGS) and a number of derivatives have been the most widely employed (Abbott & Volberg, Citation2006; Lesieur & Blume, Citation1987). However, the SOGS has been criticised on the grounds that the contents of its 20 items is skewed towards questions about methods of obtaining money in order to gamble (several with very low rates of endorsement in general population surveys), and because it tends to over-estimate problem gambling prevalence in comparison with other sets of questions (Abbott & Volberg, Citation2006; McMillen & Wenzel, Citation2006; Orford, Sproston & Erens, Citation2003).
According to Abbott and Volberg's (Citation2006) review, two principal successors to SOGS were emerging. One consists of measures based on the fourth edition of the Diagnostic and Statistical Manual of Mental Disorders criteria for pathological gambling (DSM-IV) (American Psychiatric Association, Citation1994). However, it is important to point out that there exists a variety of different sets of questions, each aiming to determine how many of the 10 criteria for pathological gambling are present (not only with different question wording but also with differing numbers of questions per criterion) (e.g. Gerstein, Volberg, Harwood & Tucker, Citation1999; Orford et al., Citation2003; Stinchfield, Citation2002; Strong & Kahler, Citation2007). The second possible screen as a replacement for SOGS is the Problem Gambling Severity Index (PGSI), a set of nine questions that is a sub-set of the Canadian Problem Gambling Index (CPGI), which provides a more comprehensive assessment (Ferris & Wynne, Citation2001). This was designed to overcome the disadvantages of SOGS but also to provide a more continuous (rather than dichotomous) and more socially oriented (rather than clinical) measure of problem gambling. However, both Abbott and Volberg (Citation2006) and Svetieva and Walker (Citation2008) have noted that most PGSI items were based on SOGS or DSM-IV items and that the conceptualisation of problem gambling on which the PGSI is based is in fact rather similar.
The first British Gambling Prevalence Survey (BGPS), carried out in 1999/2000, used both SOGS and a set of 10 questions, corresponding to the DSM-IV criteria, based on questions developed by Fisher (Citation1996) for a study of problem gambling among casino patrons. Item wording was closely based on the DSM criteria and four response options were provided for each item. An analysis of the psychometric properties of those scales, as well as confirming some of the deficiencies of SOGS noted by others, found the internal reliabilities of the two scales and the agreement between them in the identification of problem gamblers to be satisfactory but far from perfect (Orford et al., Citation2003). Factor analyses of each screen suggested that neither was uni-dimensional, with both embracing a dependence factor and a factor of gambling-related harm.
The paper presented here reports on similar analyses of the two problem gambling screens used in the second BGPS that was conducted in 2006/2007 (Wardle et al., Citation2007). Since the PGSI had become available by the time of the second survey, and in the light of growing criticism of the SOGS, the former was substituted for the latter in the later survey. In order to provide continuity with the first survey, the same 10 DSM-IV-based items were retained. Therefore, for the first time, the 2007 BGPS provides an opportunity to compare and analyse the PGSI and DSM-IV-based screens used in the same large general population survey. The paper reports the internal reliability of each of the two scales and the performance of each of their constituent items (see Holtgraves (Citation2009) and Young and Stevens (Citation2008) for similar analyses of the PGSI; and Stinchfield (Citation2003) and Stinchfield, Govani and Frisch (2005) for DSM-based scales); any evidence of differential item response according to age, sex and area deprivation (see Strong and Kahler (Citation2007) for a similar analysis); factor analyses of the two scales separately and together; and agreement between the two scales in the identification of problem gamblers. Most of these analyses are similar to those carried out with data from the first BGPS (Orford et al., Citation2003).
Method
Sample
The survey was carried out by the National Centre for Social Research (NatCen) with the first and third authors as advisors. The method was similar to that used in the first BGPS carried out in 1999/2000. Using the Postcode Address File as the sampling frame, private addresses were randomly selected within each of over 300 postcode sectors stratified to be representative of different regions in England, Scotland and Wales and of areas with varying mixes of people of different occupational status and ethnicity. Fieldwork was carried out between September 2006 and March 2007 by NatCen's field staff trained by NatCen researchers at 19 training sessions held across Britain. Following an advance letter, an interviewer visited the selected address in order to complete a household interview with a ‘household reference person’ (HRP) or spouse/partner (to collect socioeconomic information about the HRP and demographic information about each person resident in the household) and to assign a copy of the main self-completion questionnaire for each person aged 16 years and over living in the household. Completed questionnaires were either collected at the same visit or on a later occasion. An online completion option was made available and was taken up by 7% of respondents. The HRP interviews were achieved at 63% of addresses, and questionnaires were completed by 81% of adults at those addresses. Hence the overall response rate was 52% (a total of 9003 participants). Further details are provided in the full report of the survey (Wardle et al., Citation2007).
Problem gambling scales
Tables and show the item wording of the DSM-IV-based scale and the PGSI, respectively. Twelve months was the time frame for both. Response options for all PGSI items were: never, sometimes, most of the time, almost always, scored, respectively, 0, 1, 2, 3. For nine of the ten DSM-IV items response options were: never, occasionally, fairly often, very often. The exception was item 1 for which options were: never, some of the time I lost, most of the time I lost, every time I lost. Two methods of scoring the DSM-IV scale were used (see Analysis, below). For most analyses, item responses were dichotomised according to the criteria shown in the footnote to Table . The alternative method scored each item 0 (never), 1 (occasionally/some of the time I lost), 2 (fairly often/most of the time I lost), 3 (very often/every time I lost). Using the DSM-IV scale and dichotomous item scoring, those respondents who fulfilled at least three of the 10 criteria were defined as problem gamblers (a higher threshold of five criteria fulfilled has been suggested for a diagnosis of ‘pathological gambling’, but four has been found to provide a better discrimination between criterion groups and three also gives good discrimination (Stinchfield, Citation2003; Stinchfield et al., Citation2005); and a threshold of three has provided the closest match to prevalence estimated by alternative screens in the BGPSs – SOGS in 1999/2000 and PGSI in 2006/07). By weighting the data appropriately, the best estimate of prevalence of problem gambling was 0.6% of the adult British population (0.9% of those who had gambled at all in the past 12 months). Using the PGSI, all those respondents who achieved scores of eight or more were defined as problem gamblers. According to the PGSI, the prevalence of problem gambling was 0.5% (0.8% of past year gamblers) (Wardle et al., Citation2007).
Table 1. DSM-IV criteria for problem gambling: item characteristics in the 2007 British Gambling Prevalence Survey.
Table 2. Canadian Problem Gambling Severity Index (PGSI): item characteristics in the 2007 British Gambling Prevalence Study.
The problem gambling scales were located in the middle of the questionnaire, with the nine PGSI items following immediately after the ten DSM-IV items. They were preceded by questions that asked for the frequency of gambling on 16 different forms of gambling in the past 12 months, and more detailed questions about gambling locations and expenditure, for each form of gambling separately, in the past seven days. The problem gambling scale questions were followed by the 14-item Attitudes Towards Gambling Scale (ATGS; Orford, Griffiths, Wardle, Sproston & Erens, Citation2009), questions about parents' and close relatives' gambling, summary questions about own lifetime problem gambling and current debt, questions about smoking, drinking and health, and standard questions about sex, age, ethnic group, educational qualifications and personal income (Wardle et al., Citation2007).
Analysis
Only those respondents who reported gambling of any kind during the past 12 months were asked to complete the PGSI and DSM-IV-based items. Analyses were therefore confined to past year gamblers who numbered 6161 respondents in total. Due to missing data, analyses involving individual PGSI and DSM items vary between 5483 and 5528 gamblers. Analyses involving the area deprivation variable are based on smaller numbers (4649–4693 gamblers) because the index of area deprivation was slightly different in the three British countries and the analysis was therefore confined to the larger (English) set of data.Footnote1
Cronbach's α coefficient was used as the standard index of internal reliability of the PGSI and DSM scales. The performance of individual items was examined using the following criteria: frequency of endorsement; item-total correlation; loading on the first unrotated component produced by factor analysis; visual item response analysis to examine the profile of item endorsement across total score sub-groups. Whether items were more or less likely to be endorsed by respondents of different ages, sexes and living in areas with different levels of deprivation was explored by calculating three sets of ratios: the ratio of endorsement for each item, for those aged 16–34 years (our definition of a ‘young adult’) to those aged 35 years and older; the ratio of endorsement of male to female respondents; and the ratio of endorsement of those in the two most deprived area deprivation quintiles to those in the two least deprived quintiles. In calculating those ratios, all responses other than ‘Never’ were taken as endorsements. Factor analyses were carried out using Principal Components Analysis (PCA), first of PGSI items alone, second of the DSM-IV scale items alone and third of all items combined. In each case, the unrotated solution was examined, followed by rotation of two and then three factors.
For most DSM-IV analyses, item scoring was dichotomous (as shown in Table ), following the method of scoring used to estimate the national prevalence of problem gambling (Wardle et al., Citation2007). This is appropriate for a diagnostic instrument with diagnosis based on the number of symptoms (out of 10) met by an individual respondent. However, such analyses fail to utilise all the data provided by the 10 DSM-IV items. Therefore, some analyses are reported based on a more complete use of DSM-IV data, scoring each item 0, 1, 2 or 3 according to the response option selected. The sum of those scores yielded a total DSM-IV score ranging from zero to 30 comparable to total PGSI scores that ranged from zero to 27. All analyses are based on unweighted data since the purpose here was not that of arriving at whole population estimates (Strong & Kahler, Citation2007).
Results
Internal reliability and item response analysis
Analysis of the data showed that α was 0.90 for the nine PGSI items and 0.73 for the 10 DSM-IV items (compared to 0.76 for the DSM items in the 1999/2000 BGPS Orford et al. (Citation2003)). Further analyses revealed that the α for the DSM-IV items is increased to 0.78 if, instead of treating each item as a dichotomy (i.e. whether the criterion is met or is not met), all four response options are given separate scores (0, 1, 2, 3). Internal reliability is therefore good for PGSI, but only satisfactory for the DSM-IV-based scale.
A coherent set of items with good internal reliability requires that each item contributes well to the total scale. One measure of that is the correlation between an item and the score for the total scale. Item-total correlations are shown in the second column of Table (the DSM-IV scale) and Table (PGSI). An alternative (but closely related) index of the contribution of an item is the loading of the item on the first unrotated factor produced by a factor analysis of the matrix of inter-item correlations (shown in the third column of Tables and ). From Table it can be seen that DSM-IV item 1 (chasing losses) performed poorly according to each of those two criteria (the internal reliability analysis indicated that α would have been considerably higher, 0.82 compared to 0.73, if item 1 were excluded from the analysis). Item 8 (gambling-related crime) also performed relatively poorly, particularly according to the item-total correlation criterion. Of the remaining items, item 2 (preoccupation with gambling) performed least well.
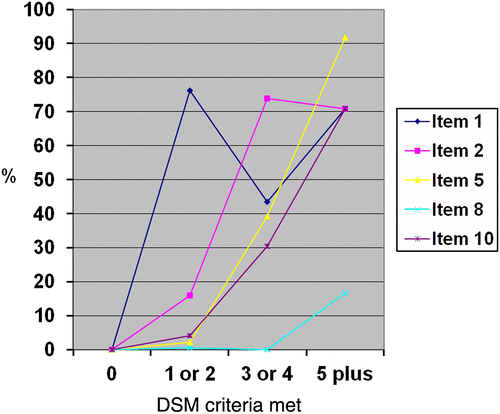
Further insight into the performance of those items is obtained by examining the overall frequency of endorsement of each item (shown in the first column of Table ) and the variation in item endorsement across sub-groups with different total scores. In the case of the DSM based scale the four sub-groups used in that analysis are those who scored 0, 1–2, 3–4 and 5 or more out of the 10 DSM-IV criteria. This constitutes a visual form of item response analysis. The results of this analysis are shown in Figure . Response curves are shown for the questionable items 1, 2 and 8 and, for comparison purposes, two of the remaining items, 5 and 10 (gambling to escape, and asking others for money). This shows clearly why items 1, 2 and 8 performed less well than items such as 5 and 10 (items 3, 4, 6, 7 and 9 have response curves of similar shape). All the latter items produce curves showing a steady increase in endorsement across the four sub-groups. Item 1 (chasing losses) performs particularly badly, with a higher rate of endorsement among those in the relatively low scoring sub-category (those with a total score of only 1 or 2) than in the higher scoring categories (those scoring 3 or more, corresponding to the survey definition of problem gambler). Although the profile of item 2 (preoccupation with gambling) is less extreme, it is the only item that fails to show the expected increase in endorsement between those scoring a total of 3 or 4 (some would confine the term problem gambler to this sub-group) and those scoring 5 and above (whom some would refer to as pathological gamblers). Item 8 (gambling-related crime) is a relatively poor item for a different reason. It has the lowest overall rate of endorsement and endorsement is virtually confined to a minority of even those scoring a total of 5 and above. It is interesting to note that it is the three items for which overall endorsement is outside the range 0.4–0.8% that turn out to be the poorest performing items. Item 8's rate of endorsement is too low to be able to discriminate. Although a high rate of endorsement need not be associated with a less than ideal item response profile, it is the case here that the two most frequently endorsed items (particularly item 1) show non-ideal profiles.
Figure 1 Item response analysis for five selected DSM items used in the 2007 British Gambling Prevalence Survey.
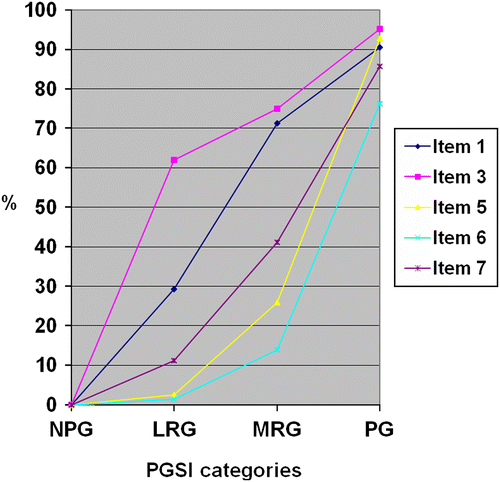
The equivalent analyses for the PGSI are shown in Table and Figure . These show, consistent with the good α coefficient obtained, that each item performed well. Each shows a satisfactory item-total correlation, a good loading on the first unrotated factor in a factor analysis, and an item response profile showing regularly increasing endorsement across sub-groups with increasing total scores (for ease of presentation only five items are shown in Figure : the remaining all showed similar item-response curves). The least satisfactory item, item 3 (chasing losses), is the item with the highest overall level of endorsement. The item analysis in fact suggested that its elimination would increase the α coefficient slightly (from 0.902 to 0.915). Note that the content of this item – about going back to win back money lost, or ‘chasing’ − is very similar to the worst performing DSM-IV item.
Figure 2 Item response analysis for five selected PGSI items used in the 2007 British Gambling Prevalence Survey (NPG – non-problem gambling; LRG – low risk gambling; MRG – moderate risk gambling; PG – problem gambling).
Differential item response according to age, sex and area deprivation
Differential item endorsement by age
Rates of endorsement of PGSI items varied relatively little by age. The younger/older ratio varied from a high of 3.6 (item 2; gambling with larger amounts) to a low of 2.2 (item 9; guilt about gambling). In fact the items fell into two clusters: the first four items with the higher ratios of younger to older endorsement (ratios between 3.0 and 3.6) and the last five items with the lower ratios (between 2.2 and 2.4). The variation between DSM-IV items in this respect was larger, varying from a high of 3.6 (item 3; gambling with more money) to a low of 0.9 (item 9; gambling-related social harm). Ratios for other items lay between 1.7 and 2.6.
Differential item endorsement by sex
PGSI male to female endorsement ratios were very different from item to item, varying from a high of 7.0 (item 5; having a gambling problem) to a low of 2.2 (item 3; chasing losses). Items 1 and 9 (bet more than can afford; guilt about gambling) also had low male to female ratios (below 3.0). Items 6, 7 and 8 (gambling-related health harm; others' comments on gambling; gambling-related financial harm) were others with high ratios (above 5.0). DSM-IV items varied less in this respect, from the highest male to female ratio of 5.2 (item 6; lied to others about gambling) to a low of 1.6 (item 1; chasing losses).
Differential item endorsement by area deprivation
PGSI high deprivation/low deprivation item endorsement ratios varied from a high of 3.9 (item 6; gambling-related health harm) to a low of 1.6 (item 3; chasing losses). Most items produced ratios in the range 1.6–2.1. Apart from item 6, three other items produced relatively high ratios in the range 2.9–3.0 (items 4, 8 and 9; borrowed or sold to gamble; gambling-related financial harm; and guilt about gambling). Two DSM-IV items stood out from the others by having much higher high deprivation/low deprivation endorsement ratios of 6.6 (item 8; gambling-related crime) and 5.2 (item 10; asked others for money). All other DSM-IV items produced ratios in the range 1.4–3.3.
Factor analyses
Principal components factor analysis of the PGSI confirmed the view, already suggested by the scale's high α value for internal reliability, of a coherent set of items measuring a single underlying construct. Only one component produced an eigenvalue greater than 1.0. That factor accounted for 61.5% of the variance; the second factor accounted for only 8.8%. Attempts to identify more than one meaningful factor met with limited success. Extraction of two factors with orthogonal (varimax) rotation separated items 1 and 3 into a second factor, with items 4–9 loading on the first rotated factor, and item 2 loading nearly equally on both. Extraction of three factors with orthogonal rotation separated the first factor into two: items 5, 7, 8 and 9 loading on the first, and items 2, 4 and 6 loading on the second. Items 1 and 3 remained apart in the third factor.
Factor analysis of the DSM-IV items was carried out twice: once entering each item as a dichotomy (i.e. whether the DSM-IV criterion is met), and secondly using all four response options (scored 0, 1, 2 or 3). The results were very similar but the latter solution was the clearest and is the one reported here. Two components had eigenvalues greater than 1.0, accounting for 45.0% and 12.2% of the variance respectively, before rotation. Extraction of two factors with orthogonal rotation produced approximately equal sized factors: items 8, 9 and 10 loaded most highly on the first, and items 1, 2 and 3 most highly on the second. Items 4–7 loaded approximately equally on the two rotated factors. Factor loadings are shown in Table .
Table 3. Factor analysis of the DSM items used in the 2007 British Gambling Prevalence Survey: loadings on two rotated factors.
PGSI/DSM agreement
Table shows the cross-tabulation of four categories of respondents according to the PGSI, and three categories according to the DSM-IV scale (using dichotomous DSM-IV item scoring). According to a strict definition of agreement, it can be seen that only 30 respondents were classified as problem gamblers according to both scales, with PGSI failing to classify as problem gamblers 17 DSM-IV problem gamblers, and the DSM-IV scale failing to classify as problem gamblers 11 PGSI problem gamblers (κ = 0.68). Taking a more lenient view, Table shows only four cases of extreme disagreement: two DSM problem gamblers categorised by PGSI as showing no risk and two PGSI problem gamblers scoring zero on the DSM-IV scale. If a DSM-IV threshold of five or more is taken as definitive of a serious problem (‘pathological gambling’) then PGSI misclassifies only four cases (all categorised as being at moderate risk by PGSI) whereas DSM-IV now misclassifies no fewer than 19 PGSI problem gamblers.
Table 4. Agreement between the PGSI and DSM scales used in the 2007 British Gambling Prevalence Survey.
A more complete picture of the association between the two scales is obtained if all the DSM-IV data are used (scoring each DSM-IV item 0, 1, 2 or 3 as for PGSI items) and both scales are treated as continuous. The Pearson correlation is high (r = 0.82) and highly significant. Because the data are so skewed (the majority of the sample scoring zero on both scales) either a Pearson correlation of the two variables after both are transformed by taking the square roots of all values (r = 0.65) or a non-parametric correlation (Spearman's ρ = 0.51) provide more realistic but still substantial and highly significant correlations. It could be argued that these correlations are unduly inflated by the existence of two almost identical items in the two scales (DSM item 1 and PGSI item 3; DSM item 3 and PGSI item 2). With those four items removed the inter-scale correlations remained highly significant and were hardly changed in magnitude.
Discussion
To our knowledge, this is the first study where two of the main scales for the population survey assessment of problem gambling have been used in a single, large general population survey. The comparison of their performance in the second BGPS (Wardle et al., Citation2007) suggests that the Canadian Problem Gambling Severity Index (PGSI) performed rather better than the scale based on the American Psychiatric Association's Diagnostic and Statistical Manual, fourth edition (DSM-IV). The PGSI had a good level of internal reliability of 0.90, very similar to the 0.86 reported by Holtgraves (Citation2009) for a large Canadian general population data set. He also concluded, as this study does, that responses to PGSI items are in accordance with the assumption of uni-dimensionality. A factor analysis of the Canadian PGSI data also yielded a single factor with an eigenvalue greater than unity, explaining, in that study, 49% of the variance compared to 61.5% in the present analysis. All PGSI items in the present analysis were found to be contributing to the total, although the least satisfactory psychometrically was item 3. This was the item about ‘chasing losses’ and was the most frequently endorsed of all PGSI items.
One important area of potential concern about the PGSI was identified by the present analysis of the ratio of male to female endorsement. Although all PGSI and DSM-IV items showed a greater male than female endorsement rate, PGSI contained a larger number of items with extremely high ratios (men endorsing the item at least five times as often as women) and a lower proportion of items with more equitable rates of endorsement by the two sexes. An inspection of the content of PGSI items suggests a reason for this. Each of the more extreme male-endorsed items (numbers 5, 6, 7 and 8) explicitly refer either to having a gambling problem (item 5) or to specific problems caused by gambling (items 6 and 8), or to criticism from others about having a gambling problem (item 7). Young and Stevens (Citation2008), in a general population survey in the Northern Territory, Australia, also found items 5 and 7 to be those showing the higher male to female endorsement ratios. In view of the fact that people are generally more reluctant to explicitly acknowledge having a gambling-related problem than they are to admit to certain feelings or behaviours known to be associated with problem gambling, this is a potential weakness of the PGSI.
This weakness may have resulted in a relative under-estimate of female problem gambling in the British prevalence survey. The prevalence of problem gambling for women was estimated at 0.2% according to the DSM-IV scale, but only 0.1% according to PGSI. For men, the estimates were identical at 1.0% on both screens (Wardle et al., Citation2007). McMillen and Wenzel (Citation2006) noted that the PGSI, compared to other scales, such as the South Oaks Gambling Screen and the Victorian Gambling Screen, has no questions covering losing control over gambling or gambling as escapism. These are both areas covered by the DSM-IV scale used in the present study (items 5 and 7), and both produced more moderate male to female endorsement ratios (particularly DSM-IV item 5 about gambling to escape from problems or when feeling depressed, anxious or bad about oneself). In a large US population survey, Strong and Kahler (Citation2007) also found the gambling to escape DSM-IV criterion to be the one that stood out compared to other items as being relatively highly endorsed by women. This was also suggested by the findings of an in-depth qualitative study interviewing 50 problem gamblers that proposed a grounded theory of problem gambling as an escape-based coping strategy (Wood & Griffiths, Citation2007).
In some other respects, the DSM-IV scale used here was found to be less than ideal. The internal reliability of 0.73 (or 0.78 if all the response options are treated separately), which is similar to the 0.79 found by Fisher (Citation1996) in her study of casino patrons, the 0.76 found in the earlier BGPS and the 0.81 found by Stinchfield (Citation2002, Citation2003) in a general population study in Minnesota, USA, although satisfactory, is not as good as might be expected for a 10-item scale that purports to be uni-dimensional. Items 1 and 8, about chasing losses and crime to fund gambling, respectively, did not contribute well to the DSM-IV scale as a single construct, but for different reasons. Item 1 had, compared to other items, an extremely high rate of endorsement with too many false positives (i.e. endorsements by respondents who did not endorse other items). Item 8 had a very low rate of endorsement and too many false negatives (i.e. the majority of those who scored most highly on other items did not endorse this item). Both Strong and Kahler (Citation2007) in a large US population survey, and Zimmerman, Chelminski and Young (Citation2006) in an interview study of psychiatric outpatients, found the DSM-IV crime criterion to be the one that was least often met, and Zimmerman et al. recommended its elimination. Zimmerman et al. (Citation2006) also found ‘chasing’ produced the highest number of false negatives (present among out-patients not independently diagnosed as problem gamblers). Strong and Kahler (Citation2007) did not find their chasing item to have such an extreme rate of endorsement (perhaps because the item wording included the qualifier ‘often’) but they did find that it stood out as the item with the most extreme bias according to age, with a much higher rate of endorsement among those aged less than 25 years.
The factor analysis of DSM-IV items produced a result remarkably similar to that produced by the analysis of data from the 1999/2000 BGPS (Orford et al., Citation2003). This again suggested that the DSM-IV scale is more appropriately seen as consisting of two factors rather than one when used in a general population sample. Once again, items 1, 2 and 3 (chasing losses, preoccupation and needing to gamble with more and more money, respectively) were particularly characteristic of one factor, which may be thought of as assessing gambling dependence. Items 8, 9 and 10 (crime, risking relationship, job, etc. and asking others for money, respectively) were particularly indicative of the second factor, which might be thought of assessing gambling-related harm. As in the earlier analysis, Items 6 and 7 (lying to family, etc., and making unsuccessful attempts to control gambling, respectively) loaded equally on the two factors. The only difference compared to analysis of the earlier data was that items 4 and 5 (restless or irritable when trying to cut down and gambling to escape, respectively) loaded roughly equally on the two factors in the present analysis whereas they had been aligned with the gambling-related harm factor in the earlier analysis.
There is some disagreement in the literature about the dimensionality of DSM-IV criteria. Stinchfield (Citation2002) produced evidence, similar to that presented here and that of the earlier BGPS survey, that the first unrotated component of a factor analysis accounted for less than half the variance (45% in that case compared to 40% in the 1999/2000 BGPS and 45% in the present survey), whereas Strong and Kahler (Citation2007) reported a first factor accounting for no less than 69% of the variance, and a very small second factor, which they interpret as being consistent with the uni-dimensionality of DSM-IV items. It is very possible that inconsistent results using DSM-IV scales can be attributed to different item wording, methods of administration, response options and sampling.
Finally, it can be noted that, although all items in both scales show higher endorsement by respondents living in areas of relatively high deprivation compared to those in low deprivation areas, two DSM-IV items produced particularly high ratios: gambling-related crime and asking others for money.
In summary it is concluded that neither of the two methods for assessing problem gambling were free of deficiencies that are potentially important. The Canadian instrument, the better one in terms of internal reliability, uni-dimensionality and item response characteristics, is heavily weighted towards items that require for their endorsement an explicit recognition of problem gambling. It may, therefore, under-estimate certain forms of gambling-related harm that may be better picked up by some of the DSM-IV-based scale's items. Therefore, it is possible that the PGSI is liable to produce an under-estimate of the prevalence of problem gambling in a population, particularly the prevalence among some groups. The latter may include women and, according to Young and Stevens (Citation2008), indigenous people in countries such as Australia.
The DSM-IV-based scale used in the two BGPSs has even more serious limitations as a population survey measure of a single construct, problem gambling. Treated as a single set of items, its internal reliability is only satisfactory and there is now evidence from two British prevalence surveys that it is more appropriately seen as subsuming two separate factors – gambling dependence and gambling-related harm. At least two of the DSM-IV items performed poorly. The item about gambling-related crime is disproportionately endorsed by problem gamblers living in areas of relatively higher deprivation but is otherwise quite insensitive to the existence of problem gambling. The item about ‘chasing losses’ shows low specificity to problem gambling. The British prevalence studies are not alone in drawing attention to problems concerning these two criteria. The issue regarding crime is straightforward: an item about gambling-related crime may simply be too extreme to be valuable in a general population survey. The issue regarding ‘chasing losses’ is perhaps more interesting. The present results may be taken as casting some doubt on whether chasing losses – considered by many to be of central importance in problem gambling (Dickerson, Citation1990; Lesieur, Citation1994) – is as useful a sign of problem gambling as has generally been assumed. Alternatively, future studies may wish to include some reference to the repeated chasing of losses as this is more likely to be associated with problem gambling.
This paper has concentrated on the psychometric properties of two of the leading problem gambling assessment instruments. The paper has not addressed, except in passing, the wider issue of how problem gambling is best conceptualised and what assumptions are built into instruments such as the PGSI and the DSM-IV-based scale. Although Abbott and Volberg (Citation2006) and Svetieva and Walker (Citation2008) believe that these and other scales are based on rather similar understanding of what constitutes problem gambling and how it should be measured, it is the authors' contention that the construction of the PGSI has shifted our understanding towards a view of problem gambling as lying on a continuum (e.g. no risk, low risk, moderate risk, problem gambling) and away from the diagnostic view that leads to acceptance of a dichotomous approach (each criterion is either met or not met and a certain number of criteria met can be taken as an agreed indication that an individual is above the threshold for problem gambling). In the present paper we have in places scored the DSM-IV in a way more consistent with the continuity assumption and careful thought should be given to using such data in that way in future research.
Acknowledgements
We wish to acknowledge the support of the Gambling Commission who commissioned the British Gambling Prevalence Survey of which the work reported in this paper was part. Our thanks are also due to Pat Evans of the Alcohol, Drugs, Gambling and Addiction Research Group at the University of Birmingham who prepared draft and final versions of this paper.
Notes
1. Based on deprivation in the seven domains of income, employment, health deprivation and disability, education, skills and training, barriers to housing and services, crime, and living environment, each respondent in England was assigned to one of five approximately equal sized categories according to postcode area. In the analysis reported here the highest two quintiles (most deprived) were combined and compared with the lowest two categories combined (low deprivation).
Related Research Data
References
- Abbott , M.W. and Volberg , R.A. 2006 . The measurement of adult problem and pathological gambling . International Gambling Studies , 6 : 175 – 200 .
- American Psychiatric Association (APA) . 1994 . Diagnostic and statistical manual of mental disorders , 4th edn , Washington DC : American Psychiatric Association .
- Dickerson , M. 1990 . Gambling: The psychology of a non-drug compulsion . Drug and Alcohol Review , 9 : 187 – 199 .
- Ferris, J., & Wynne, H. (2001). The Canadian Problem Gambling Index user manual. Report to the Canadian Inter-Provincial Task Force on Problem Gambling, The Canadian Centre on Substance Abuse
- Fisher, S.E. (1996). Gambling and problem gambling among casino patrons. Report to the British Casino Industry Consortium, University of Plymouth
- Gerstein , D. , Volberg , R. , Harwood , H. and Tucker , A. 1999 . Gambling impact and behavior study. Report to the National Gambling Impact Study Commission. , National Opinion Research Center at the University of Chicago New York : Christiansen/Cummings Associates .
- Holtgraves , T. 2009 . Evaluating the problem gambling severity index . Journal of Gambling Studies , 25 : 105 – 120 .
- Lesieur , H.R. 1994 . Epidemiological surveys of pathological gambling: Critique and suggestions for modification . Journal of Gambling Studies , 10 : 385 – 397 .
- Lesieur , H.R. and Blume , S.B. 1987 . The South Oaks Gambling Screen (SOGS): A new instrument for the identification of pathological gamblers . American Journal of Psychiatry , 144 : 1184 – 1188 .
- McMillen , J. and Wenzel , M. 2006 . Measuring problem gambling: Assessment of three prevalence screens . International Gambling Studies , 6 : 147 – 174 .
- Orford , J. , Griffiths , M. , Wardle , H. , Sproston , K. and Erens , B. 2009 . Negative public attitudes towards gambling: Findings from the 2007 British gambling prevalence survey using a new attitude scale . International Gambling Studies , 9 : 39 – 54 .
- Orford , J. , Sproston , K. and Erens , B. 2003 . SOGS and DSM-IV in the British gambling prevalence survey: Reliability and factor structure . International Gambling Studies , 3 : 53 – 65 .
- Stinchfield , R. 2002 . Reliability, validity and classification accuracy of the South Oaks Gambling Screen (SOGS) . Addictive Behaviors , 27 : 1 – 19 .
- Stinchfield , R. 2003 . Reliability, validity and classification accuracy of a measure of DSM-IV diagnostic criteria for pathological gambling . American Journal of Psychiatry , 160 : 180 – 182 .
- Stinchfield , R. , Govani , R. and Frisch , G.R. 2005 . DSM-IV diagnostic criteria for pathological gambling: Reliability, validity, and classification accuracy . The American Journal on Addictions , 14 : 73 – 82 .
- Strong , D.R. and Kahler , C.W. 2007 . Evaluation of the continuum of gambling problems using the DSM-IV . Addiction , 102 : 713 – 721 .
- Svetieva , E. and Walker , M. 2008 . Inconsistency between concept and measurement: The Canadian Problem Gambling Index (CPGI) . Journal of Gambling Issues , 22 : 157 – 173 .
- Wardle , H. , Sproston , K. , Orford , J. , Erens , B. , Griffiths , M. , Constantine , R. and Pigott , S. 2007 . British gambling prevalence survey 2007 , London : The Stationery Office .
- Wood , R.T.A. and Griffiths , M.D. 2007 . A qualitative investigation of problem gambling as an escape-based coping strategy . Psychology and Psychotherapy: Theory, Research and Practice , 80 : 107 – 125 .
- Young , M. and Stevens , M. 2008 . SOGS and CGPI: parallel comparison on a diverse population . Journal of Gambling Studies , 24 : 337 – 356 .
- Zimmerman , M. , Chelminski , I. and Young , D. 2006 . A psychometric evaluation of the DSM-IV pathological gambling diagnostic criteria . Journal of Gambling Studies , 22 : 329 – 337 .