
ABSTRACT
Gambling disorder (GD) is characterized by an inability to stop or control gambling behaviour and is often accompanied by gambling-related cognitive distortions. Task-based functional Magnetic Resonance Imaging (fMRI) studies have revealed abnormal responses within the prefrontal and insular cortex, and mesolimbic reward regions. Studies examining resting-state functional connectivity in GD, although limited in number, have so far applied seed-based analysis approaches which revealed altered brain functioning. Here, we applied data-driven Independent Components Analysis to resting-state multi-echo fMRI data. Networks of interest were selected by spatially correlating them to independently derived network templates. Using dual regression, we compared connectivity strength between 20 GD patients and 20 healthy controls within 4 well-known networks (the ventral attention, limbic, frontoparietal control, and default mode network) and an additional basal ganglia component. Compared to controls, GD patients showed increased integration of the right middle insula within the ventral attention network, an area suggested to play an important role in addiction-related drive. Moreover, our findings indicate that gambling-related cognitive distortions – a hallmark of GD – were positively related to stronger integration of the amygdala, medial prefrontal cortex and insula within various resting-state networks.
Introduction
Gambling disorder (GD) is a behavioural addiction characterized by an inability to stop or control gambling behaviour and is often accompanied by gambling-related cognitive distortions; that is, false beliefs about skill and chance in gambling games. Neuroimaging studies in GD have revealed abnormalities in a wide range of cognitive functions (van Timmeren, Daams, van Holst, & Goudriaan, Citation2018) and associated brain responses (van Holst, van den Brink, Veltman, & Goudriaan, Citation2010). Most studies have focused on decision-making in GD, showing consistent disadvantageous risky decision-making in GD, accompanied by abnormal responses within prefrontal control regions, mesolimbic reward regions and the insula (Fauth-Bühler, Mann, & Potenza, Citation2017; Limbrick-Oldfield et al., Citation2017). However, such task-related functional Magnetic Resonance Imaging (fMRI) studies could be confounded by the fact that many decision-making tasks resemble gambling games, which are experienced differently by gamblers compared to healthy control subjects (HCs). Elicited brain responses could therefore be related to, for example, experience or motivation, rather than dysfunction. A more unbiased and practical approach to study brain activity in GD is to study ‘spontaneous’ fluctuations of the brain during rest. Such resting-state fMRI studies assess functional connectivity within and between circuits and systems, based on the temporal correlation of the blood oxygenation level-dependent (BOLD) signal.
Various approaches to analysing resting-state fMRI data exist, but the two most frequently used in the literature are seed-based connectivity and spatial Independent Component Analysis (ICA) methods. Seed-based connectivity analysis is a spatially model-driven approach, in which the BOLD time course of one predefined seed region is temporally correlated with the BOLD time courses of all other voxels in the brain (Joel, Caffo, Van Zijl, & Pekar, Citation2011). ICA-based approaches, on the other hand, decompose whole brain responses into components that are statistically maximally independent (Beckmann, DeLuca, Devlin, & Smith, Citation2005; Fox & Raichle, Citation2007) and offer a data-driven approach to detect resting-state networks. Thus, while seed-based methods strongly rely on a priori assumptions regarding the selected regions of interest, ICA is a model-free and multivariate method (Fox & Raichle, Citation2007). This switches the focus from evaluating the functional connectivity of single brain regions to evaluating brain connectivity in terms of all networks that are simultaneously engaged in oscillatory activity (Nickerson, Smith, Öngür, & Beckmann, Citation2017).
Studies examining resting-state functional connectivity in GD have so far been scarce, but have mostly relied on seed-based methods. In one of the first resting-state studies in GD, higher functional connectivity between the right middle frontal gyrus and the right striatum was observed in GD patients compared to controls using a seed-based approach (Koehler et al., Citation2013). Another seed-based connectivity study found that, when compared to controls, cocaine dependent patients and GD patients showed overlapping increases in local connectivity within the orbitofrontal cortex and amygdala, between the orbitofrontal cortex and the dorsomedial prefrontal cortex and striatum, and between the amygdala and insula (Contreras-Rodríguez et al., Citation2016). This study also revealed that cocaine dependent patients and GD patients displayed decreased connectivity between the amygdala and cerebellum. Besides increases of connectivity within the (meso)limbic and frontostriatal circuit, GD has been associated with decreased default mode network connectivity in the left superior frontal gyrus, right middle temporal gyrus, and precuneus (Jung et al., Citation2014). Moreover, Tschernegg et al. (Citation2013) used a graph-theoretical approach to examine frontostriatal functional connectivity and observed increased functional connectivity between the caudate nucleus and anterior cingulate in GD patients compared to controls. To sum up, three out of four resting-state studies in GD have used seed-based methods and have generally revealed connectivity differences in GD patients, mostly in regions implicated in reward processing and cognitive control.
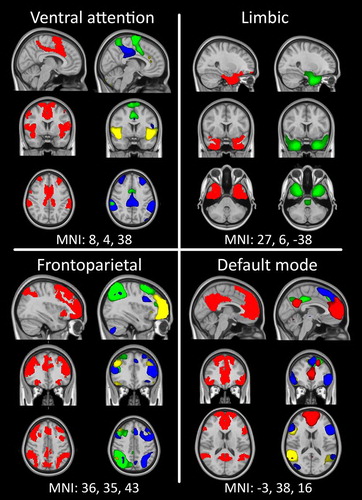
We here applied a group-ICA in combination with dual regression to assess the intrinsic functional connectivity in networks potentially implicated in GD. To further optimize our data-driven approach, we used functional connectivity networks derived from an independent group of 1000 healthy individuals (Yeo et al., Citation2011) as templates to select our resting-state networks of interest. Based on the previous seed-based findings described above, we focus on four well-known networks (Figure ): (i) the ventral attention network, also referred to as the salience (Seeley et al., Citation2007) or cingulo-opercular network (Dosenbach et al., Citation2007), which is thought to modulate attention to internal and external stimuli and includes regions such as the amygdala, insula, inferior frontal gyrus and the pregenual cingulate; (ii) the limbic network, which is involved in processing emotions, including the amygdala, hippocampus and temporal cortices; (iii) the frontoparietal control network (Dosenbach et al., Citation2007; Vincent, Kahn, Snyder, Raichle, & Buckner, Citation2008), implicated in adaptive control over behaviour and associated with the dorsolateral prefrontal cortex, premotor cortex and parietal cortex; and (iv) the default mode network, which characterizes the resting state of the human brain and primarily comprises the anterolateral temporal cortex, parahippocampal gyrus, thalamus, pons and cerebellum, as well as part of the medial prefrontal cortex and the posterior cingulate cortex (Buckner, Andrews-Hanna, & Schacter, Citation2008; Greicius, Krasnow, Reiss, & Menon, Citation2003). While most previous resting-state studies in GD have focused on connectivity with the mesolimbic reward circuitry (e.g. Contreras-Rodríguez et al., Citation2016; Koehler et al., Citation2013), the networks that were selected using the templates from Yeo et al (Citation2011) did not cover mesolimbic areas. Therefore, we additionally included a network encompassing the basal ganglia, which was derived from our ICA. We examined differences in connectivity strength within these identified resting-state networks between 20 GD patients and 20 HCs. Moreover, because we were interested to test whether individual variation in the strength of specific resting-state networks was related to gambling severity and gambling cognitive distortions, we also tested this within the GD group.
Figure 1. Reference networks (Yeo et al., Citation2011) are well matched to resting-state networks used in the current study. The reference network is plotted on the left in red, while individual ICs (significantly overlapping with that reference network) are plotted in contrasting colours within a single image on the right. All overlays are thresholded at 3 < z < 6.
Materials and methods
Participants
A total of 21 individuals diagnosed with GD (17 males) were recruited from a local addiction treatment centre (Jellinek, Amsterdam), and 20 HCs (17 males) were recruited through advertisements. All data were collected between December 2015 and May 2017. The ethical review board of the Academic Medical Centre approved the study, and all participants provided written informed consent.
Patients with GD were included if they were diagnosed with, and started therapy for, GD (at least one and on average 19.6 weeks prior to participation). Patients were abstinent for an average of 6 weeks (range 0–26 weeks). All subjects underwent a structured psychiatric interview (Mini-International Neuropsychiatric Interview–Plus; Sheehan, Lecrubier, & Sheehan, Citation1998), which further confirmed criteria for DSM-5 Gambling Disorder in the GD group, or the lack thereof in HCs. Exclusion criteria for all subjects included: lifetime history of bipolar disorder, anxiety disorder, obsessive-compulsive disorder or schizophrenia; past six-month history of major depressive episode; current or past-year substance use disorder; current psychiatric treatment (except for GD in GD patients); the use of any psychotropic medication; positive urine screen for (meth)amphetamines, benzodiazepines, opioids, cocaine, ecstasy, PCP, methadone or cannabis; history or current treatment for neurological disorders; major physical disorders; brain trauma; exposure to neurotoxic factors; or any contraindications for MRI. One patient tested positive on THC use, but informed us that the subject used marijuana once, seven days prior to participation. Because our inclusion criteria allowed drug use until 72 hours prior to inclusion, this subject was included for further analyses.
All participants completed the Fagerstrom Test for Nicotine Dependence (FTND; Heatherton, Kozlowski, Frecker, & Fagerström, Citation1991) and the Alcohol Use Disorders Identification Test (AUDIT; Saunders, Aasland, Babor, de la Fuente, & Grant, Citation1993). Furthermore, in GD patients, the experience of gambling-related problems was assessed using the past-12-month Problem Gambling Severity Index (PGSI; Ferris & Wynne, Citation2001) and the Gamblers’ Beliefs Questionnaire (GBQ; Steenbergh, Meyers, May, & Whelan, Citation2002). The GBQ contains 21 items (e.g. ‘My choices or actions affect the game on which I am betting’ or ‘I am pretty accurate at predicting when a “win” will occur’), with higher scores reflecting more gambling-related distortions.
One male subject was excluded due to excessive head motion (>5 mm movement in any direction relative to the first volume) during the fMRI session, resulting in a total of 20 GDs and 20 HCs for further analysis. The groups significantly differed on gross motion (p = 0.012) as calculated by mean relative framewise displacement (FD) (Jenkinson, Bannister, Brady, & Smith, Citation2002), with GDs showing higher motion (mean = 0.187, SD = 0.162, range 0.047–0.682) than HCs (mean = 0.094, SD = 0.042, range 0.039–0.211). We additionally report analyses excluding two GD subjects with FD > 0.55 mm (following criteria similar to Satterthwaite et al., Citation2013), which rendered the group differences on FD non-significant (p = 0.62; GD-group: mean = 0.1347, SD = 0.67, range 0.047–0.301).
Procedure
Participants were in the scanner in supine position and were instructed to relax and keep their eyes open while attending to a centrally presented white fixation cross on a black projection screen for ~8 minutes. These data were collected as part of a larger study protocol including questionnaires, neuropsychological testing and multiple fMRI tasks, data of which will be presented elsewhere. The fMRI tasks, which included a combined cue reactivity/monetary incentive delay task, were performed prior to the resting-state scan.
Magnetic Resonance Imaging
MRI measurements were acquired using a 3-Tesla (T), full-body Philips Intera MRI scanner equipped with a 32-channel phased array SENSE radiofrequency (RF) receiver head coil. For resting-state data acquisition, we used a multi-echo planar sequence for its improved blood oxygenation level-dependent (BOLD) sensitivity and lower susceptibility for artifacts, especially for ventral regions (Poser, Versluis, Hoogduin, & Norris, Citation2006). A total of 200 BOLD scans were acquired using a T2*-weighted gradient multi-echo echoplanar imaging (EPI) sequence (Poser et al., Citation2006) with the following parameters: repetition time (TR) = 2375 ms; echo time (TE) = 9 / 26.4 / 43.8 ms; flip angle = 76°; field of view (FOV) = 224 x 121.8 x 224 mm; voxel size = 3 x 2.95 x 3 mm; matrix size = 76 x 73; slice thickness = 3 mm; slice gap = 0.3 mm; number of slices = 37, acquired in interleaved order. The first three scans were discarded to allow T1 saturation to reach equilibrium.
Additionally, we acquired a high resolution T1-weighted anatomical image (voxel size = 1 x 1 x 1 mm; FOV = 236.679 x 180 x 256 mm; TR = 6.862 ms; TE = 3.14 ms, 150 slices, slice thickness = 1.2 mm, sampling matrix = 212 x 212 x 150, flip angle = 8°).
Statistical analyses
Demographics and clinical data were analysed for group differences with two-sampled t-tests and Pearson’s chi-square tests using SPSS 22.0 (IBM Corporation).
Preprocessing
Raw multi-echo fMRI data were first processed according to Poser et al. (Citation2006). Realignment parameters were estimated for the images acquired at the first echo time and consequently applied to images resulting from the three other echoes using SPM12 software (Wellcome Trust Centre for Neuroimaging, London). This is compliant with recent work that suggests that motion is more appropriately controlled if realignment parameters are estimated before any interpolation is done on the data (Power, Plitt, Kundu, Bandettini, & Martin, Citation2017). Thirty volumes, acquired independently from the resting-state scan, were used to calculate the optimal weighting of echo times for each voxel by applying a PAID-weight algorithm (Poser et al., Citation2006). These weightings were then used to combine multi-echo fMRI data into single volumes.
All further processing of MRI data was performed in FSL 5.09 (FMRIB’s Software Library, www.fmrib.ox.ac.uk/fsl). Preprocessing was carried out using FEAT (FMRI Expert Analysis Tool) Version 6.00. The following pre-statistics processing was applied; non-brain removal using BET (Smith, Citation2002); spatial smoothing using a Gaussian kernel of FWHM 6.0 mm; grand-mean intensity normalization of the entire 4D data-set by a single multiplicative factor. Registration of functional data to the high resolution structural image was carried out using the boundary based registration (BBR) algorithm (Greve & Fischl, Citation2009). Registration of the high resolution structural image to standard space was carried out using FLIRT (Jenkinson & Smith, Citation2001; Jenkinson et al., Citation2002) and was further refined using FNIRT nonlinear registration (Andersson, Jenkinson, & Smith, Citation2007a,Citationb). Tissue segmentation was performed using FAST (Zhang, Brady, & Smith, Citation2001).
Because resting-state functional MRI is especially sensitive to motion artifacts (e.g. Power, Barnes, Snyder, Schlaggar, & Petersen, Citation2012), we used ICA-AROMA (Pruim et al., Citation2015b) to remove motion-related artifacts from the individual resting-state data. Previous studies have shown that cleaning based on single-subject ICA significantly increases reproducibility (Pruim, Mennes, Buitelaar, & Beckmann, Citation2015a). We followed the methods as described by Pruim et al. (Citation2015b): first, ICA was used to decompose the data into a set of independent components. Next, the components that were related to head motion were identified by the AROMA algorithm and regressed out from the data. Additionally, compliant with Pruim et al. (Citation2015b), residual (non-motion related) structured noise was regressed out by using mean white matter and cerebrospinal fluid signal as nuisance regressors. Masks were obtained using FAST’s binary segmentations and eroded once. Recent work by Power, Plitt, Laumann, and Martin (Citation2017) demonstrated that the correlation of those signals with grey matter can be high without extensive erosion, which was indeed the case (r = 0.80 for white matter; 0.55 for cerebrospinal fluid). It is important to note that by using these highly correlated masks as nuisance regressors, we are effectively applying global signal regression; a highly debated processing step which has benefits but can also lead to ‘artefactual’ anti-correlations (for a recent review, see Murphy & Fox, Citation2017). After high-pass filtering, the denoised data was then resampled into MNI space in 4 mm.
Independent component analysis
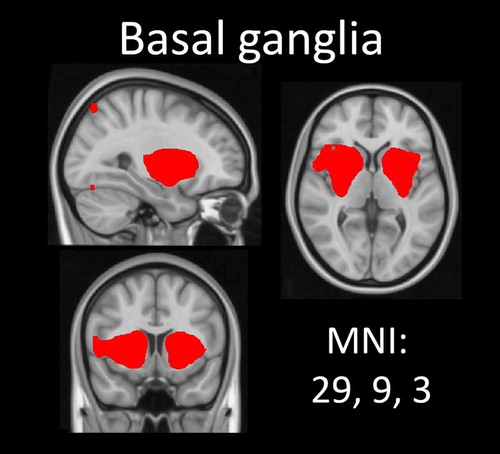
After preprocessing, the temporally concatenated resting-state data of all subjects were analysed using group-ICA (Beckmann & Smith, Citation2004) as implemented in FSL’s MELODIC (3.14). The number of dimensions was estimated using the Laplace approximation to the Bayesian evidence of the model order (Beckmann & Smith, Citation2004; Minka, Citation2001) and yielded 51 components. These group components reflect a variety of structured signals that can exist simultaneously in the data: some are of interest (e.g. patterns of intrinsic functional connectivity) and others are noise (e.g. head motion and physiological noise). Identifying which components are of interest is usually done ‘subjectively’ by an expert. A more objective approach would be to statistically compare each component with a set of reference networks. Following Reineberg, Andrews-Hanna, Depue, Friedman, and Banich (Citation2015), we thus compared all 51 components with a set of online available reference networks from a previous study analysing resting-state data of ~1000 participants (Yeo et al., Citation2011). This study parcellated the cerebral cortex’s connectivity into seven robust networks. Because we did not expect connectivity differences within all of those seven networks, we a priori selected the four following networks to compare to our components: the ventral attention, limbic, frontoparietal and default mode network. Pearson’s r was calculated for each pairwise relationship using FSL’s ‘fslcc’ tool. Only those components that yielded a significant spatial correlation (Pearson’s r > .263) with one of the four selected Yeo networks were selected for further analysis. However, the networks described by Yeo et al. (Citation2011) cover mainly the cerebral cortex. Based on the previous GD resting-state literature (Contreras-Rodríguez et al., Citation2016; Jung et al., Citation2014; Koehler et al., Citation2013), we also wanted to include a component covering the basal ganglia. This component was therefore manually selected for analysis (see Figure ), resulting in a total of five networks of interest.
Figure 2. Basal ganglia network. This network was manually selected based on previous literature. Thresholded at 3 < z < 6.
Dual regression
To compare resting-state network activity between GD patients and HCs, and to identify how network activity varies with gambling severity (PGSI-scores) and the severity of gambling-related distortions (GBQ-scores) within the GD patients, dual regression was used (Beckmann, Mackay, Filippini, & Smith, Citation2009; Filippini et al., Citation2009). Using this approach, the set of spatial maps from the group-ICA were used to generate subject-specific versions of the spatial maps, and associated time series. These subject-specific time-courses were normalized to allow testing for shape and amplitude effects (Nickerson et al., Citation2017). The spatial maps were tested voxel-wise for statistically significant differences between the groups and correlations with gambling severity and gambling beliefs using dual regression’s default settings and FSL randomise nonparametric permutation testing with 5000 permutations, using a threshold-free cluster enhanced (TFCE) technique to control for multiple comparisons (Nichols & Holmes, Citation2001). A Bonferroni correction (two-tailed) for tests over the five networks was applied to reduce the likelihood of committing a Type 1 error, resulting in a reported significance threshold of p < 0.005 (= 0.05 / (2 directions * 5 networks)). For the significant clusters, MNI coordinates are reported.
Results
Groups were matched on gender, age, handedness and alcohol use (Table ). Compared to HCs, the number of education years was significantly lower in GD patients. Moreover, there were significantly more tobacco smoking GD patients than HCs, although the severity of nicotine dependence was similar across groups within smoking subjects.
Table 1. Demographics.
Independent component analysis
A total of 11 ICA components significantly correlated with a reference network: 3 with the ventral attention network, 1 with the limbic network, 3 with the frontoparietal network and 4 with the default mode network. Figure shows the four template networks of Yeo et al. (Citation2011) next to the combined individual components (ICs). Individual plots of the ICs that were obtained using MELODIC for the four reference networks are included in the supplement (Supplementary Figures 1–4). Additionally, we included a manually selected component covering the basal ganglia in our analysis, which did not correlate to any of the reference networks (see Figure ).
Dual regression
Group differences
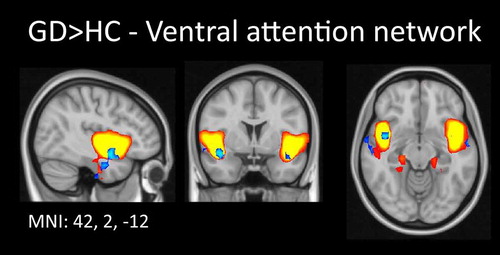
Our dual regression analysis indicated that GD patients showed significantly increased connectivity in the ventral attention network (IC 39), specifically within the right insula (one voxel at x, y, z: 42, 2, –12, p = 0.004, Figure ). No other significant group differences in any of the other networks were observed.
Figure 3. Increased functional connectivity in gambling disordered patients compared to healthy controls within the ventral attention network. The independent component representing part of the ventral attention network, which was used as input for dual regression, is plotted in gradient from red to yellow (3 < z < 6). Comparison of this spatial map between the two groups revealed increased connectivity strength in the right insula in gambling disordered patients. For visualization purposes, these results are shown in blue, thresholded at p < 0.05 (uncorrected). Results are superimposed on a MNI152 standard space template image; orthogonal slices through the peak voxel are shown in radiological convention (right = left).
Association with gambling severity
Within the GD group, we did not find significant associations between gambling severity and functional connectivity strength in any of the four networks, nor the basal ganglia network.
Association with gambling beliefs
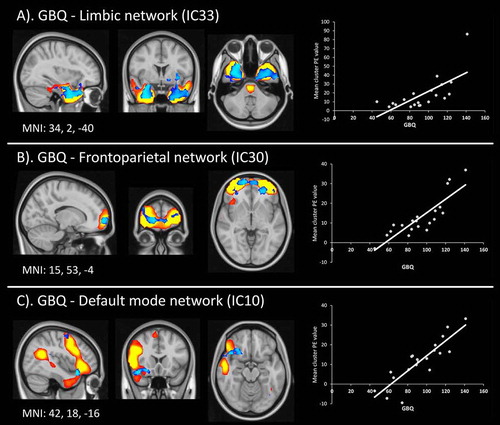
In GD patients, a significant positive association between gambling beliefs and functional connectivity strength was found in a number of networks and components (Figure ). In the limbic network (IC33), higher GBQ scores were positively related to increased activity in the right temporal lobe, extending towards the amygdala (peak at x, y, z: 34, 2, –40, p = 0.004, cluster size = 17 voxels; Figure A). Within the frontoparietal network (IC30), GBQ score was positively related to bilateral Brodmann area 10 (BA10) (one voxel at x, y, z: 15, 63, –4, p = 0.004; Figure B). Moreover, within the default mode network (IC10), gambling beliefs were positively related to a cluster encompassing the right insula and amygdala (peak at x, y, z: 42, 18, –16, p = 0.003, cluster size = 4 voxels; Figure C).
Figure 4. Number of gambling distortions covaries with resting-state networks. Spatial maps of the significant dual regression results are plotted over corresponding ICAs (see Figure for details). Results in blue show regions that covary with individual GBQ scores. For visualization purposes, these results are shown in blue, thresholded at p < 0.05 (uncorrected). Next to these results, scatter plots showing the mean functional connectivity value (PE = parameter estimate) extracted from the significant clusters (y-axis) are plotted against the GBQ scores for each individual gambling disordered patient.
Additional analyses without high-motion subjects
Because motion was significantly higher in the GD patients, we performed additional analyses on a subsample, excluding two high-motion (GD) subjects (mean FD > 0.55 mm). First, we investigated the relationship between motion and the ICs by computing the correlation between volume-to-volume motion (FD) and the time series outputs of stage 1 of the dual-regression. The distribution of the boxplots is centred around zero (Supplementary Figure 6), indicating that our initial analyses were relatively free of motion-related artifacts.
Additionally, we repeated the dual regression analyses without the two high-motion subjects. This rendered the results of both analyses non-significant at the initial Bonferroni-corrected threshold. However, the connectivity pattern between the two groups was similar to what was previously described, albeit at a lower threshold (Supplementary Figure 5). The reported whole-brain correlations with GBQ within the GD group disappeared after removal of those subjects. In sum, we interpret the whole-sample group difference as not being merely driven by the two high-motion subjects because (i) there was no systematic relationship between the level of motion and the selected ICs, and (ii) a similar but weaker connectivity pattern was observed after excluding two subjects, which may be due to the lower number of subjects leading to decreased power.
Discussion
The present study compared the functional architecture of five resting-state networks in GD patients with HCs. We found that, in GD patients, the bilateral insula is more strongly integrated into the ventral attention network, compared to HCs. No significant group differences were found in the other connectivity networks that we assessed. Within the GD patients, our results indicate positive relationships between the level of gambling distortions and how strongly (i) the right temporal lobe and amygdala were integrated into the limbic network; (ii) Brodmann area 10 (bilateral) was integrated into the frontoparietal control network and (iii) the right insula and amygdala were integrated into the default mode network. These findings indicate that increased insular connectivity in GD patients during (non-gambling-related) processing may be attentional, while (gambling-related) insular connectivity positively relates with gambling beliefs within the default mode network. Interestingly, any insular differences in GD do not appear to be related to frontoparietal control mechanisms.
Our finding of the right insula being more strongly integrated into the ventral attentional network in GD patients compared to HCs resonates with previous work highlighting a crucial role for the insula in GD. Previous resting-state studies in GD patients have reported increased connectivity of the insula with the right middle frontal gyrus (Koehler et al., Citation2013) and the amygdala (Contreras-Rodríguez et al., Citation2016). Task-based fMRI studies in GD patients also demonstrated increased connectivity of the left insula with the bilateral ventral striatum during a discounting task (Peters, Miedl, & Büchel, Citation2013) and increased activity in the insula during a cue reactivity task (i.e. watching gambling cues compared to neutral cues) which also correlated with between-subject craving scores (Limbrick-Oldfield et al., Citation2017). Because our resting-state block was preceded by a task containing gambling pictures, our results may partly reflect a sustained cue reactivity effect; previous work has shown that task execution preceding a resting-state scan can affect the functional structure of resting-state networks (Grigg & Grady, Citation2010). More generally, the insula is thought to play a critical role in several substance-related addictions and craving (Naqvi, Gaznick, Tranel, & Bechara, Citation2014), with insula damage disrupting nicotine addiction (Naqvi, Rudrauf, Damasio, & Bechara, Citation2007). Hence, the increased connectivity strength we observed in GD patients during rest is congruent with accumulating evidence for insula involvement in addiction-related states.
Gambling-related cognitive distortions are a key characteristic of GD, predicting gambling severity (Steenbergh et al., Citation2002) as well as duration of play and treatment outcome (Fortune & Goodie, Citation2012; Goodie & Fortune, Citation2013). Interestingly, a higher number of cognitive distortions about gambling was associated with increased involvement of different regions within a number of networks. Higher GBQ-scores were related to significantly increased involvement of the temporal lobe (extending towards the amygdala) in the limbic network; the bilateral medial prefrontal cortex (BA 10) in the frontoparietal control network; and the right insula (extending into the amygdala) in the default mode network. Although the involvement of these regions was found within different brain networks, all are directly anatomically connected: the anterior insula projects to the amygdala, which in turn receives from and projects to the bilateral medial prefrontal cortex (Flynn, Citation1999). These areas have been implicated in emotional awareness (Gu, Hof, Friston, & Fan, Citation2013) and incentive learning (Denny et al., Citation2014; Parkes & Balleine, Citation2013). There is some work directly linking increased insula activity and connectivity to gambling distortions. A typical cognitive distortion seen in gamblers is the near-miss effect, which occurs when an unsuccessful outcome is close to a win, resulting in increased motivation and the illusion of control (Clark, Citation2010). Amplified responses to near-misses have been observed in the bilateral anterior insula and striatum in GD patients (Clark, Lawrence, Astley-Jones, & Gray, Citation2009; Sescousse et al., Citation2016), while increased connectivity between the ventral striatum and insula during such events was related to gambling severity in regular gamblers (van Holst, Chase, & Clark, Citation2014). The positive relation we found between gambling distortions and connectivity strength within the insula is also in line with a lesion study showing that damage to the insula abolishes several cognitive distortions about gambling, including the near-miss effect (Clark, Studer, Bruss, Tranel, & Bechara, Citation2014).
Contrary to previous resting-state studies, we did not find evidence for abnormal striatal connectivity in GD compared to controls. This inconsistency may be a consequence of methodological differences. Whereas previous studies used seed-based analyses to directly test the connectivity from the striatum to other regions, we applied a data-driven ICA approach to test for differences in networks (some of which include the striatum; e.g. salience network, frontal-partietal control network and self-selected basal ganglia network). It could also be argued that using a preselected striatal seed is more sensitive to picking up abnormal striatal connectivity, while these abnormalities could remain sub-threshold when using data-driven ICA approaches. Moreover, task-based fMRI studies have consistently shown abnormal striatal functioning in GD. Perhaps striatal abnormalities are more pronounced in patients with GD when they are preforming specific tasks recruiting the striatum than during rest.
These results need to be considered in the context of some limitations. First, the reported sample size is relatively small, which renders replication of these results necessary. Second, the groups significantly differed in the level of motion. Motion-related artifacts are known to influence measures of functional connectivity, specifically of resting-state data (e.g. Power et al., Citation2012). Although benchmarking studies indicate that the denoising techniques deployed here, including the use of multi-echo imaging and ICA-AROMA, rank amongst the most successful (Ciric et al., Citation2017; Parkes, Fulcher, Yucel, & Fornito, Citation2018), it is impossible to completely rule out the impact of motion. Excluding two high-motion subjects in additional analyses rendered the effects non-significant. However, this could also be an issue of decreased power for the group comparison, as the increased insular connectivity within the ventral attentional was still observed at a lower (p < 0.1) threshold. Last, the number of smoking subjects in the GD group was significantly higher than in the HC group. The increased insula connectivity within the ventral attention network in the GD group could therefore also be driven by smoking status, which would correspond with the critical role of the insula in the addiction to smoking (Naqvi et al., Citation2007).
To our knowledge, this article is the first to investigate resting-state connectivity using an ICA approach in GD. Another strength of this study is that we used ICA-AROMA (Pruim, et al., Citation2015b) to remove motion-related artifacts from the individual resting-state data, which has been shown to increase reproducibility (Pruim et al., Citation2015a). Furthermore, we used an objective and easily reproducible method to select networks based on an independent template describing the cerebral cortex created from more than 1000 subjects. To further understand how abnormal resting-state connectivity relates to cognition and behaviour in GD, future studies would benefit from including neurocognitive assessments and testing for correlations between network integrity and neurocognitive functioning.
In conclusion, in this study we used a data-driven approach to investigate resting-state connectivity in GD patients. Compared to controls, GD patients showed increased functional connectivity strength within the right middle insula, which is part of the ventral attention network, and is suggested to play an important role in addiction-related drive. Moreover, our findings indicated that increased connectivity strength in networks encompassing the amygdala, medial prefrontal cortex and insula (areas implicated in emotional awareness and incentive learning) may underlie gambling-related cognitive distortions, which are a hallmark of GD.
Author contributions
T.v.T., R.J.v.H. and A.E.G. designed the study. T.v.T. acquired the data. T.v.T. and P.Z. carried out neuroimaging data processing and analyses. T.v.T. and R.J.v.H. prepared the manuscript. All authors read, corrected and approved the final manuscript.
Conflicts of interest
Funding sources
This work was supported by NWO-ZonMw grant VIDI [grant number 91713354] to AEG.
Competing interests
The authors declared no competing interests.
Constraints on publishing
There were no constraints on publishing.
Notes on contributors
Tim van Timmeren, MSc, is a PhD student since 2014 at the University of Amsterdam, Academic Medical Center (Amsterdam Institute for Addiction Research) under supervision of prof. Anna E Goudriaan and Ruth J van Holst. His research focus is on the neurobiological changes that accompany chronic alcohol- and gambling addiction, especially focusing on associative and reinforcement learning processes.
Paul Zhutovsky, MSc, is a PhD student since 2016 at the University of Amsterdam, Academic Medical Center under the supervision of professor Miranda Olff and Guido van Wingen. His research focus is on building machine learning models to predict treatment response of PTSD patients based on resting-state fMRI data. Before this position, Paul completed a master’s degree in computational neuroscience at the Institute of Technology and Humboldt university in Berlin.
Ruth J. van Holst, PhD, is senior postdoctoral fellow at the Academic Medical Center. By using a variety of neuroimaging techniques (fMRI/PET), brain-activity modulators (rTMS/pharmaca) and approaches (DSM/transdiagnostic) she aims to contribute to the understanding of the neural fundamentals of psychiatric disorders, especially of disorders in which people display faulty decision-making.
Anna E. Goudriaan, PhD, is a professor of working mechanisms and treatment in addiction at the University of Amsterdam, Academic Medical Center (Amsterdam Institute for Addiction Research) and head of the Addiction Research Program of Arkin Mental Health, including Jellinek Addiction Care Amsterdam, The Netherlands. She works as a clinical mental health psychologist in the field of addiction. Her research focuses on understanding mechanisms in behavioural addictions like gambling and substance use disorders, using neuroimaging and neurocognitive methods, in order to develop personalized interventions, and the study of efficacy of neuromodulation in addiction. A more recent focus is on the development of interventions for dually diagnosed patients.
Supplemental data
The supplementary material for this article is available online at https://doi.org/10.1080/14459795.2018.1449884
1449884_Supplementary_Material.zip
Download Zip (11 MB)References
- Andersson, J., Jenkinson, M., & Smith, S. (2007a). Non-linear optimisation. FMRIB technical report TR07JA1. University of Oxford FMRIB. Retrieved from https://www.fmrib.ox.ac.uk/datasets/techrep/tr07ja1/tr07ja1.pdf
- Andersson, J., Jenkinson, M., & Smith, S. (2007b). Non-linear registration, aka Spatial normalisation FMRIB technical report TR07JA2. FMRIB Analysis Group of. Retrieved from https://www.fmrib.ox.ac.uk/datasets/techrep/tr07ja2/tr07ja2.pdf
- Beckmann, C. F., & Smith, S. M. (2004). Probabilistic Independent Component Analysis for Functional Magnetic Resonance Imaging. IEEE Transactions on Medical Imaging, 23(2), 137–152. doi:10.1109/TMI.2003.822821
- Beckmann, C. F., DeLuca, M., Devlin, J. T., & Smith, S. M. (2005). Investigations into resting-state connectivity using independent component analysis. Philosophical Transactions of the Royal Society B: Biological Sciences, 360(1457), 1001–1013. doi:10.1098/rstb.2005.1634
- Beckmann, C. F., Mackay, C., Filippini, N., & Smith, S. (2009). Group comparison of resting-state FMRI data using multi-subject ICA and dual regression. Neuroimage. Retrieved from http://web.mit.edu/fsl_v5.0.8/fsl/doc/wiki/attachments/DualRegression/CB09.pdf
- Buckner, R. L., Andrews-Hanna, J. R., & Schacter, D. L. (2008). The brain’s default network: Anatomy, function, and relevance to disease. Annals of the New York Academy of Sciences, 1124, 1–38. doi:10.1196/annals.1440.011
- Ciric, R., Wolf, D. H., Power, J. D., Roalf, D. R., Baum, G. L., Ruparel, K., … Satterthwaite, T. D. (2017). Benchmarking of participant-level confound regression strategies for the control of motion artifact in studies of functional connectivity. NeuroImage, 154(March), 174–187. doi:10.1016/j.neuroimage.2017.03.020
- Clark, L. (2010). Decision-making during gambling: An integration of cognitive and psychobiological approaches. Philosophical Transactions of the Royal Society of London. Series B, Biological Sciences, 365(1538), 319–330. doi:10.1098/rstb.2009.0147
- Clark, L., Lawrence, A. J., Astley-Jones, F., & Gray, N. (2009). Gambling near-misses enhance motivation to gamble and recruit win-related brain circuitry. Neuron, 61(3), 481–490. doi:10.1016/j.neuron.2008.12.031
- Clark, L., Studer, B., Bruss, J., Tranel, D., & Bechara, A. (2014). Damage to insula abolishes cognitive distortions during simulated gambling. Proceedings of the National Academy of Sciences of the United States of America, 111, 6098–6103. doi:10.1073/pnas.1322295111
- Contreras-Rodríguez, O., Albein-Urios, N., Vilar-López, R., Perales, J. C., Martínez-Gonzalez, J. M., Fernández-Serrano, M. J., … Verdejo-García, A. (2016). Increased corticolimbic connectivity in cocaine dependence versus pathological gambling is associated with drug severity and emotion-related impulsivity. Addiction Biology, 21(3), 709–718. doi:10.1111/adb.12242
- Denny, B. T., Fan, J., Liu, X., Guerreri, S., Mayson, S. J., Rimsky, L., … Koenigsberg, H. W. (2014). Insula-amygdala functional connectivity is correlated with habituation to repeated negative images. Social Cognitive and Affective Neuroscience, 9(11), 1660–1667. doi:10.1093/scan/nst160
- Dosenbach, N. U. F., Fair, D. A., Miezin, F. M., Cohen, A. L., Wenger, K. K., Dosenbach, R. A. T., & Petersen, S. E. (2007). Distinct brain networks for adaptive and stable task control in humans. Proceedings of the National Academy of Sciences of the United States of America, 104(26), 11073–11078. doi:10.1073/pnas.0704320104
- Fauth-Bühler, M., Mann, K., & Potenza, M. N. (2017). Pathological gambling: A review of the neurobiological evidence relevant for its classification as an addictive disorder. Addiction Biology, 22(4), 885–897. doi:10.1111/adb.12378
- Ferris, J., & Wynne, H.(2001). The Canadian problem gambling index: Final report. Ottawa: Canadian Centre on Substance Abuse.
- Filippini, N., MacIntosh, B. J., Hough, M. G., Goodwin, G. M., Frisoni, G. B., Smith, S. M., … Mackay, C. E. (2009). Distinct patterns of brain activity in young carriers of the APOE- 4 allele. Proceedings of the National Academy of Sciences, 106(17), 7209–7214. doi:10.1073/pnas.0811879106
- Flynn, F. G. (1999). Anatomy of the insula functional and clinical correlates. Aphasiology, 13(1), 55–78. doi:10.1080/026870399402325
- Fortune, E. E., & Goodie, A. S. (2012). Cognitive distortions as a component and treatment focus of pathological gambling: A review. Psychology of Addictive Behaviors, 26(2), 298–310. doi:10.1037/a0026422
- Fox, M. D., & Raichle, M. E. (2007). Spontaneous fluctuations in brain activity observed with functional magnetic resonance imaging. Nature Reviews Neuroscience, 8(9), 700–711. doi:10.1038/nrn2201
- Goodie, A. S., & Fortune, E. E. (2013). Measuring cognitive distortions in pathological gambling: Review and meta-analyses. Psychol Addict Behav, 27(3), 730–743. doi:10.1037/a0031892
- Greicius, M. D., Krasnow, B., Reiss, A. L., & Menon, V. (2003). Functional connectivity in the resting brain: A network analysis of the default mode hypothesis. Proceedings of the National Academy of Sciences of the United States of America, 100(1), 253–258. doi:10.1073/pnas.0135058100
- Greve, D. N., & Fischl, B. (2009). Accurate and robust brain image alignment using boundary-based registration. NeuroImage, 48(1), 63–72. doi:10.1016/j.neuroimage.2009.06.060
- Grigg, O., & Grady, C. L. (2010). Task-related effects on the temporal and spatial dynamics of resting-state functional connectivity in the default network. PLoS ONE, 5(10), 1–12. doi:10.1371/journal.pone.0013311
- Gu, X., Hof, P. R., Friston, K. J., & Fan, J. (2013). Anterior insular cortex and emotional awareness. The Journal of Comparative Neurology, 521(15), 3371–3388. doi:10.1002/cne.23368
- Heatherton, T. F., Kozlowski, L. T., Frecker, R. C., & Fagerström, K. O. (1991). The Fagerström Test for Nicotine Dependence: A revision of the Fagerström Tolerance Questionnaire. British Journal of Addiction, 86(9), 1119–1127. doi:10.1111/j.1360-0443.1991.tb01879.x
- van Holst, R. J., van den Brink, W., Veltman, D. J., & Goudriaan, A. E. (2010). Why gamblers fail to win: A review of cognitive and neuroimaging findings in pathological gambling. Neuroscience and Biobehavioral Reviews, 34(1), 87–107. doi:10.1016/j.neubiorev.2009.07.007
- van Holst, R. J., Chase, H. W., & Clark, L. (2014). Striatal connectivity changes following gambling wins and near-misses: Associations with gambling severity. NeuroImage. Clinical, 5, 232–239. doi:10.1016/j.nicl.2014.06.008
- Jenkinson, M., & Smith, S. (2001). A global optimisation method for robust affine registration of brain images. Medical Image Analysis, 5(2), 143–156. doi:10.1016/S1361-8415(01)00036-6
- Jenkinson, M., Bannister, P., Brady, M., & Smith, S. (2002). Improved optimization for the robust and accurate linear registration and motion correction of brain images. NeuroImage, 17(2), 825–841. doi:10.1016/S1053-8119(02)91132-8
- Joel, S. E., Caffo, B. S., Van Zijl, P. C. M., & Pekar, J. J. (2011). On the relationship between seed-based and ICA-based measures of functional connectivity. Magnetic Resonance in Medicine, 66(3), 644–657. doi:10.1002/mrm.22818
- Jung, M. H., Kim, J.-H., Shin, Y.-C., Jung, W. H., Jang, J. H., Choi, J.-S., … Kwon, J. S. (2014). Decreased connectivity of the default mode network in pathological gambling: A resting state functional MRI study. Neuroscience Letters, 583C, 120–125. doi:10.1016/j.neulet.2014.09.025
- Koehler, S., Ovadia-Caro, S., Van Der Meer, E., Villringer, A., Heinz, A., Romanczuk-Seiferth, N., & Margulies, D. S. (2013). Increased functional connectivity between prefrontal cortex and reward system in pathological gambling. PLoS ONE, 8(12), 1–13. doi:10.1371/journal.pone.0084565
- Limbrick-Oldfield, E. H., Mick, I., Cocks, R. E., McGonigle, J., Sharman, S. P., Goldstone, A. P., … Clark, L. (2017). Neural substrates of cue reactivity and craving in gambling disorder. Translational Psychiatry, 7(1), e992–e992. doi:10.1038/tp.2016.256
- Minka, T. (2001). Automatic choice of dimensionality for PCA. Advances in Neural Information Processing Systems. Retrieved from http://papers.nips.cc/paper/1853-automatic-choice-of-dimensionality-for-pca.pdf
- Murphy, K., & Fox, M. D. (2017). Towards a consensus regarding global signal regression for resting state functional connectivity MRI. NeuroImage, 154(November 2016), 169–173. https://doi.org/10.1016/j.neuroimage.2016.11.05210.1016/j.neuroimage.2016.11.052
- Naqvi, N. H., Rudrauf, D., Damasio, H., & Bechara, A. (2007). Damage to the Insula Disrupts Addiction to Cigarette Smoking. Science (New York, N.Y.), (January), 531–534.10.1126/science.1135926
- Naqvi, N. H., Gaznick, N., Tranel, D., & Bechara, A. (2014). The insula: A critical neural substrate for craving and drug seeking under conflict and risk. Annals of the New York Academy of Sciences, 1316(1), 53–70. doi:10.1111/nyas.12415
- Nichols, T. E., & Holmes, A. P. (2001). Nonparametric Permutation Tests for functional Neuroimaging Experiments: A Primer with examples. Human Brain Mapping, 15(1), 1–25. doi:10.1002/hbm.1058
- Nickerson, L. D., Smith, S. M., Öngür, D., & Beckmann, C. F. (2017). Using dual regression to investigate network shape and amplitude in functional connectivity analyses. Frontiers in Neuroscience, 11(MAR), 1–18. doi:10.3389/fnins.2017.00115
- Parkes, S. L., & Balleine, B. W. (2013). Incentive memory: Evidence the basolateral amygdala encodes and the insular cortex retrieves outcome values to guide choice between goal-directed actions. The Journal of Neuroscience : The Official Journal of the Society for Neuroscience, 33(20), 8753–8763. doi:10.1523/JNEUROSCI.5071-12.2013
- Parkes, L., Fulcher, B., Yücel, M., & Fornito, A. (2018). An evaluation of the efficacy, reliability, and sensitivity of motion correction strategies for resting-state functional MRI. NeuroImage, 171, 415–436. doi:10.1016/j.neuroimage.2017.12.073
- Peters, J., Miedl, S. F., & Büchel, C. (2013). Elevated functional connectivity in a striatal-amygdala circuit in pathological gamblers. PloS One, 8(9), e74353. doi:10.1371/journal.pone.0074353
- Poser, B. A., Versluis, M. J., Hoogduin, J. M., & Norris, D. G. (2006). BOLD contrast sensitivity enhancement and artifact reduction with multiecho EPI: Parallel-acquired inhomogeneity-desensitized fMRI. Magnetic Resonance in Medicine, 55(6), 1227–1235. doi:10.1002/mrm.20900
- Power, J. D., Barnes, K. A., Snyder, A. Z., Schlaggar, B. L., & Petersen, S. E. (2012). Spurious but systematic correlations in functional connectivity MRI networks arise from subject motion. NeuroImage, 59(3), 2142–2154. doi:10.1016/j.neuroimage.2011.10.018
- Power, J. D., Plitt, M., Kundu, P., Bandettini, P. A., & Martin, A. (2017). Temporal interpolation alters motion in fMRI scans: Magnitudes and consequences for artifact detection. Plos One, 12(9), e0182939. doi:10.1371/journal.pone.0182939
- Power, J. D., Plitt, M., Laumann, T. O., & Martin, A. (2017). Sources and implications of whole-brain fMRI signals in humans. NeuroImage, 146(May), 609–625. doi:10.1016/j.neuroimage.2016.09.038
- Pruim, R. H. R., Mennes, M., Buitelaar, J. K., & Beckmann, C. F. (2015a). Evaluation of ICA-AROMA and alternative strategies for motion artifact removal in resting state fMRI. NeuroImage, 112, 278–287. doi:10.1016/j.neuroimage.2015.02.063
- Pruim, R. H. R., Mennes, M., van Rooij, D., Llera, A., Buitelaar, J. K., & Beckmann, C. F. (2015b). ICA-AROMA: A robust ICA-based strategy for removing motion artifacts from fMRI data. NeuroImage, 112, 267–277. doi:10.1016/j.neuroimage.2015.02.064
- Reineberg, A. E., Andrews-Hanna, J. R., Depue, B. E., Friedman, N. P., & Banich, M. T. (2015). Resting-state networks predict individual differences in common and specific aspects of executive function. NeuroImage, 104, 69–78. doi:10.1016/j.neuroimage.2014.09.045
- Satterthwaite, T. D., Elliott, M. A., Gerraty, R. T., Ruparel, K., Loughead, J., Calkins, M. E., … Wolf, D. H. (2013). An improved framework for confound regression and filtering for control of motion artifact in the preprocessing of resting-state functional connectivity data. NeuroImage, 64(1), 240–256. doi:10.1016/j.neuroimage.2012.08.052
- Saunders, J. B., Aasland, O. G., Babor, T. F., de la Fuente, J. R., & Grant, M. (1993). Development of the alcohol use disorders identification test (AUDIT): WHO collaborative project on early detection of persons with harmful alcohol consumption–II. Addiction (Abingdon, England), 88(6), 791–804. Retrieved from http://www.fpl.fs.fed.us/documnts/pdf2002/cowan02a.pdf10.1111/add.1993.88.issue-6
- Seeley, W. W., Menon, V., Schatzberg, A. F., Keller, J., Glover, G. H., Kenna, H., … Greicius, M. D. (2007). Dissociable intrinsic connectivity networks for salience processing and executive control. J Neurosci, 27(9), 2349–2356. doi:10.1523/JNEUROSCI.5587-06.2007
- Sescousse, G., Janssen, L. K., Hashemi, M. M., Timmer, M. H. M., Geurts, D. E. M., ter Huurne, N. P., … Cools, R. (2016). Amplified striatal responses to near-miss outcomes in pathological gamblers. Neuropsychopharmacology, 41(10), 2614–2623, doi:10.1038/npp.2016.43
- Sheehan, D., Lecrubier, Y., & Sheehan, K. (1998). Diagnostic psychiatric interview for DSM-IV and ICD-10. J Clin Psychiatry, 59, 22–33. Retrieved from https://www.researchgate.net/profile/David_Sheehan2/publication/13406551_The_Mini-International_Neuropsychiatric_Interview_MINI_The_development_and_validation_of_a_structured_diagnostic_psychiatric_interview_for_DSM-IV_and_ICD-10/links/02bfe50d063159c19e0
- Smith, S. (2002). Fast robust automated brain extraction. Human Brain Mapping. Retrieved from http://onlinelibrary.wiley.com/doi/10.1002/hbm.10062/full
- Steenbergh, T. A., Meyers, A. W., May, R. K., & Whelan, J. P. (2002). Development and validation of the Gamblers’ Beliefs Questionnaire. Psychology of Addictive Behaviors : Journal of the Society of Psychologists in Addictive Behaviors, 16(2), 143–149. Retrieved from http://www.ncbi.nlm.nih.gov/pubmed/1207925310.1037/0893-164X.16.2.143
- van Timmeren, T., Daams, J. G., van Holst, R. J., & Goudriaan, A. E. (2018). Compulsivity-related neurocognitive performance deficits in gambling disorder: A systematic review and meta-analysis. Neuroscience & Biobehavioral Reviews, 84, 204–217. doi:10.1016/j.neubiorev.2017.11.022
- Tschernegg, M., Crone, J. S., Eigenberger, T., Schwartenbeck, P., Fauth-Bühler, M., Lemènager, T., … Kronbichler, M. (2013). Abnormalities of functional brain networks in pathological gambling: A graph-theoretical approach. Frontiers in Human Neuroscience, 7(September), 1–10. doi:10.3389/fnhum.2013.00625
- Vincent, J. L., Kahn, I., Snyder, A. Z., Raichle, M. E., & Buckner, R. L. (2008). Evidence for a frontoparietal control system revealed by intrinsic functional connectivity. Journal of Neurophysiology, 100(6), 3328–3342. doi:10.1152/jn.90355.2008
- Yeo, B. T. T., Krienen, F. M., Sepulcre, J., Sabuncu, M. R., Lashkari, D., Hollinshead, M., … Buckner, R. L. (2011). The organization of the human cerebral cortex estimated by intrinsic functional connectivity. Journal of Neurophysiology, 106, 1125–1165. doi:10.1152/jn.00338.2011
- Zhang, Y., Brady, M., & Smith, S. (2001). Segmentation of brain MR images through a hidden Markov random field model and the expectation-maximization algorithm. IEEE Transactions on Medical Imaging, 20(1), 45–57. doi:10.1109/42.906424