
 ?Mathematical formulae have been encoded as MathML and are displayed in this HTML version using MathJax in order to improve their display. Uncheck the box to turn MathJax off. This feature requires Javascript. Click on a formula to zoom.
ABSTRACT
Report cards are increasingly popular tools communicating the condition of coastal and riverine environments to environmental managers, stakeholders and the public, and synthesising complex data drawn from a range of indicators. Mud crabs have not previously been included in ecosystem health report cards in Australia or elsewhere but have been suggested as environmental indicators for tropical coastal marine environments in Australia. Mud crabs support commercial, recreational and Indigenous fisheries and their biology is relatively well known. For these reasons and due to their local relevance, mud crabs (Scylla serrata) were selected for long-term monitoring and inclusion in a report card for Gladstone Harbour, Australia. Three mud crab measures were identified to reflect the variety of pressures across Gladstone Harbour: abundance, prevalence of rust lesions and sex ratio. A standardised field monitoring program was developed to allow for ongoing scoring and reporting of the multi-metric indicator. An indicator scoring (distance from benchmark) and grading methodology was applied to the indicator and refined over the two years of monitoring. This article provides a novel framework for monitoring and scoring mud crabs for management purposes or for use in report cards, and outlines the process of developing an indicator for an iconic crustacean species.
Introduction
Australia’s coasts and estuaries provide critical ecosystem services, yet are under increasing pressure from pollution, habitat loss, overfishing and reduced freshwater flows (Hallett, Valensini, and Elliott Citation2016). In Queensland, coastal development, climate change, poor water quality and direct uses such as fishing have been recognised as key threats to the Great Barrier Reef (GBR) region (GBRMPA Citation2019). Coastal waters in the GBR region are subject to contamination from runoff from agricultural lands, stormwater from urban areas and industrial emissions; and some toxicants are reported in higher concentrations near marinas and ports (Negri et al. Citation2009).
Effective integration, interpretation and communication of monitoring data to stakeholders are common criteria for successful environmental assessments (Dennison et al. Citation2007). Monitoring and reporting of estuarine condition is essential to help ensure that these valuable ecosystems and the populations they support are managed sustainably (Hallett, Valensini, and Elliott Citation2016). An important aspect of monitoring programs is that the outputs are reported in a way that renders them understandable to stakeholders, managers and the community (Hallett, Valensini, and Elliott Citation2016).
Report cards scoring the condition of rivers, estuaries and coastal ecosystems are emerging as popular management tools, synthesising complex environmental data to publicly communicate relative performance and environmental services (Dennison et al. Citation2007; Pascoe et al. Citation2016; McIntosh et al. Citation2019; Logan et al. Citation2020). In the last decade, a range of new report cards have been established for freshwater and marine ecosystems in Queensland, Australia (e.g. Bunn et al. Citation2010; Flint et al. Citation2017; McIntosh et al. Citation2019). Report cards can take a whole-of-system approach to monitoring, as is the case for the Gladstone Harbour Report Card, an annual report produced by the Gladstone Healthy Harbour Partnership (GHHP), which brings together various stakeholders from government, industry, research and community organisations (McIntosh et al. Citation2019). GHHP collects social, cultural, economic and environmental data and reports overall grades for each of these four components. The Report Card’s environmental component is composed of a range of indicators including water quality, sediment quality, seagrass, coral and fish recruitment (GHHP Citation2016). Given the potential of the iconic giant mud crab (Scylla serrata) as a useful environmental indicator of a range of stressors including recreational and commercial fishing and environmental condition, and their recognised importance to the local community, the GHHP Independent Science Panel proposed the addition of a mud crab indicator to the environmental component of the Report Card (GHHP Citation2016).
Here, we refer to the broad OECD definition of an environmental indicator, as ‘ … a parameter, or a value derived from parameters, that points to, provides information about and/or describes the state of the environment, and has a significance extending beyond that directly associated with any given parametric value. The term may encompass indicators of environmental pressures, conditions and responses’ (OECD Citation2001). In this respect, environmental indicators used in report cards do not necessarily need to reflect only a single, individual environmental pressure. This is often particularly so for biological indicators, as animals are exposed to the cumulative effects of a range of pressures and conditions in their environment, which can be reflected through a range of biological responses. The addition of the mud crab indicator to the Gladstone Harbour Report Card may not only provide an additional measure of harbour health, but would also represent an iconic species relevant to the target audience of the report card.
Mud crabs (Scylla spp.) are key fisheries products in Africa, Asia, Australia and the South Pacific (Mirera Citation2011; FAO Citation2017; Sen and Homechaudhuri Citation2017). Scylla serrata is a recreationally and commercially important decapod crustacean species in Queensland, Australia (DAF Citation2017) as well as an iconic seafood item with cultural value to Indigenous Australian peoples (Brewster Citation2015). As a result of their commercial importance to fishing and aquaculture industries, the biology of mud crabs is relatively well known in comparison to many other tropical Australian decapods, and mud crabs have previously been suggested as a potentially useful environmental indicator for tropical coastal marine environments in Australia (Negri et al. Citation2009; van Oosterom et al. Citation2010). A variety of indicator types have previously been identified as relevant for application to decapod crustaceans, including: biomarkers (van Oosterom et al. Citation2010); bioaccumulation of toxicants (McPherson and Brown Citation2001); sex ratios (Alberts-Hubatsch et al. Citation2016); nursery grounds / recruitment (Giblock and Crain Citation2013); abundance (Walton et al. Citation2007); biomass (CitationIkhwanuddin et al. 2011); morphometrics (Giblock and Crain Citation2013); and prevalence of disease (Jithendran et al. Citation2010). With the exception of female spawning migrations reported in some areas, mud crabs exhibit a relatively small range in comparison to transient finfish species (Hyland, Hill, and Lee Citation1984; Meynecke and Richards Citation2014; Alberts-Hubatsch et al. Citation2016). This trait allows for more localised monitoring, and as benthic feeders, mud crabs are potentially exposed to contaminants in sediments, pore waters and through dietary uptake (van Oosterom et al. Citation2010). Mud crabs are also able to be captured using baited pots, deployed and retrieved over specified periods, a practical advantage for standardised monitoring.
Local pressures on mud crabs in Gladstone Harbour potentially include recreational and commercial fishing, coastal development affecting mangrove and estuary habitat quality, water quality and local weather changes associated with global climate change. Community concerns about the prevalence of fish and mud crab diseases in Gladstone Harbour that occurred in 2011 and 2012 (Wesche et al. Citation2013; Dennis et al. Citation2016) meant the prevalence of locally relevant disease was also an important consideration for this report card. A condition known as rust shell lesions has previously been recorded in Gladstone Harbour, including following the flood event (Andersen and Norton Citation2001; Dennis et al. Citation2016).
Mud crabs have not previously been used as an indicator in any ecosystem health report card in Australia or elsewhere. The aim of this research was to design a long-term standardised monitoring program for adult mud crabs (S. serrata) through a case study in Gladstone Harbour, Australia. We investigated suitable measures, and developed and field-tested a multi-metric mud crab indicator, baselines and scoring system suitable for report cards.
Materials and methods
Study area
Gladstone Harbour (23° 49.125′ S, 151° 15.165′ E) is a natural deepwater harbour containing a major multi-commodity export terminal in Queensland, Australia. The Port of Gladstone includes one of the largest coal export facilities in Australia and the fourth largest in the world (DTMR Citation2015). Major industries depending on the port are located either on the shores of the harbour or in the adjacent coastal area, including liquefied natural gas processing plants, alumina refineries, an aluminium smelter, an ammonium nitrate plant, a cement plant and Queensland’s largest coal fired power station (). The harbour supports diverse marine and coastal habitats including coral reef, seagrass, mangrove, saltmarsh, salt pan, sand dune, oyster and rocky reef (Flint et al. Citation2015). As well as being situated within the GBR World Heritage Area (UNESCO Citation2016), Gladstone Harbour incorporates a Dugong Protection Area (GBRMPA Citation2016) and three Fish Habitat Areas (Queensland Fisheries (General) Regulation 2019), reflecting the high ecological and fisheries values of this region.
Figure 1. Map of the Gladstone Harbour zones showing the seven zones recommended for long-term mud crab monitoring (‘sampled’) and areas of urban and industrial land cover.
Major industries include: (1) aluminium refineries, (2) aluminium smelter, (3) cement plant, (4) limestone and clay mines, (5) liquified natural gas plants, (6) coal fired power station, (7) ammonium nitrate, nitric acid, polystyrene and sodium cyanide plant.
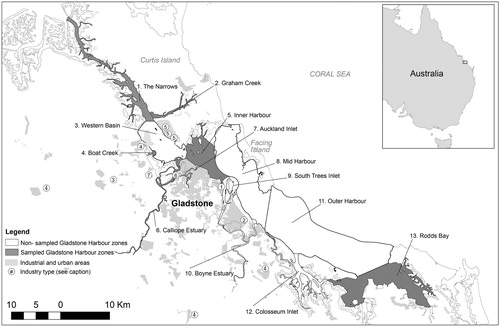
The harbour is a macro-tidal estuarine system with a seasonal wet summer, dry winter climate regime. The system includes an intricate network of rivers, creeks, inlets, shoals, mud banks, channels and islands. Due to these physical features, complex water circulation patterns occur throughout the harbour and are primarily governed by a large barotropic tidal flow, which contributes to high natural sediment loads (Herzfeld et al. Citation2004). The mean spring tidal range is 3.2 m and 1.5 m during neap tides. The region includes a diversity of marine and coastal habitats including muddy intertidal flats, approximately 30 per cent of which are dominated by mangroves (Connolly et al. Citation2006), which provide important mud crab habitat.
Selection of sampling sites
Mud crab sampling sites in Gladstone Harbour were considered through an assessment of historical sampling locations (Andersen and Norton Citation2001; Andersen, Revill, and Storey Citation2005; Jebreen et al. Citation2008; Dennis et al. Citation2016), local knowledge of mud crab populations, habitat type (favouring deep-channel mangrove creeks with muddy substrates – the ideal habitat for adult mud crabs), and proximity to current report card monitoring sites. An assessment of accessibility was made during a reconnaissance of potential sites conducted on 5–6 June 2017. Sites were also selected to adequately represent the different environmental reporting zones delineated by GHHP (). Nine sites in eight zones were sampled in June and July 2017. Following this initial sampling, site selection criteria were applied to each zone/site to score, rank and recommend GHHP long term monitoring sites.
The criteria ultimately used for site selection included: (1) the site is currently accessible considering tidal and weather restrictions and vessel travel time; (2) the site is likely to remain accessible through time; (3) the site is described as a deep-channel mangrove creek with a muddy substrate; (4) mud crabs were caught at the site during monitoring in the pilot year of 2017; (5) the site is close to other GHHP monitoring sites for environmental indicators; and (6) the site has previously been utilised for mud crab monitoring and research programs. Each site was given a score for each selection criterion based on author rankings, six sites were ranked as highly suitable () and seven sites were identified for long-term mud crab monitoring in Gladstone Harbour (). The seventh site (which ranked only as moderately suitable) was Rodds Bay; it was added to the long-term monitoring sites because it is used a reference site for local water quality monitoring programs (Flint et al. Citation2015) and fulfilled most of the other selection criteria.
Table 1. Assessment of potential sites against long-term monitoring site selection criteria.
Selection of measures
A literature review was undertaken to assemble a list of potential measures suitable for a mud crab monitoring program. These included biomarkers of contamination, bioaccumulation of toxicants, sex ratio of adult crabs, abundance (catch per unit effort of mature and near-mature crabs), nursery value (catch per unit effort of juvenile crabs in nursery habitats), prevalence of rust lesions, prevalence of other diseases and parasites, the relationship between carapace width and body weight of adult crabs, and morphometrics (such as claw size ratio) (Supplementary material, Table A1). These potential measures were reviewed, compared and scored against a set of ten predefined selection criteria () that were modified from criteria used in other relevant studies (Rainbow Citation1995; Cooper, Gilmour, and Fabricius Citation2009; Flint et al. Citation2017). The scoring process was undertaken through four stages. (1) Three project team members independently scored the indicators against the ten selection criteria. (2) Two different project team members checked the three sets of independent scores and highlighted any discrepancies. (3) For indicators that were scored similarly (<5 points difference between any two scores) a total score was calculated as the average of the three independent scores. (4) Indicators that were scored differently (>5 points difference between any two scores) were workshopped by all team members, and a consensus score reached based on shared understanding. At the conclusion of this process, the measures with the highest scores were identified as having the greatest potential for implementation in a long-term mud crab monitoring program in Gladstone Harbour. The measures selected for piloting and development were abundance (catch per unit effort – CPUE), prevalence of rust lesions, and sex ratio.
Table 2. Indicator selection criteria used in the scoring process.
Abundance of mud crabs (CPUE) scored 25/30 during the indicator scoring process. It was included in the multi-metric indicator for the report card as it is an easily understood indicator of community interest, and because changes in abundance of mud crabs through time and between sampling sites can be important indicators of the health of the species and its environment (Dumas et al. Citation2012; Meynecke et al. Citation2012; Alberts-Hubatsch et al. Citation2016).
Prevalence of rust lesions scored 24/30 during the indicator scoring process. It is a locally relevant indicator, referring to a mud crab disease that has previously been recorded at high prevalence in the harbour (Dennis et al. Citation2016). The disease was first noted in Gladstone Harbour in 1994 and while the cause has not been confirmed, it is thought to be environmentally induced (Andersen and Norton Citation2001).
Sex ratio scored 26.5/30 during the indicator scoring process. It is most relevant in jurisdictions such as Queensland where fisheries exist, and fishing pressure can change the ratio of males to females in adult populations. The fishery is limited to males over 150 mm carapace width (the distance between the widest bilateral spines), and fished populations are now female dominated above this size (Pillans et al. Citation2005; Alberts-Hubatsch et al. Citation2016).
Several indicators were noted as potentially useful in future, but would require further research or long-term data collection to develop an appropriate scoring system. These included the ratio of body size to weight (score 25.3/30), bioaccumulation of toxicants in crab tissues (score 21.3/30) and nursery value (score 18/30). The full scoring table is provided as Supplementary Material (Table A1).
Development of a mud crab monitoring program
Dates of sampling in the 2017 pilot year and the first full year of sampling in 2018, as well as water temperature and salinity, are provided in .
Table 3. Zones of Gladstone Harbour sampled for the mud crab indicator, and water temperature and salinity as measured on the morning of each sampling date.
During all sampling events, surveys were conducted on dates when low tide was between 10:00 am and 3:00 pm. This allowed field work to be conducted during the day and minimised any possible variations in catch resulting from diel patterns in mud crab feeding behaviour and catchability. At each site and sampling event, 20 heavy duty four-entry round collapsible crab pots (dimensions 900 mm D × 320 mm H) were set a minimum of 100 m apart. The exception to this was Boat Creek, as fewer pots could be deployed in this smaller creek system whilst maintaining a 100 m distance between them. Crab pots were set at least three hours before the low tide and collected at least two hours after the low tide, resulting in soak times of at least five hours per pot. Pots were placed so that they would still be submerged at low tide (preventing exposure and minimising chance of mortality of any fish caught in the pots) but as close as possible to mangrove habitats. At each site, physicochemical parameters (temperature, dissolved oxygen, conductivity, pH, turbidity, total dissolved solids and salinity) were measured at deployment depth when the first pot was deployed and again when the last pot was retrieved.
Each pot was baited with one large sea mullet (Mugil cephalus) head and a float was attached with a 10 m rope. The opening of each pot was secured with a colour-coded cable tie, so that if crabs were removed by others this could be detected and recorded on retrieval (we did not identify any signs of crabs being removed from the sampling pots). At each sampling site, the following information was recorded: zone and site name, GPS location, date, set time and retrieval time for each uniquely identified pot, total number of animals of each species caught in every pot, and the sex of all mud crabs caught. For each mud crab caught at each site, the following information was recorded: species, sex, carapace width (mm), weight (g) and abnormalities. Data were collected on any external abnormalities including missing limbs, shell deformities, barnacles and rust shell lesions. The following information on abnormalities was collected from each ‘checked’ crab: type of abnormality, body location, dimensions and grade of rust spot lesions (Andersen Citation2003, see also Supplementary material Table A2). Only data on the prevalence of rust shell lesions was later analysed. During the pilot sampling event in 2017, only the first 40 mud crabs caught at each site were checked thoroughly, others were counted, sexed and released. In 2018, all mud crabs captured were checked thoroughly.
It is illegal in Queensland for commercial or recreational fishers to retain male mud crabs that are less than 150 mm carapace width (distance between the widest bilateral spines) or female mud crabs of any size. As spines can sometimes be damaged on large mud crabs, a more precise measurement of carapace width (for research purposes) can be achieved by measuring the width of the carapace across the notches directly behind the widest spines. The legal size limit of 150 mm spine width corresponds to ∼143 mm notch width (unpublished data, Fisheries Queensland).
Data analysis and index value calculation
All analyses were conducted in R version 3.3.0 (R Core Team, Citation2016) using the R packages ‘plyr' and ‘ggplot2’ (Wickham, Citation2009; Wickham, Citation2011). Historical data from Gladstone Harbour were provided by Fisheries Queensland from the Long Term Monitoring Program (LTMP) for the Queensland Mud Crab Fishery. These data were analysed for comparison with 2017 results and to aid in developing baselines for the indicator during the pilot year. The LTMP dataset from Gladstone Harbour included carapace width (notch width and spine width) and sex of mud crabs caught at six sampling sites from 2001 to 2009, primarily during the summer months (December to February).
For each of the three selected measures, index values were calculated for each zone, as follows:
Abundance (CPUE) in each zone
(1)
Prevalence of rust lesions in each zone
Sex ratio based on legally retainable male crabs (over 143 mm notch width)
Calculating scores and grades
Abundance
Abundance (as CPUE) was calculated from the 2017 data as well as from the LTMP data collected between 2000 and 2009 at six locations in and near Gladstone Harbour. The 75th percentile, median and mean values of both the 2017 data and LTMP were considered as possible benchmarks. As LTMP data were collected in summer using a different (overnight) soak time and smaller custom-made crab pots, CPUE from this program was not directly comparable to the 2017 results. For this reason, 2017 data were initially used to select the benchmark for the abundance measure. As a benchmark should represent reference condition, but also allow for natural biological variations, a moving average of the 75th percentile of scores approach was applied, noting that for 2017, this was the 75th percentile of only one year’s scores (a value of 3.5 in 2017). In 2018, the 75th percentile of two years’ scores were averaged (a value of 2.5). In future years this benchmark will always move in line with the updated average, to eventually become a 10-year moving average ().
Table 4. Benchmarks and scoring method for each of the recommended measures for the mud crab indicator.
The WCS should represent a population in poor condition. While the minimum and 25th percentile values of a range of samples are possible WCS values that were considered, the minimum and 25th percentile values for 2017 data and the LTMP data were all 0, which if used as a WCS would indicate no mud crabs could be caught, regardless of the number of pots set. As an alternative to this ‘no catch’ value, a catch rate of 0.25 was chosen (). The selected WCS value of 0.25 is, in effect, a social WCS based on assumed fisher preferences. In Queensland, the maximum number of pots that can be set at one time by a recreational crabber is four (The State of Queensland Citation2018) and we assume that a catch of less than one mud crab of any size/sex from this four-pot limit would be undesirable for recreational fishers. An alternative approach would be to apply commercial fisher preferences. Knuckey (Citation1999) suggested crabbers in the Northern Territory cease crabbing when the saleable catch is <0.1 kg/pot.day, which in Queensland equates to about one oversized male crab in every 8–9 pots. The difficulty with using this value as a benchmark of overall abundance is that it is necessarily linked to the abundance of oversized male crabs, which would be highly correlated to the sex ratio measure and becomes a measure of potential harvest rather than overall population.
Prevalence of rust lesions
Prevalence of rust lesions was calculated from the 2017 data and is reported in previous literature from Gladstone Harbour (Andersen, Norton, and Levy Citation2000; Andersen Citation2003; Dennis et al. Citation2016). A background level of 5% prevalence has been previously reported for other portunid crab populations and is a possible benchmark value, but the 25th percentile of 2017 data was slightly less than this, at 4% of crabs sampled. A precautionary approach was taken in selecting a benchmark of the lower value of 4% (0.04) (). Possible WCS values considered include the maximum prevalence of lesions in 2017 (15.4%) and values extracted from the literature: 14.3% mean prevalence in Gladstone Harbour reported by Andersen (Citation2003); 21.7% prevalence in Gladstone Harbour reported by Andersen, Norton, and Levy (Citation2000); and 37% mean prevalence in Gladstone Harbour reported by Dennis et al. (Citation2016). As the study by Dennis et al. (Citation2016) was conducted during a period of unusually high prevalence of fish and mud crab disease the prevalence of rust lesions reported by that study can be considered representative of a population in poor condition. The selected WCS was based on the prevalence recorded by Dennis et al. (Citation2016), rounded down to a slightly more conservative value of 35% (0.35) ().
Sex ratio
Sex ratio of legal-size mud crabs (>143 mm notch width) was calculated from the 2017 data and from LTMP data. The 75th percentile of either of these samples were considered as possible benchmarks. However, all the data collected in Gladstone were from fished populations of mud crabs. Because of the strong influence of the fishery on sex ratios of mud crab populations, a reference benchmark would require sampling from a population of mud crabs with no harvesting pressure. In the pilot year (2017) the benchmark was based on a study from Micronesia, where male mud crabs were found to be up to three times as prevalent as female mud crabs (Bonine et al. Citation2008) and a study from South East Queensland which reported mature male mud crabs were twice as prevalent as mature females (Pillans et al. Citation2005). The more conservative ratio of 3:1 (Bonine et al. Citation2008) was chosen as the temporary benchmark for sex ratio in the pilot year. In 2018, this benchmark was revised to 2:1 with the consideration of previously unobtained research from northern New South Wales, Australia, which recorded a sex ratio of two males to one female (Butcher Citation2004) aligning with the results from South East Queensland (Pillans et al. Citation2005) (). A range of possible values for the WCS were calculated from 2017 and LTMP data (from fished/disturbed populations), including 25th percentile, median and mean. As the LTMP data included a longer time series with more data points, the 25th percentile of that dataset was suggested as the WCS (0.25) ().
Each of the three mud crab measures were then scored using the formula:
(4)
(4) where x = recorded index value; B = benchmark; W = worst case scenario (WCS)
Using this method, index values worse than the WCS scored a 0, while index values better than the benchmark scored a 1 and all other index values ranged between these bounds. A similar approach is taken for environmental indicators in the South East Queensland Report Card (Bunn et al. Citation2010) and the Fitzroy Basin Report Card (Flint et al. Citation2017).
A combined score for the overall Mud Crab Indicator was calculated as the average of the three individual measure scores and an overall grade was provided for each zone and for the Harbour. The existing Gladstone Harbour Report Card grading system was applied to convert scores to grades, as follows: Scores ≥0.85 received a grade of ‘A’; scores ≥0.65 to <0.85 received a ‘B’; scores between ≥0. 5 to <0.65 received a ‘C’; scores between ≥0.25 to <0.5 received a ‘D’; and scores between 0 to <0.25 received an ‘E’ (GHHP Citation2016). This approach allows the mud crab indicator results to be compared with other indicators in the report card.
Results
Mud crab monitoring results in 2017 and 2018
In 2017, a total of 292 mud crabs (S. serrata) were caught at the seven selected monitoring zones and sex recorded. Of these, 192 mud crabs (113 male and 79 female) were measured (carapace notch width, mm), weighed (g) and checked for rust lesions or other abnormalities, the remainder were in excess of the maximum of 40 per zone that were checked during the pilot year. Tested physicochemical water quality parameters were within relevant water quality guidelines (Supplementary material, Tables A3 and A4). In February 2018 (summer / wet season), a total of 175 mud crabs were caught at the seven selected monitoring sites (62 male and 111 female), while in June 2018 (winter / dry season), a total of 163 mud crabs were caught (67 males and 95 females). All mud crabs caught during 2018 were measured (carapace notch width, mm), weighed (g) and checked for rust lesions or other abnormalities. Tested physicochemical water quality parameters were mostly within relevant water quality guidelines although dissolved oxygen concentration was moderately low in some monitoring zones in February 2018 (Supplementary material, Table A4).
Mud crabs caught at the seven monitoring zones in 2017 had a mean notch width of 154.93 mm (SD: 17.38) (Supplementary material, Table A5, Figure A1). The mean carapace notch width of mud crabs caught was 142.53 mm (SD: 20.79) in February 2018 and 150.37 (SD: 19.39) in June 2018. Data from the LTMP provided by Fisheries Queensland were analysed for comparison with the pilot year. Between 2001 and 2009, 1934 mud crabs were caught across six locations in Gladstone Harbour and the northern creeks of the Narrows. Of these, 728 were males, 1204 were females and two were unrecorded. The mean size of mud crabs caught in the LTMP was 145.45 mm. Mean female size was higher than mean male size in all sampling periods (Supplementary material, Table A5).
Total catch was generally higher in June/July 2017 than in February or June 2018, except for Calliope Estuary and Rodds Bay (Supplementary Material, Table A6). Rust lesions were relatively uncommon across all sampling events and did not approach the WCS of 35%. The percentage of mud crabs that presented with rust lesions at the seven monitoring zones in 2017 varied from 2.4% at Boat Creek, to 15.4% at Auckland Inlet. In February 2018, the percentage of crabs with rust lesions ranged from zero in five zones to 4.29% in the Narrows, while in June 2018 the percentage ranged from zero in four zones to 11.76% in Rodds Bay. In 2017, the ratio of oversized male to female mud crabs caught varied between zones from 0.11:1 at Auckland Inlet to 2.2:1 at Inner Harbour. In February 2018, the ratio ranged from 0.07:1 at the Narrows to 1:1 at Rodds Bay, and in June 2018 the ratio was lowest at Auckland Inlet (0:1; but only one oversized female was caught) and highest at Boat Creek (0.75:1).
Scoring, grading and aggregation
Index values calculated for each zone are provided in . In the pilot year of 2017, Abundance (CPUE, calculated as number of mud crabs caught divided by number of pots set) ranged from an index value of 0.35 in Rodds Bay, to 4.62 in the Narrows. Prevalence of rust lesions ranged from 0.02 to 0.15 (Boat Creek and Auckland Inlet, respectively). The index value for the sex ratio measure was lowest at Auckland Inlet (0.11) and highest at Inner Harbour (2.20).
Table 5. Calculated index values for 2017 and 2018, for each of the four recommended measures in each of the seven recommended long-term monitoring sites.
In the first full sampling year of 2018, data from February and June were combined before calculating the annual index values and scores. Using this annual dataset, index values for abundance ranged from 0.10 in Auckland Inlet to 3.25 in the Narrows. Rust ranged from 0.00 in three of the zones to 0.07 at Rodds Bay. Sex ratio ranged from 0.07 at the Narrows to 0.75 at Boat Creek.
Calculated scores and grades for each Zone and the Harbour are provided for the pilot year of 2017 and the first full sampling year 2018 in and respectively. In 2017, the Harbour Average score was 0.55, a grade of ‘C’ (satisfactory) using the Gladstone Harbour Report Card grading system (). In 2018 the Harbour Average score fell only slightly to 0.51, also a ‘C’ ().
Table 6. Scores and [grades] for mud crab measures and the mud crab indicator by Zone and indicator score for the Harbour in the pilot year, 2017.
Table 7. Scores and [grades] for mud crab measures and the mud crab indicator by Zone and indicator score for the Harbour in 2018.
The 2017 grades for abundance were highest (A) at the Narrows, Boat Creek and Inner Harbour. The lowest grade (E) was recorded at Calliope Estuary, Auckland Inlet and Rodds Bay. Except for the Narrows (A), abundance grades were generally lower during 2018.
In 2017, five of the seven zones were graded A for prevalence of rust lesions (the Narrows, Graham Creek, Boat Creek, Inner Harbour and Calliope Estuary), Rodds Bay was graded B and the lowest grade (C) was recorded in Auckland Inlet, which is situated in an urban and industrial area (). In 2018, prevalence of rust lesions was graded A in six of the seven zones. At Auckland Inlet a zero prevalence of lesions was recorded, but a grade was not calculated due to the small sample size from that site (n = 4 mud crabs).
In the 2017 pilot year all Gladstone zones except Inner Harbour (B) scored poorly on the sex ratio measure. The lowest grades (E) were recorded at the Narrows, Boat Creek and Auckland Inlet. Poor results were also recorded for this measure in the 2018 sampling year, with five zones graded E (the Narrows, Graham Creek, Inner Harbour, Calliope Estuary and Rodds Bay), and one graded D (Boat Creek). Auckland Inlet was not graded due to the low sample size (n = 4 mud crabs).
Discussion
Seven long-term monitoring zones were selected and a range of measures were investigated. Three measures were selected as suitable for inclusion in a multi-metric indicator for Gladstone Harbour: abundance (CPUE), prevalence of rust lesions, and sex ratio. The measures, baselines and scoring system were developed and tested in a pilot year (2017) and scored against ten predefined selection criteria. The measures were applied and refined during the first full year of mud crab monitoring (2018).
The Harbour Average was a grade of C in both 2017 (pilot year – single sampling event) and 2018 (two sampling events). The overall grade results for each of the monitoring sites is likely to reflect a variety of pressures on mud crabs in Gladstone Harbour, including commercial fishing, recreational fishing and environmental/habitat condition. However natural biological variability also plays a role in catches (reflected as abundance) which is why a long-term view of the trends and patterns in scores and grades is warranted. Waterway report cards can provide a suitable vehicle for the implementation and maintenance of long-term monitoring programs and trend analysis, as well as fulfilling their primary role of providing information to stakeholders and the community.
In this study, we have developed and piloted an indicator for an iconic crustacean species that is of high value to the community as a commercial and recreational fisheries product. The indicator is relatively simple to monitor annually in comparison to some other potential biological indicators that require laboratory analysis, and has minimal impacts on the target species, local ecosystem or stakeholders, as sampling is non-lethal and uses a low-impact fishing method. Annual monitoring costs have ranged up to approximately A$85,000, met by a mix of direct funds and in-kind contribution. A similar monitoring and scoring approach could be adopted for large crustaceans that are locally relevant to other regions. Each of the three measures that combine to the mud crab indicator has positive and negative aspects in terms of long-term monitoring and reporting.
Abundance
The abundance metric has some limitations in short-term datasets, as a wide range of natural and anthropogenic factors can potentially influence the local abundance of mud crabs. Discrepancies in abundance can be caused by capture technique, sampling areas and sampling times, or by differences in crab distribution, growth or survival induced by habitat and environmental conditions (Alberts-Hubatsch et al. Citation2016). In this study, possible variations due to seasonality, tidal cycle, catch and sampling techniques were controlled to the greatest possible extent by accounting for these factors when scheduling field work. When these factors are controlled, abundance can be better related to pressures such as extraction (fishing) and recruitment limitation. To account for the natural variability in mud crab populations a ten-year moving average benchmark was applied for this measure. Until a ten-year benchmark has been established, the potential for normal variations in abundance scores is communicated through the annual monitoring reports and the report card.
Variability in abundance of mud crabs as a result of weather conditions is well recognised in Australia, for example Meynecke et al. (Citation2012) analysed catch and effort data for mud crabs (S. serrata) from the Northern Territory (NT; 1990 to 2008) in comparison to climatic data and the Southern Oscillation Index. Between 30 and 40 per cent of variation in CPUE was explained by periods of high rainfall and the Southern Oscillation Index, with greater freshwater inputs into estuarine habitats, along with warmer water temperatures (Meynecke et al. Citation2012). Temperatures were also found to affect CPUE of mud crabs, which are less active at high (>40°C) and low (<20°C) temperatures (Meynecke et al. Citation2012). Similarly, Chandrasekaran and Natarajan (Citation1994) found that high rainfall and associated lower salinity (as low as 1.52 ppt) in an Indian estuary resulted in lower densities of juvenile S. serrata. Mud crabs tend to be dominant in mangrove habitats which typically have salinities around 34 ppt but are vulnerable to reduced salinity following flood events (Meynecke et al. Citation2012). Global warming is predicted to increase the occurrence of extreme La Niña and high intensity rainfall events (Boschat et al. Citation2015; Cai et al. Citation2015) and the associated higher rainfall and lower water salinity could potentially be detrimental to mud crab populations. It will be important to continue to monitor mud crabs in Gladstone Harbour to detect any impacts of climate change on this locally valuable species. Simple metrics like abundance (CPUE using standardised capture techniques) provide a means of detecting long term trends such as those that could result from climate change, and of quantifying sudden localised shifts caused by point-source impacts.
Prevalence of rust lesions
Rust shell lesions are a periodically recurring issue in Gladstone Harbour (Andersen and Norton Citation2001; Andersen Citation2003; Wesche et al. Citation2013; Dennis et al. Citation2016). While lesions are not infectious and mud crabs with rust lesions are still suitable for human consumption, shell perforations and lesions can be unsightly, and generate community and commercial concern. In the one 2017 and two 2018 sampling events reported in this study, the prevalence of lesions was low. The highest recorded prevalence over the two years was ∼15 per cent recorded in June 2017 at Auckland Inlet, an urbanised creek with potential inputs from nearby land uses including the city of Gladstone. The second highest prevalence was ∼12 per cent recorded in June 2018 at Rodds Bay, which is situated in a relatively non-industrial and non-urbanised catchment. The lower sample sizes at these two zones may have driven the result, rather than genuine variations between zones.
The first records of rust spot shell lesions in mud crabs from Gladstone Harbour were reported by commercial fishers (Andersen and Norton Citation2001). While the exact cause of these lesions remains unconfirmed, it is thought that the lesions may be related to inhibition of calcium uptake, possibly following sublethal exposure to copper and zinc in the environment (Andersen, Norton, and Levy Citation2000; Andersen and Norton Citation2001). Because rust spots are not continuously observed at high prevalence in the Gladstone Harbour region and are sometimes reported at low prevalence in other developed estuaries in Queensland (e.g. the Fitzroy River, Moreton Bay and Ayr; Andersen, Norton, and Levy Citation2000), the prevalence of rust spot at any given time may provide an overall indication of environmental state (Andersen and Norton Citation2001). Further support for this is provided by the analysis of a high incidence of disease in finfish and crabs in Gladstone Harbour in 2011–12 by Dennis et al. (Citation2016). In that 2011–12 study, rust spot lesions were identified on 37 per cent of mud crabs caught in Gladstone Harbour, a greater prevalence than has previously been recorded in the region and a much greater prevalence than recorded during the present study.
This measure provides a potentially useful assessment of environmental condition in an industrial harbour, although further research to determine the exact cause of the disease is recommended. The key benefit of developing a long-term dataset of the prevalence of locally relevant diseases is that if disease events occur in future, either at single sites or across monitoring regions, baseline data from non-event years will be available for comparison. As more data are collected, the measure could potentially be revised to incorporate lesion severity, judged by lesion size and whether the shell has been perforated (Andersen Citation2003).
Sex ratio
Both recreational and commercial fishing are major extractive pressures on Queensland’s mud crab populations (Department of Agriculture and Fisheries Citation2018). In areas such as Queensland, where females are protected, a change in the ratio of males to females is likely to be indicative of a change in fishing pressure (Pillans et al. Citation2005; Alberts-Hubatsch et al. Citation2016). While in unfished areas mud crab populations are male-dominated with a 2:1 or even 3:1 male:female sex ratio (Butcher 2004; Pillans et al. Citation2005; Bonine et al. Citation2008), most of Gladstone Harbour has much lower sex ratios.
The carapace widths of mud crabs caught at the seven monitoring sites were recorded and reflect the higher fishing pressure on large (legal sized) males. Across the three sampling events in 2017 and 2018, and in the 2000–2009 LTMP data provided by Fisheries Queensland, the average size of male mud crabs caught was consistently lower than the average size of females. The results signal a high-participation fishery, which is not surprising as Gladstone is one of the most heavily fished mud crabbing regions in Queensland, both by effort (commercial license numbers) and commercial catch (DAF Citation2021). There is also a large recreational fishing sector for mud crabs in Gladstone, and this effort is most likely focused on areas that are closer to boat ramp infrastructure, such as Calliope Estuary, Auckland Creek and Rodds Bay. It is also worth noting that the female-biased sex ratio observed in Gladstone Harbour suggests a positive tendency of fishers to observe and comply with regulations regarding the release of females.
There are possible population and ecosystem implications for a shift in sex ratio, for example male mud crabs dig extensive burrows extending below the low-tide water table (Fielder and Heasman Citation1978; Bonine et al. Citation2008) which may aid the process of bioturbation in mangrove systems. Also, males of other Scylla species (S. olivacea, S. tranquebarica and S. paramamosain) reportedly mate only with females that are smaller than them (Fazhan et al. Citation2017). It is not yet known whether the same is true of S. serrata, and if it is, whether other biological mechanisms are also relevant under some conditions. For instance, studies of S. olivacea mating behaviour have recommended sex ratios of 1 male: 2 females for maximum production in aquaculture settings (Waiho et al. Citation2015). In summary, the long term consequences of the disruption of natural sex ratios in Queensland’s mud crab populations, if any, are not yet known. This is a knowledge gap for the mud crab indicator and represents a priority area for further research.
Mud crabs as indicators
This study provides a framework for the development of an adult mud crab indicator, baselines and scoring systems suitable for use in a waterway health report card. Mud crabs are recreationally and commercially valuable and are a useful species to monitor as they have relatively small ranges (in comparison to highly mobile fish species and with the possible exception of spawning female migrations in some areas), are easy to catch and identify, abundant, relatively long-lived for a crustacean, resistant to handling stress and tolerant to environmental variations. These are all features of effective biological indicators (Rainbow Citation1995).
A multi-metric mud crab indicator was developed for the first time and successfully incorporated into the Gladstone Harbour Report Card alongside other environmental indicators including water and sediment quality, habitat indicators (seagrass, coral, mangroves) and more recently, fish health. The inclusion of biological indicators such as the mud crab indicator add value to report cards, as they reflect cumulative pressures which may not be evident in water and sediment quality results, or even some habitat indicators. A twice annual monitoring program for mud crab was developed, using standardised methods and sampling locations. Over time, the program will provide data for future analysis of long-term trends in mud crab abundance, the prevalence of rust lesions and sex ratio, which will be helpful in informing management activities aimed at improving harbour health.
By incorporating a range of information on mud crab abundance, locally-relevant disease and sex ratios, the mud crab indicator reflects the range of pressures on inshore marine species in the region, including commercial and recreational fishing (sex ratio, abundance), and environmental condition (abundance, rust shell lesions). A potential downfall when scoring the indicator is that no early baseline data are available to understand how abundant mud crabs were in the harbour before development or fishing pressures escalated. A possible area for future research is to attempt to model past populations of mud crabs, based on factors such as previous and current habitat availability, fishing rates and the status of female populations, which should be closer to capacity than male populations since they are not harvested. Also, as more data are collected through long-term monitoring, it may be possible and helpful to weight the three measures differently before combining them, rather than using the average as the indicator score. For example, weightings could be based on natural variability or on each measure’s relative importance in assessing environmental condition.
As well as being ecologically relevant, a benefit of reporting on this large, charismatic, edible crustacean is that strong public interest draws community attention to both the report card and the state of mangrove-lined estuaries, high-value ecosystems under increasing pressure (Sippo et al. Citation2018). The use of an iconic species can make the monitoring results more relevant and understandable to stakeholders, managers and the community, which is recognised as an important aspect of effective estuary monitoring programs (Hallett, Valensini, and Elliott Citation2016). By selecting non-lethal monitoring methods and sampling with low-impact fishing gears, regular monitoring of the indicator does not negatively impact stocks, habitats, or the ability of other stakeholders to access the resource, which is a potentially important consideration for public acceptance. We propose the indicator development framework presented here could be applied elsewhere, either for mud crabs (within their natural range), or for other large crustaceans that are exposed to similar pressures.
Supplemental Material
Download PDF (625.2 KB)Acknowledgements
This research was carried out in accordance with conditions of approval provided by the CQUniversity Animal Ethics Committee (Approval number: 20633); a General Fisheries Permit from the Queensland Department of Agriculture and Fisheries (Permit number: 192151); and authorisation for research in the Great Barrier Reef Marine Park (Approval number: G17/05-027). The authors thank John Rolfe, Eva Abal, Melissa Dobbie, Mark Schultz, Uthpala Pinto, Jonathan Staunton-Smith and Jason McGilvray for helpful discussions. Thanks to Dylan Charlesworth and Ryan Lauve for operational and technical assistance. The Queensland Department of Agriculture and Fisheries provided data from the Queensland Mud Crab Fishery Long Term Monitoring Program which is gratefully acknowledged. This manuscript was improved by helpful comments from two anonymous reviewers. The authors would like to take this opportunity to respectfully acknowledge the Traditional Owners of the land on which we live, work and learn, and pay our respects to the Elders, past, present and future for they hold the memories, the traditions, the culture and hopes of Indigenous Australia. In particular we pay our respects to the peoples on whose Country this research was carried out.
Disclosure statement
No potential conflict of interest was reported by the author(s).
Additional information
Funding
References
- Alberts-Hubatsch, H., S. Y. Lee, J.-O. Meynecke, K. Diele, I. Nordhaus, and M. Wolff. 2016. “Life-history, Movement, and Habitat use of Scylla serrata (Decapoda, Portunidae): Current Knowledge and Future Challenges.” Hydrobiologia 763 (1): 5–21.
- Andersen, L. 2003. “A Study into the Epidemiology of Mud Crab (Scylla Serrata) Shell Disease.” Masters Thesis. Central Queensland University.
- Andersen, L., and J. Norton. 2001. Port Curtis Mud Crab Shell Disease: Nature, Distribution and Management. FRDC Project No. 98/210. Gladstone, Australia: Central Queensland University.
- Andersen, L., J. Norton, and N. H. Levy. 2000. “A New Shell Disease in the Mud Crab Scylla serrata from Port Curtis, Queensland (Australia).” Diseases of Aquatic Organisms 43 (3): 233–239.
- Andersen, L., A. Revill, and A. Storey. 2005. “Metal Bioaccumulation Through Food Web Pathways in Port Curtis.” Technical Report No. 31. Cooperative Research Centre for Coastal Zone Estuary and Waterway Management, Gladstone, Australia.
- Andersen, L. E., A. W. Storey, A. Sinkinson, and N. Dytlewski. 2003. Transplanted Oysters and Resident Mud Crabs as Biomonitors in Spillway Creek. A report to Boyne Smelters Limited. Gladstone, Australia: Central Queensland University.
- Bonine, K. M., E. P. Bjorkstedt, K. C. Ewel, and M. Palik. 2008. “Population Characteristics of the Mangrove Crab Scylla serrata (Decapoda: Portunidae) in Kosrae, Federated States of Micronesia: Effects of Harvest and Implications for Management.” Pacific Science 62 (1): 1–19.
- Boschat, G., A. Pezza, I. Simmonds, S. Perkins, T. Cowan, and A. Purich. 2015. “Large Scale and sub-Regional Connections in the Lead up to Summer Heat Wave and Extreme Rainfall Events in Eastern Australia.” Climate Dynamics 44: 1823–1840.
- Brewster, A. 2015. Giving This Country a Memory: Contemporary Aboriginal Voices of Australia. New York, US: Cambria Press.
- Butcher, P. A. 2004. “Mud Crab (Scylla serrata) and Marine Park Management in Estuaries of the Solitary Islands Marine Park, New South Wales.” Student thesis: Doctor of Philosophy (PhD) - University of New England, Armidale, Australia. https://hdl.handle.net/1959.11/2398.
- Bunn, S. E., E. G. Abal, M. J. Smith, S. C. Choy, C. S. Fellows, B. D. Harch, M. J. Kennard, and F. Sheldon. 2010. “Integration of Science and Monitoring of River Ecosystem Health to Guide Investments in Catchment Protection and Rehabilitation.” Freshwater Biology 55: 223–240.
- Cai, W., G. Wang, A. Santoso, M. J. McPhaden, L. Wu, F.-F. Jin, A. Timmermann, et al. 2015. “Increased Frequency of Extreme La Niña Events under Greenhouse Warming.” Nature Climate Change 5 (2): 132–137.
- Chandrasekaran, V. S., and R. Natarajan. 1994. “Seasonal Abundance and Distribution of Seeds of Mud Crab Scylla serrata in Pichavaram Mangrove.” Journal of Aquaculture in the Tropics 9: 343–350.
- Connolly, R. M., D. R. Currie, K. F. Danaher, M. Dunning, A. Melzer, J. R. Platten, D. Shearer, P. J. Stratford, P. R. Teasdale, and M. Vandergragt. 2006. “Intertidal Wetlands of Port Curtis: Ecological Patterns and Processes, and their Implications.” Technical Report No. 43, CRC for Coastal Zone, Estuary and Waterway Management, Brisbane, Australia.
- Cooper, T. F., J. P. Gilmour, and K. E. Fabricius. 2009. “Bioindicators of Changes in Water Quality on Coral Reefs: Review and Recommendations for Monitoring Programmes.” Coral Reefs 28 (3): 589–606.
- R Core Team. 2016. R: A Language and Environment for Statistical Computing. Vienna, Austria: R Foundation for Statistical Computing. https://www.R-project.org/.
- DAF. 2017. Mud Crab Fisheries, 25 March 2017, Online Resource. https://www.daf.qld.gov.au/fisheries/monitoring-our-fisheries/data-reports/sustainability-reporting/queensland-fisheries-summary/mud-crab-fishery.
- DAF. 2021. QFish database, 20 January 2021, Online Resource. https://qfish.fisheries.qld.gov.au/.
- Dennis, M. M., B. K. Diggles, R. Faulder, L. Olyott, S. B. Pyecroft, G. E. Gilbert, and M. Landos. 2016. “Pathology of Finfish and Mud Crabs Scylla serrata During a Mortality Event Associated with a Harbour Development Project in Port Curtis, Australia.” Diseases of Aquatic Organisms 121 (3): 173–188.
- Dennison, W. C., T. R. Lookingbill, T. J. B. Carruthers, J. M. Hawkey, and S. L. Carter. 2007. “An Eye-Opening Approach to Developing and Communicating Integrated Environmental Assessments.” Frontiers in Ecology and the Environment 5 (6): 307–314.
- Department of Agriculture and Fisheries. 2018. Discussion paper: Reform of the Queensland Crab (Mud and Blue Swimmer) Fishery. Online Resource. https://publications.qld.gov.au/dataset/5fa22d9b-6be8-4a92-920d-58d8b85af298/resource/dab96625-68d7-4149-bc1a-33104a005342/download/crab-discussion-paper.pdf
- DTMR (Department of Transport and Main Roads). 2015. Trade Statistics for Queensland Ports for the Five Years Ending 30 June 2015. Brisbane, Australia.
- Dumas, P., M. Léopold, L. Frotté, and C. Peignon. 2012. “Mud Crab Ecology Encourages Site-Specific Approaches to Fishery Management.” Journal of Sea Research 67 (1): 1–9.
- FAO. 2017. Scylla serrata, 3 April 2017. https://www.fao.org/fishery/species/2637/en.
- Fazhan, H., K. Waiho, W. I. W. Norfaizza, F. H. Megat, and M. Ikhwanuddin. 2017. “Assortative Mating by Size in Three Species of Mud Crabs, Genus Scylla De Haan, 1833 (Brachyura: Portunidae).” Journal of Crustacean Biology 37 (5): 654–660.
- Fielder, D. F., and M. P. Heasman. 1978. The Mud Crab. Brisbane: Queensland Museum. 15 p.
- Flint, N., E. L. Jackson, S. Wilson, K. Verlis, and J. Rolfe. 2015. Synthesis of Water Quality Influences in Ports of the Fitzroy Region, Queensland. Rockhampton, Australia: CQUniversity. https://riverhealth.org.au/wp-content/uploads/2016/02/Ports-23_10_2015.pdf.
- Flint, N., J. Rolfe, C. E. Jones, C. Sellens, N. D. Johnston, and L. Ukkola. 2017. “An Ecosystem Health Index for a Large and Variable River Basin: Methodology, Challenges and Continuous Improvement in Queensland’s Fitzroy Basin.” Ecological Indicators 73: 626–636.
- GBRMPA. 2016. Gladstone and Rodds Bay Dugong Protection Area. Townsville, Australia: Great Barrier Reef Marine Park Authority. https://hdl.handle.net/11017/2999.
- GBRMPA. 2019. Great Barrier Reef Outlook Report 2019. Townsville, Australia: Great Barrier Reef Marine Park Authority.
- GHHP (Gladstone Healthy Harbour Partnership). 2016. “Technical Report, Gladstone Harbour Report Card 2016.” GHHP Technical Report No.3, Gladstone, Australia.
- Giblock, S. M., and D. Crain. 2013. “Fiddler Crabs (Uca Pugilator) as Bioindicators of Environmental Health in Coastal Estuarine Communities of Beaufort, South Carolina.” Papers & Publications: Interdisciplinary Journal of Undergraduate Research 2 (1): 13.
- Hallett, C. S., F. Valensini, and M. Elliott. 2016. “A Review of Australian Approaches for Monitoring, Assessing and Reporting Estuarine Condition: I. International Context and Evaluation Criteria.” Environmental Science and Policy 66: 260–269.
- Herzfeld, M., J. Parslow, J. Andrewartha, P. Sakov, and I. Webster. 2004. “Hydrodynamic Modelling of the Port Curtis Region.” Technical Report No.7. Cooperative Research Centre for Coastal Zone, Estuary and Waterway Management, Brisbane, Australia.
- Hyland, S. J., B. J. Hill, and C. P. Lee. 1984. “Movement Within and Between Different Habitats by the Portunid Crab Scylla serrata.” Marine Biology 80 (1): 57–61.
- Ikhwanuddin, M., G. Azmie, H. M. Juariah, M, Z. Zakaria, and M. A. Ambak. 2011. “Biological Information and Population Features of Mud Crab, Genus Scylla from Mangrove Areas of Sarawak, Malaysia.” Fisheries Research 108 (2): 299–306.
- Jebreen, E., S. Helmke, C. Lunow, C. Bullock, N. Gribble, O. Whybird, and R. Coles. 2008. Fisheries Long Term Monitoring Program, Mud Crab (Scylla serrata) Report: 2000–2002. Brisbane, Australia: Department of Primary Industries and Fisheries.
- Jithendran, K. P., M. Poornima, C. P. Balasubramanian, and S. Kulasekarapandian. 2010. “Diseases of Mud Crabs (Scylla spp.): An Overview.” Indian Journal of Fisheries 57: 55–63.
- Logan, M., Z. Hu, R. Brinkman, S. Sun, X. Sun, and B. Schaffelke. 2020. “Ecosystem Health Report Cards: An Overview of Frameworks and Analytical Methodologies.” Ecological Indicators 113: 105834.
- Knuckey, I. A. 1999. “Mud Crab (Scylla Serrata) Population Dynamics in the Northern Territory, Australia and their Relationship to the Commercial Fishery.” Student thesis: Doctor of Philosophy (PhD) - Northern Territory University. Darwin, Australia. doi.org/10.25913/5eb246a5e2c86.
- McIntosh, E. J., J. Rolfe, U. Pinto, J. Kirkwood, M. Greenlee, and I. R. Poiner. 2019. “Designing Report Cards for Aquatic Health with a Whole-of-System Approach: Gladstone Harbour in the Great Barrier Reef.” Ecological Indicators 102: 623–632.
- McPherson, R., and K. Brown. 2001. “The Bioaccumulation of Cadmium by the Blue Swimmer Crab Portunus Pelagicus L.” Science of The Total Environment 279 (1): 223–230.
- Meynecke, J.-O., M. Grubert, J. M. Arthur, R. Boston, and S. Y. Lee. 2012. “The Influence of the La Niña-El Niño Cycle on Giant Mud Crab (Scylla serrata) Catches in Northern Australia.” Estuarine, Coastal and Shelf Science 100: 93–101.
- Meynecke, J.-O., and R. G. Richards. 2014. “A Full Life Cycle and Spatially Explicit Individual-Based Model for the Giant Mud Crab (Scylla serrata): A Case Study from a Marine Protected Area.” ICES Journal of Marine Science 71: 484–498.
- Mirera, O. D. 2011. “Trends in Exploitation, Development and Management of Artisanal Mud Crab (Scylla serrata Forsskal-1775) Fishery and Small-Scale Culture in Kenya: An Overview.” Ocean & Coastal Management 54: 844–855.
- Negri, A. P., M. Mortimer, S. Carter, and J. F. Muller. 2009. “Persistent Organochlorines and Metals in Estuarine Mud Crabs of the Great Barrier Reef.” Marine Pollution Bulletin 48: 769–773.
- OECD. 2001. Glossary of Statistical Terms. Organisation for Economic Co-operation and Development (OECD). Online Resource, https://stats.oecd.org/glossary/detail.asp?ID=830.
- Pascoe, S., R. Tobin, J. Windle, T. Cannard, N. Marshall, Z. Kabir, and N. Flint. 2016. “Developing a Social, Cultural and Economic Report Card for a Regional Industrial Harbour.” PLoS ONE 11 (2): e0148271.
- Pillans, S., R. D. Pillans, R. W. Johnstone, P. G. Kraft, M. D. E. Haywood, and H. P. Possingham. 2005. “Effects of Marine Reserve Protection on the Mud Crab Scylla serrata in a Sex-Biased Fishery in Subtropical Australia.” Marine Ecology Progress Series 295: 201–213.
- Rainbow, P. S. 1995. “Biomonitoring of Heavy Metal Availability in the Marine Environment.” Marine Pollution Bulletin 31 (4-12): 183–192.
- Sen, S., and S. Homechaudhuri. 2017. “Population Characteristics and Trends in Artisanal Fishery of Scylla serrata (Forsskål, 1775) in Indian Sundarban: Implications on Future Managements.” Ocean & Coastal Management 143: 105–114.
- Sippo, J. Z., C. E. Lovelock, I. R. Santos, C. J. Sanders, and D. T. Maher. 2018. “Mangrove Mortality in a Changing Climate: An Overview.” Estuarine, Coastal and Shelf Science 215: 241–249.
- The State of Queensland. 2018. Rules and Regulations, Crabs and Lobsters. Queensland Department of Agriculture and Fisheries. Online Resource, https://www.daf.qld.gov.au/business-priorities/fisheries/recreational/rules-regulations/crabs-and-lobsters.
- UNESCO. 2016. Great Barrier Reef, 1 December 2017, United Nations, Educational, Scientific and Cultural Organization – World Heritage Convention. Online Resource, https://whc.unesco.org/en/list/154.
- van Oosterom, J., S. Codi King, A. Negri, C. Humphrey, and J. Mondon. 2010. “Investigation of the Mud Crab (Scylla serrata) as a Potential Bio-Monitoring Species for Tropical Coastal Marine Environments of Australia.” Marine Pollution Bulletin 60 (2): 283–290.
- Waiho, K., M. Mustaqim, H. Fazhan, W. I. W. Norfaizza, F. H. Megat, and M. Ikhwanuddin. 2015. “Mating Behaviour of the Orange Mud Crab, Scylla Olivacea: The Effect of sex Ratio and Stocking Density on Mating Success.” Aquaculture Reports 2: 50–57.
- Walton, M. E., L. Le Vay, J. H. Lebata, J. Binas, and J. H. Primavera. 2007. “Assessment of the Effectiveness of Mangrove Rehabilitation Using Exploited and non-Exploited Indicator Species.” Biological Conservation 138 (1–2): 180–188.
- Wesche, S., T. Lucas, D. Mayer, D. Waltisbuhl, and R. Quinn. 2013. “‘Gladstone Harbour Fish Health Investigation 2011-2012’. Department of Agriculture, Fisheries and Forestry, State of Queensland.” Brisbane. https://era.daf.qld.gov.au/id/eprint/7012/.
- Wickham, H. 2009. ggplot2: Elegant Graphics for Data Analysis. New York: Springer-Verlag.
- Wickham, H. 2011. “The Split-Apply-Combine Strategy for Data Analysis.” Journal of Statistical Software 40 (1): 1–29.