
ABSTRACT
Mining is an environmentally destructive human activity. Consequently, community expectations and legislation require minimisation of impacts and rehabilitation once mining ceases. Rehabilitation standards now include restoration of structural and functional attributes of pre-disturbed landscapes. However, insufficient baseline data before, and during, mining often makes it difficult to assess impacts and develop rehabilitation objectives. Techniques that retrospectively document the pre-impact condition and environmental history of wetlands affected by mines can provide this information. We demonstrate how this can be achieved using data from palaeoecology and remote sensing, to understand mine impact on Fishermans Wetland, North Stradbroke Island (Minjerribah), by inferring its environmental history from formation to present. Fishermans Wetland is a small, clear, open water, wetland with extensive macrophyte growth. A lack of information about the wetland’s pre-mine condition created uncertainty about the effects of upstream sand mining. Contrary to local community concerns that Fishermans Wetland was ancient and hydrologically modified by mining, it only formed in the 1950s. Moreover, changes to site hydrology predated mining. Consequently, ongoing supplementation of water is unnecessary for maintaining the wetland’s ecological character. Similar techniques could be used elsewhere where mine impacts are poorly understood or contested.
Introduction
Globally, environmental impact assessments (EIA) and rehabilitation plans are used to minimise environmental and biodiversity degradation (Morgan Citation2012). As well as formalised legislative procedures, mining companies face increasing pressure to operate in accordance with community attitudes and expectations (Laurence Citation2021; Walsh, van der Plank, and Behrens Citation2017). This reflects the concept of corporate social responsibility, and more specifically the ‘social licence to operate’ which indicates stakeholders’ acceptance of the activity, and which is now pivotal to mining companies’ continued operations (Bice Citation2014; Laurence Citation2021). In combination, formal EIA and corporate social responsibility are essential to ensuring mining activities achieve desired social, economic, governance and environmental outcomes (Laurence Citation2021; Bond and Kelly Citation2021).
Australia has a long mining history, and mining is a key contributor to the nation’s economy. There is a widely held societal assumption that rehabilitation should return mine sites to their pre-mining land use, with a distinct focus on rehabilitation of native terrestrial biodiversity (Manero et al. Citation2020; Lamb, Erskine, and Fletcher Citation2015). ‘Rehabilitation’ generally refers to the process where land is returned to a safe, non-polluted, self-sustainable state (Lamb, Erskine, and Fletcher Citation2015; Lechner, Kassulke, and Unger Citation2016). Mine site closure and rehabilitation are under increasing public and stakeholder scrutiny, with poor quality rehabilitation often a problem (Unger, Everingham, and Bond Citation2020). Ideally, following mine closure, mining companies rehabilitate mine sites to an agreed post-mining state (Manero et al. Citation2020).
Until the late twentieth century, there were few legal requirements to rehabilitate closed Australian mine sites (Unger, Everingham, and Bond Citation2020). This has left 50,000–80,000 abandoned mine sites on the continent (Werner et al. Citation2020; Unger, Everingham, and Bond Citation2020). Mine closure and rehabilitation in Australia has subsequently become better regulated, with legislation in place for several decades which obliges companies to rehabilitate mine sites (Cristescu, Frère, and Banks Citation2012; Lamb, Erskine, and Fletcher Citation2015). Ultimately, final post-mining land use is often decided in consultation with government agencies and stakeholder groups (Vivoda, Kemp, and Owen Citation2019). Full rehabilitation of mine sites is rare (Lamb, Erskine, and Fletcher Citation2015; Vivoda, Kemp, and Owen Citation2019) and the process is long and costly.
In Australia, the regulation of mining activity is a matter for state and territory governments, with some exceptions (e.g. uranium mines which are governed by Federal legislation; Unger, Everingham, and Bond Citation2020). It has been a historical practice for Australian mining companies to classify mines as being under ‘care and maintenance’ (Lamb, Erskine, and Fletcher Citation2015). This classification has allowed companies to avoid full rehabilitation responsibilities as it suggests that mining has only paused rather than ceased (Khanal and Hodgkinson Citation2021; Unger, Everingham, and Bond Citation2020). In response, government agencies have developed regulations that are more stringent and increase accountability (Khanal and Hodgkinson Citation2021). In the state of Queensland, for example, the Mineral and Energy Resources (Financial Provisioning) Act 2018 states that new and existing mines require a progressive rehabilitation and closure plan. This legislation requires that rehabilitation occurs progressively throughout mine lifecycles, not only at the end of operations. Companies must also ensure rehabilitation occurs before their license is relinquished (Getty and Morrison-Saunders Citation2020; Khanal and Hodgkinson Citation2021). There is also a greater focus on community consultation and working with stakeholders to develop post-mining land use (Vivoda, Kemp, and Owen Citation2019). This marks an important step towards mining accountability and responsibility, as the effects of mining on biodiversity, and environmental processes, in particular freshwater systems, are well documented (e.g. Beck et al. Citation2020; Mudd and Patterson Citation2010). Critically, the legislation requires that mines which commenced before the legislation was enacted also need to comply with rehabilitation requirements (Queensland Government Citation2019). One challenge with this requirement is an absence of appropriate data to assess past ecosystem conditions (i.e. before mining commenced and through the life of mine). Approaches such as this study, which investigates the history of Fishermans Wetland on North Stradbroke Island (Minjerribah), provide a means of retrospectively assessing mine impacts in the absence of longitudinal environmental data.
Wetlands are globally important ecosystems with high biodiversity (Junk et al. Citation2006) that provide a wide variety of ecosystem services (Costanza et al. Citation1997). Minjerribah has more than 70 freshwater wetlands (lakes, streams and palustrine wetlands) and the highest concentration of wetlands dating to the last glacial maximum, more than 18,000 years ago, on the Australian mainland (Tibby et al. Citation2017). These wetlands support a range of endemic algae, higher plants and animals (Rott, Kling, and McGregor Citation2006; Marshall et al. Citation2011). Minjerribah’s wetlands are the subject of ongoing study into the environmental and climate history of the island and eastern Australia (Moss et al. Citation2013; Barr et al. Citation2013, Citation2017, Citation2019; Cadd et al. Citation2018; Maxson et al. Citation2021; Chang et al. Citation2015; Mettam et al. Citation2011).
This study investigates the age and historical context of Fishermans Wetland (), situated only 200 m from the former Yarraman mineral sand mine which operated between 1999 and 2014. During mining, groundwater was extracted from the island's regional aquifer to maintain a pond essential for dredging and extraction of heavy minerals from the sands. This extraction process led to localised groundwater level drawdown, which, if left unaddressed, had the potential to alter the hydrology of Fishermans Wetland. In order to avert this possibility, pumped groundwater was used to artificially water the catchment upstream of Fishermans Wetland, maintaining the water level within the wetland. It was suggested by Traditional Owners and other local stakeholders that Fishermans Wetland may be perennial, with a long history and important conservation values (Department of Environment and Science Citation2019a). However, no formal assessment of its values had previously been undertaken. The Quandamooka Yoolooburrabee Aboriginal Corporation (QYAC) expressed concerns regarding the hydrological ramifications of the sand mining activities at the Yarraman Mine on Fishermans Wetland. Specifically, debate revolved around whether the lacustrine (open water) section of the wetland was a naturally occurring, perennial feature and whether it had suffered impacts due to mineral sand mining activities. It was suggested that impacts could extend to the potential loss of permanent water, alterations in water quality, and subsequent shifts in the composition and structural integrity of aquatic and terrestrial vegetation. Nonetheless, no pre-mining data pertaining to water levels, water quality or the ecological aspects of Fishermans Wetland were available. As a result, the Queensland Government instigated the investigation (Department of Environment and Science Citation2019b) on which this study is based.
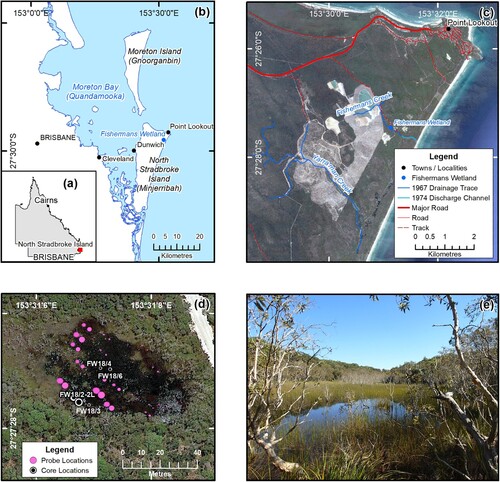
Figure 1. Study Location. (a) and (b). North Stradbroke Island (Minjerribah) with location of Fishermans Wetland. (c). Satellite image of north-west Minjerribah showing the landscape clearance associated with the Yarraman sand mine (lighter coloured area to the west and southwest of Fishermans Wetland). (d). Sediment depth, core and probing sites within the open water are of the wetland (image date: 27/10/2017; source: Google Earth Pro. (2019)). The symbol size for the coring and probing locations is proportional to the thickness of organic sediment (maximum = 1.5 m). Note that core FW18/2 and FW18/2-L are within 1 m so cannot be plotted separately. (e). Overview of Fishermans Wetland looking east to west. Dead, submerged, Melaleuca trees can be observed in the middle ground.
Yarraman Mine ceased operations towards the end of 2014, after legislation, starting with the North Stradbroke Island Protection and Sustainability Act 2011, enforced the phasing out of mining operations on the island (Queensland Government Citation2022). Based on the requirements of the Mineral and Energy Resources (Financial Provisioning) Act 2018, the rehabilitation and closure process of the Yarraman Mine was completed in consultation with stakeholders, including QYAC. Stakeholder consultation identified the need for investigations into the history of potential mine related impacts to Fishermans Wetland.
It is possible to determine the wetland’s change through time by examining a variety of biological and chemical remains deposited in lake sediments (i.e. the science of paleolimnology; e.g. Barr et al. Citation2013). Analysis of historical aerial photography, satellite imagery and survey and topographic mapping provides another method of identifying and documenting the changes in wetlands and their catchments. These techniques were utilised to assess the concerns. Specifically, this study sought to determine the age of Fishermans Wetland and whether any changes in water quantity and quality, wetland ecology, and wetland and catchment vegetation were associated with upstream sand mining activities from Yarraman Mine.
Study site
Minjerribah is the second largest sand island in the world, covering an area of 285 km2 (; Barr et al. Citation2013). The island is made up of a number of south-east to north-west orientated dunes which were predominantly deposited during sea level transgressions in the late Pleistocene (Lewis et al. Citation2021). Below the dune system, there is a large, elongate, regional groundwater mound (Leach Citation2011). Wetlands in the centre of the island and at higher elevation are ‘perched’ or isolated from the regional groundwater mound and are supported by local perched aquifers (e.g. Swallow Lagoon Barr et al. Citation2019), while those closer to the coast including Blue Lake (Barr et al. Citation2013) and Fishermans Wetland intersect the regional aquifer. Rainfall on the island is highly seasonal with a strong autumn and summer maximum (Tibby et al. Citation2017) and with substantial inter-annual variability (Supplemental Material Figure 3).
Fishermans Wetland is a palustrine wetland with extensive emergent macrophyte growth. Its water is typical of regional sand-mass palustrine wetlands, being low in ionic concentration (‘soft’), low in pH (‘acid’), and coloured by dissolved humic substances, but with very low suspended particulate matter concentration. The wetland features a prominent, 1.6 m deep (maximum depth in November 2018), open water feature (approximately 0.25 hectares in 2017; ). It is located as a widening of the drainage line along Fishermans Creek adjacent to the former Yarraman mineral sand mine (). The catchment of Fishermans Creek has been substantially modified by road construction and re-alignment and sand mining activity. Fishermans Road, which is oriented approximately north–south, lies just to the east of the wetland. The ‘Buried Loader’, a small sand mining pit, operated within 200 m north of the present-day Fishermans Wetland during the mid-1970s (Laycock Citation1978). Sand mining at Yarraman Mine from 1999 to 2014 removed an approximately 1 km stretch of the upper part of Fishermans Creek, with the area now occupied by an artificial window lake intersecting the regional aquifer known as Yarraman Void, which was the former mine pond described above. The wetland terminates upstream of Fishermans Road. Water levels in the present day Fishermans Wetland are maintained by an irrigation system operated by the mine lease holders, Sibelco. Operation of the irrigation system commenced in May 2012 (Sibelco, pers. comm.).
Materials and methods
Our investigations focussed on the area of open water (as observed in November 2018) (See d,e). We used palaeolimnology and analysis of maps, aerial photographs and satellite imagery to understand the history of Fishermans Wetland. For the palaeolimnological study we analysed the longest of a series of sediment cores extracted from the wetland for a variety of indicators that reflect historical vegetation of the catchment (pollen and plant macrofossils) and the aquatic ecosystem (sediment organic matter, autotrophic pigments, plant macrofossils and aquatic plant pollen) and fire (micro- and macro-charcoal). Detailed methods are provided in the Supplemental Material.
Selection of key core and dating of the wetland sediment-sand boundary
To determine the thickness of organic sediment deposited beneath open water, 15 locations were probed with a metal pole in August 2017, with the depth of organic sediment indicated in . Organic sediment was identified, based on sediment analysis from 15 Mijnjerribah wetlands (Tibby et al. Citation2017), by its dark brown to black colour and absence of mineral matter. From the 15 probing locations, we targeted the site with the thickest organic sediment accumulation to extract the sediment sequence for this study (core FW18/2). This core was extracted in November 2018, along with cores from seven locations in the wetland. From these, we selected four (d) to identify and date the commencement of organic sedimentation. Cores were extracted using the ‘Bolivia’ modification of the Livingstone coring method from a purpose-built coring platform as described in Cadd et al. (Citation2018). Coring was halted after penetration of between 20 and 40 cm of sands below the organic sediments (as per the approach used in Barr et al. Citation2013; Tibby et al. Citation2017).
Sediment dating
Plant macrofossils were radiocarbon (14C) dated to develop a chronology for the FW 18/2 core record and to provide an age for the commencement of organic wetland sedimentation from this and four other cores. For the FW 18/2 record, six samples were analysed at Beta Analytic laboratories, Miami, Florida.
Bayesian age-depth modelling was conducted in OxCal 4.4.Footnote1. Radiocarbon determinations from the transition from sand to organic sediment at the base of the five cores taken from Fishermans wetland were calibrated and combined using the R_combine function in OxCal. The Bayesian modelling R_combine approach estimates the probability that an event occurred within a certain time window. This is done by combining the probability of the radiocarbon ages occurring within this time window. R_combine then calculates possible chronological intervals where all radiocarbon determinations intersect, with the caveat that the event occurred within this overlapping temporal window.
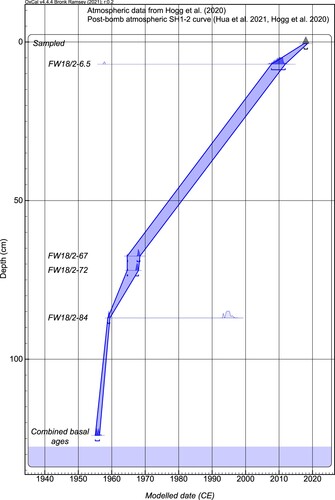
A Bayesian age-depth model for FW 18/2 () was constructed using the results of R_combine function for the five basal ages and the four other radiocarbon age determinations from core FW18/2 using a ‘P_sequence deposition model’ (Bronk Ramsey Citation2008; Bronk Ramsey and Lee Citation2013). The 14C ages were calibrated using the SHCal20 calibration curve (Hogg et al. Citation2020) and postbomb SH zone 1–2 calibration curve (Hua et al. Citation2022; Hogg et al. Citation2020).
Figure 2. Age-depth relationship in the FW18/2 core. The bottom age in the figure is the combination of basal ages from five cores (including FW 18/2).
Sedimentary indicators and interpretive framework
Core FW 18/2 was 135 cm long. Analyses focussed on the upper 125 cm of organic sediment, as the basal 10 cm of the core was composed of sand. Sampling for all sediment indicators was undertaken at five-centimetre increments.
Pollen analysis
Pollen analysis was undertaken to provide a history of terrestrial vegetation in the area around Fishermans Wetland and the wetland’s aquatic vegetation. Pollen deposited in wetlands with a small surface area is likely to be dominated by local vegetation (∼within 2 km), but wind dispersed taxa, in particular Casuarinaceae, may be transported from a broader area (Mariani et al. Citation2016; Cadd et al. Citation2018). Samples were processed using methods outlined in Cadd et al. (Citation2018). Pollen concentrates were mounted in glycerol and pollen grains identified under 400 × magnification. Identification of spore and pollen grains was predominantly restricted to family or genus level using a combination of online, print and reference material. A total of 250 terrestrial pollen grains form the pollen sum and aquatic pollen taxa and spores are expressed as a proportion of total grains. Microcharcoal fragments (10–100 µm) were counted as part of pollen analysis as a proxy for regional fire history.
Plant macrofossils
Plant macrofossils were analysed to document changes in wetland aquatic vegetation based on methods outlined in Cadd et al. (Citation2018). Plant macrofossils (such as leaves, fruits and seeds) in wetlands are mostly deposited within a few to tens of metres from their source plants and hence plant macrofossil records are commonly dominated by aquatic plants (Lewis Citation2012; Tibby and Sayer Citation2017). Plant macrofossil data complement pollen analysis by documenting changes in vegetation underrepresented in pollen data. Macrocharcoal fragments (> 500 µm) were counted as part of the analysis as a proxy for local fire history.
Sedimentary organic matter sources and determination of zones
The concentrations of carbon and nitrogen and the carbon isotope ratio of sediment samples, referred to collectively as the organic matter record, were derived to infer changes in organic matter sources in Fishermans Wetland based on methods outlined in Cadd et al. (Citation2018). The interpretation of the source organic matter in the sediment is underpinned by determinations of carbon and nitrogen concentrations and carbon isotope ratios of modern terrestrial and aquatic plants, algae, and soils on Minjerribah. These data are discussed in Cadd et al. (Citation2018) and Maxon et al. (Citation2021) and, importantly, differ from the ‘typical’ characteristics of organic matter used elsewhere (Meyers and Teranes Citation2001) due to the exceptionally nutrient limited status of sand island ecosystems. Zones in the organic matter record were used as a framework to interpret the history of the wetland. We determined the zones in the organic matter record using constrained incremental sum of squares hierarchical clustering with Euclidean distance (using Constrained Instrumental Sum of Squares - CONISS Grimm Citation1987), implemented in the rioja package (Juggins Citation2023) in R (R Core Team Citation2020). Broken stick analysis determined the number of significant zones in CONISS.
Photosynthetic pigments
Photosynthetic pigments are produced by autotrophic organisms ranging from single celled cyanobacteria and algae to large trees. Pigments such as chlorophyll a are produced by a wide range of organisms, while others are mostly or wholly produced by specific groups of organisms (e.g. echinenone, a cyanobacterial pigment) (Leavitt and Hodgson Citation2002). Changes in the abundance of these photosynthetic pigments in sedimentary records can be used to infer fluctuations of these groups of autotrophic organisms through time. In this study ‘pigments’ is used to refer to pigments and their degradation products.
Pigment analyses were undertaken at the Department of Environment and Science (Queensland) Chemistry Laboratory using High-performance Liquid Chromatography (see Cadd et al. Citation2018, for methods). Analyses were conducted on a Dionex Ultimate 3000 U-HPLC system with a Dionex DAD 3000 diode array detector and chromatograms integrated using Chromeleon 7.2 acquisition software. Pigments were identified using both retention time and absorbance spectra and taxonomic affiliations of pigments were identified following Leavitt and Hodgson (Citation2002) and Roy et al. (Citation2011).
To place changes in the history of the wetland into context, contemporary algae and pigments were also analysed. Algal material was collected from floating mats and scraped from in-lake habitats. A portion of each sample was analysed for pigment composition as above and a portion analysed for its taxonomic composition. For determinations of algal taxonomic composition, material was preserved in situ with two per cent buffered formaldehyde. Sub-samples were mounted on flat slides and observed at 400 × magnification. A total of 300 algal units were identified from each sample and expressed as proportional abundance (Supplementary Table 5).
Historical mapping, aerial photograph and satellite image analysis
Historical survey and topographic maps were assessed to confirm the location, identify changes to, and indicate the pre-development condition of Fishermans Creek and Fishermans Wetland ( and ). Adjacent creeks such as Yarraman Creek were included in this assessment to provide context for observations made regarding Fishermans Creek as the presence of an open water feature on historical maps had been noted by the community. Comparisons of mapped features were made between historical survey maps from 1904 (Lethem, Foster-Barkam, and Brisbane Board of Waterworks Citation1904) (a) and 1972 (b) and a 1971 topographic map (c).
Table 1. Analysis of aerial photographs covering Fishermans Wetland and the surrounding area. * Imagery not shown or described in detail.
Stereoscopic analysis of historical aerial photograph pairs was undertaken for imagery of the Fishermans Creek area to investigate the history and the permanency of Fishermans Wetland. The focus of the analysis was to assess the geomorphological evolution of the present day wetland and the presence of open water. Aerial photograph pairs selected for analysis cover the period from May 1958 to February 2002 () with preference given to photograph pairs with a scale of approximately 1:25,000 due to their superior image resolution. Additional methods, the origins of the map data and results are in the Supplemental Material, along with an analysis of satellite imagery since October 2004.
Results
Sediment stratigraphy, sediment age and chronology
Probing of the sediments identified an area of approximately 300 m2 where more than 1 m of organic sediment has accumulated (approximately ten per cent of current open water), (d). The sediments consisted of highly organic muds, with varying proportions of undecomposed aquatic plant material contributing to the sediment matrix, overlying a sand base typical of the surrounding landscape. Bayesian analysis of radiocarbon ages of the transition to organic sedimentation showed that organic sediment accumulation commenced in the wetland between 1955 and 1956 (95 per cent confidence) (Supplemental Material and Supplemental Figure 3). Sedimentation was rapid from 1955 until the late 1960s, with slower rates since then ().
Three wetland depositional zones have been identified from patterns in the organic matter record (): 1 (1955–1975), 2 (1975–2006) and 3 (2006–2018). The zones defined by organic matter composition also correspond with variability in other sediment components, so we are confident that the three-stage subdivision of the sequence is justified and can be related to environmental change in the area. Notably, none of the zone boundaries corresponded to the commencement of sand mining by the Yarraman Mine in 1999.
Pollen
Microcharcoal was present in all samples and had higher concentrations at the start of Zone 1 and mid-Zone 2. The pollen record was dominated by Eucalyptus with Casuarinaceae, Poaceae and Leptospermum, important sub-dominant taxa (). Leptospermum increased in abundance towards the upper part of the record (Zone 2; from 1975 CE), while at the same time Poaceae decreased. Melaleuca was the dominant taxon in the aquatic pollen spectra, increasing in the late 1960s, with a peak in the early 1980s before a decline in the past decade (Zone 3). Other aquatic taxa exhibited less marked changes, with a reduction in Restionaceae in the upper half of the record most notable.
Figure 3. Pollen analysis data from the FW18/2 core. Note that Melaleuca is classified as an aquatic plant since it is found around open water in Fishermans Wetland. The zones plotted on this diagram were derived from changes in the organic matter record () and shown to facilitate comparison with those data.
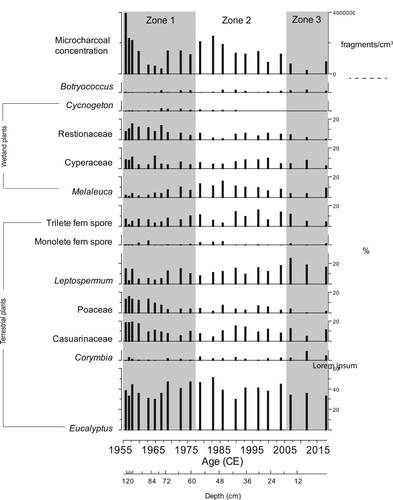
The earliest history of the wetland, Zone 1, is characterised by relatively high levels of Poaceae, Restionaceae and Casuarinaceae. These taxa began to decline from the early 1960s and were largely replaced by an increase in Melaleuca and Leptospermum in the late 1960s.
Plant macrofossils
Large proportions of macrofossil material in the Fishermans Wetland record were preserved through carbonisation by fire. Where seeds were recovered uncharred, they were poorly preserved or highly fragmented.
In Zone 1, there is a distinct assemblage in the basal sample, 120–123 cm (deposited in the mid-1950s), composed of the fern Gleichenia dicarpa and possible fragments of septae from the sedge Lepironia articulata; the only sample where Lepironia is recorded (). Another fern species Gleichenia mendellii replaced G. dicarpa approximately very early in the wetland’s history and became more abundant after this. Other ferns, Pteridium esculentum and Blechnum cf. indicum, are present in lesser amounts. Melaleuca occurred only rarely in the second half of this zone. There is some evidence of heath vegetation with the appearance of Epacris pulchella or microphylla, shrubs characteristic of wallum health together with other terrestrial taxa Eucalyptus spp., Melastoma malabathricum subsp. malabathricum and the herb Gonocarpus chinensis. Macrocharcoal is high, relative to the rest of the record in most samples.
Figure 4. Plant macrofossil and macro charcoal data from the FW18/2 core. Macrofossil type is indicated in parenthesis. The zones plotted on this diagram were derived from changes in the organic matter record () and shown to facilitate comparison with those data.
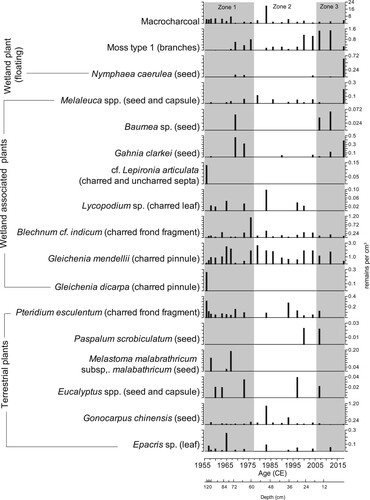
In Zone 2 (1975–2006) there was a reduction in the sedge Gahnia clarkei, introduced Nymphaea caerulea (cape water lily), and the sedge Baumea sp. Gonocarpus chinensis and the ferns G. mendellii, P. esculentum and B. cf. indicum increased after this. Melaleuca presence continued during Zone 2.
In Zone 3 (2006–2018), there was a reappearance of the sedges G. clarkei and Baumea sp and the water lily N. caerulea. Melaleuca was most abundant near the surface of the sediment record.
Sedimentary organic matter sources
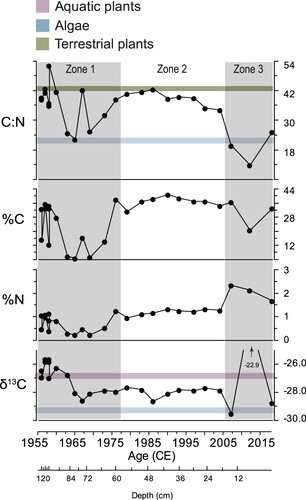
Zone 1 (1955–1975 CE) had the most variable C:N ratios, fluctuating from over 50:1 to less than 25:1 (). The C:N ratios between 1975 and 2000 (Zone 2 and part of Zone 3) show little change and remained close to 40:1, with a marked decline since the early 2000s. These changes are driven by alterations to both the carbon and nitrogen concentrations in the sediments. In Zone 1, carbon and nitrogen concentrations are variable, while they are largely stable in Zone 2 and then exhibit somewhat opposing trends in Zone 3. Sedimentary δ13C is high in sediments deposited before 1960 then declines to relatively stable values for most of the wetland’s existence. In the last decade (represented by three Zone 3 samples), δ13C was variable.
Figure 5. Sediment carbon:nitrogen (C:N), carbon (%C), nitrogen (%N) and carbon isotope (δ13C), data from the FW18/2 core. Also shown are the average values for possible sources of organic matter derived from a survey on North Stradbroke Island/Minjerribah (Cadd et al. Citation2018).
Pigments
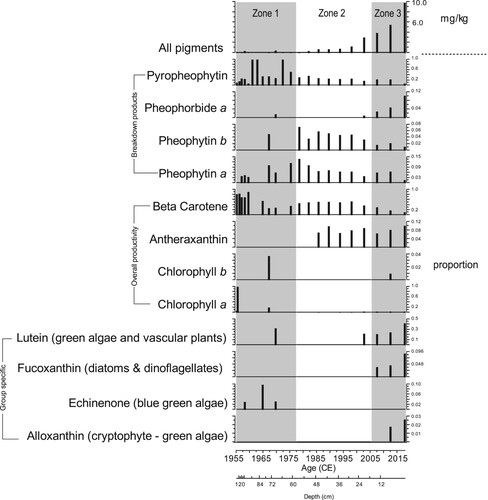
Zone 1 is characterised by the lowest overall pigment concentrations, low to zero concentrations of a number of pigment types and inconsistent representation of others (). Pigments β carotene and pyropheophytin (a pigment degradation product) are most abundant in this zone, with β carotene more abundant than in Zones 2 and 3. Zone 2 (1975–2006 CE) has better representation of pigment types, in particular the Chl a and b degradation products and antheraxanthin. In Zone 3 (2006–2018 CE), the abundance of taxon-specific pigments including alloxanthin, fucoxanthin and lutein are at their highest. In contrast, the abundance of pigments representative of broader groups of autotrophs (e.g. β carotene and pheophytin a and b) is lower.
Figure 6. Pigment data from the FW18/2 core. Individual pigments and degradation products are plotted as a proportion of the total concentration of all pigments. The total concentration of pigments is also shown. The zones plotted on this diagram were derived from changes in the organic matter record () and shown to facilitate comparison with those data.
Mapping and aerial photography analysis
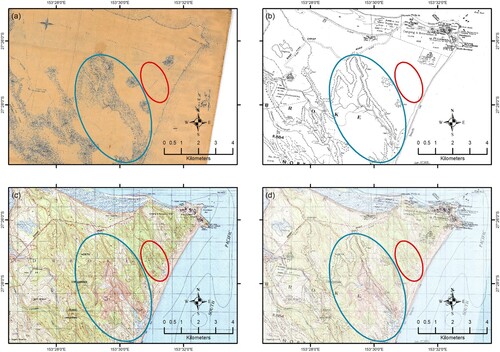
The 1904 and 1972 survey maps and the 1971 topographic map () show the drainage system and associated swamps and lagoons mapped on the two survey maps is Yarraman Creek. Fishermans Creek is not represented on either of the survey maps but is mapped to the northeast of Yarraman Creek on the 1971 map. The 1971 topographic map shows the drainage trace of Fishermans Creek but there is no mapped open water area at the present-day location of this feature in Fishermans Wetland.
Figure 7. Georeferenced and spatially rectified survey and topographic maps of northern North Stradbroke Island showing the Yarraman Creek (blue oval) and Fishermans Creek (red oval) drainage systems. (a) 1904 survey map. (b) 1972 survey map. (c) 1971 topographic map. (d) Overlaid 1971 topographic and 1972 survey maps.
The first aerial photograph (), from May 1958, is the earliest photo-imagery available covering Fishermans Creek and the location of the present-day open water section of Fishermans Wetland. The dune crest (shown in yellow on ) is one of the few features in the region to remain relatively unchanged by construction and mining activities. These changes are summarised in . The northward migration of the dune crest during its active phase (i.e. before the commencement of aerial photography) appears to have deflected the path of Fishermans Creek to the north-east leading to the development of a depression in the landscape. This depression forms the current Fishermans Wetland and is characterised by an absence of trees.
Figure 8. Non-georeferenced 1958 image of the Fishermans Creek drainage system. (a) Raw image from Image QAP0768130 taken on 16 May 1958 (Source: Queensland Image Bank). (b) Duplicate showing the location of the present day Fishermans Wetland, Fishermans Creek (blue), sand dune crest (yellow), and other features. The initial workings at Miethke Quarry (1) and southern access track (2) are observed. The rectangular feature (3) in the bottom right corner of the image is a pond associated with early sand mining activities.
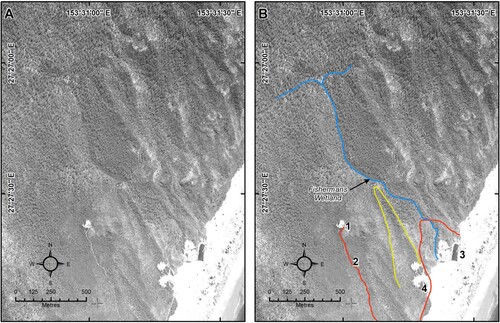
Figure 9. Non-georeferenced 1967 image of the Fishermans Creek drainage system. (a) Raw image from Image QAP1757125 taken on 13 August 1967 (Source: Queensland Image Bank). (b) Duplicate showing the location of the present day Fishermans Wetland, Fishermans Creek (blue), sand dune crest (yellow), and other features. The misshaped, rectangular feature in the bottom right corner of the image is the remnant of the pond (3) noted in the 1958 imagery. Other numbered features are described in .
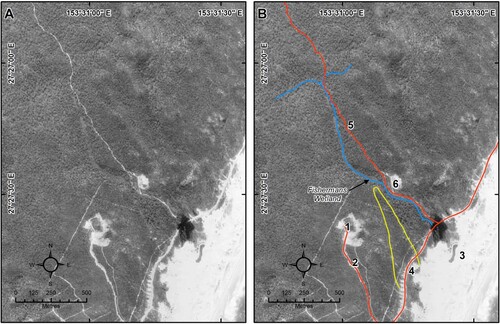
Figure 10. Non-georeferenced 1974 image of the Fishermans Creek drainage system. (a) Raw image from Image QAP29858365 taken on 07 June 1974 (Source: Queensland Image Bank). (b) Duplicate showing the location of the present day Fishermans Wetland, Fishermans Creek (blue), sand dune crest (yellow), and other features. Numbered features are described in .
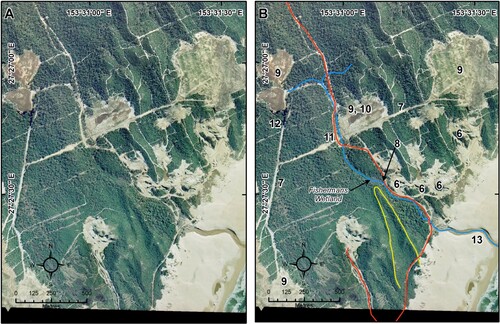
Figure 11. Non-georeferenced 1981 image of the Fishermans Creek drainage system. (a) Raw image from Image QAP3840108 taken on 08 May 1981 (Source: Queensland Image Bank). (b) Duplicate showing the location of the present day Fishermans Wetland, Fishermans Creek (blue), sand dune crest (yellow), and other features. Numbered features are described in .
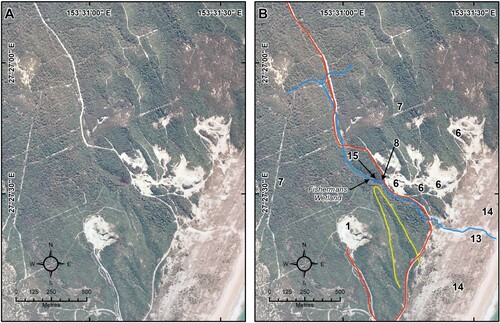
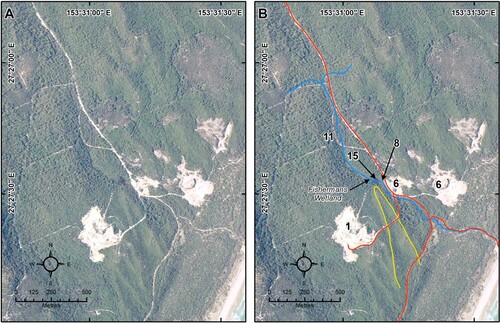
Figure 12. Non-georeferenced 2002 image of the Fishermans Creek drainage system. (a) Raw image from Image QAP5931052 taken on 21 February 2002 (Source: Queensland Image Bank). (b) Duplicate showing the location of the present day Fishermans Wetland, Fishermans Creek (blue), sand dune crest (yellow), and other features. Numbered features are described in .
In Fishermans Creek catchment, construction activities are visible in August 1967 (). In June 1974, the aerial photo clearly shows the commencement of sand mining activities at the ‘Buried Loader’ pit (feature 10 in ) and geomorphological changes following an extreme rainfall event associated with Cyclone Wanda in January 1974. In-washed road material can be seen in a location immediately downstream of the present-day open water feature.
The first clear indication of open water where it is currently located is in the May 1981 aerial photo (, feature 15). Open water areas are present at the very eastern end of the wetland where it also appears that light coloured road material was washed in (). From its first appearance in 1981, the area of open water increased to its approximate present-day extent in 1991 then decreased by approximately 5 ± 1 per cent by 1997. The imagery indicates that more road material washed into and was deposited in the very eastern part of the wetland over this period.
The February 2002 imagery () shows the Fishermans Creek catchment following exploration activity for the Yarraman Mine in the form of a number of parallel south-east to north-west running tracks. In this photograph the open water feature covers an area similar to its present-day extent. Google Earth imagery indicates the wetland was dry in 2004 but that since 2006, open water has persisted at the site (Supplemental Material).
Discussion
Age of the wetland and sediment accumulation
Organic sediment accumulation in Fishermans Wetland commenced in the 1950s. The transition from pre-wetland basal sands to organic wetland sediments in five cores from Fishermans Wetland date to between 1955 and 1956 (Supplementary Figure 3), making it by far the youngest dated Minjerribah wetland (Tibby et al. Citation2017; Maxson et al. Citation2022).
The age-depth relationship for the FW18/2 core indicates that sediments have accumulated since the mid-1950s and that the oldest sediments accumulated particularly rapidly. There is no evidence of a hiatus or change in sediment properties, suggesting the sediments have accumulated continuously. The average sediment accumulation rate at this location is almost 2 cm per year. This rate is higher than the accumulation rates recorded in any other dated Minjerribah wetlands (n = 15), some of which are over 200,000 years old (Kemp et al. Citation2020), with the exception of Eighteen Mile Swamp (Tibby et al. Citation2017; Lewis et al. Citation2021; Kemp et al. Citation2020; Cadd et al. Citation2022). However, organic sediments of this thickness were only found in a very small part of Fishermans Wetland (d), and sedimentation rates determined at other Minjerribah wetlands are the product of net accumulation over centuries to millennia where a variety of processes (e.g. mineralisation, erosion or burning) can remove sediment.
Analysis of indicators extracted from Core FW18/2, in combination with the aerial photographs, historical maps and satellite imagery, indicates that the persistent expanse of open water is a very recent landscape feature, emerging in the past two decades. The recent water level increase contrasts with recent climate-driven drying trends in a range of wetlands locations across Minjerribah (including Swallow Lagoon, Brown Lake, Welsby Lagoon and Fern Gully Lagoon) (Tyler et al. Citation2022). It is possible, therefore, that the open water observed in the wetland is the result of human activity. The precise nature of the relationship between human activity and the development and dynamics of the wetland is not well understood. However, it is possible that the earlier obstruction of the Fishermans Creek drainage line by road construction, in combination with upstream watering of the catchment, resulted in the emergence of this feature. Road crossings can change local rainfall runoff characteristics on sand islands (sensu Waldron and McCallum Citation2021). These changes may have favoured the development of an open water section in a depression where previously there was none. Alternatively, it is possible that Fishermans Wetland represents an example of the natural development of wetlands from time to time.
Variation in wetland and catchment vegetation
The pollen data exhibit relatively minor alterations in dominant terrestrial plants, despite the substantial local landscape alterations noted in the aerial photographs (e.g. ). In terms of the marked shifts in key taxa, the proportion of grasses (Poaceae) declines through the record, with the abundance of tea tree taxa (Melaleuca and Leptospermum) increasing in the mid-1960s. From the mid-1980s, the representation of these taxa generally exhibit opposing trends, with Melaleuca pollen values very low in sediments deposited since 2000 CE. Overall, there is a progressive shift from high Poaceae, Restionaceae and Casuarinaceae to Leptospermum, Eucalyptus and other Myrtaceous taxa, which possibly reflects development of a denser shrub and heath understory and a reduction in open woodland. This may represent the regrowth of vegetation observed in the aerial photography (e.g. ). The earliest time period (1955–1975) with high Poaceae, Restionaceae and Casuarinaceae occurred during a period of elevated microscopic charcoal influx, indicating higher regional fire activity.
The plant macrofossil data indicate an early short-lived phase dominated by Gleichenia dicarpa and possibly Lepironia articulata (). Thereafter, the majority of the record suggests a dense fern understorey compromising Gleichenia mendellii, Pteridium esculentum and Blechnum cf. indicum. Pockets of swampy ground are indicated by herbaceous Gonocarpus chinensis, the shrubs Melastoma malabathricum subsp. Malabathricum and heath components by Epacris sp. Charred plant macrofossils throughout the record indicate local burning, consistent with microcharcoal remains being recorded in all samples. The macrofossil record contains few remains of submerged or floating aquatic plants, with sporadic minor representation of floating Nymphaea caerulea, other than in the uppermost sample where it is abundant.
Evidence for variation in water level and wetland vegetation
The interpretation of the history of the wetland hydrology is mainly derived from the sediment carbon and nitrogen concentrations and the carbon isotope ratio (δ13C) of the organic matter. These measures are relatively immune to the effect of selective degradation and are supported by contemporary studies from the island.
In Zone 1 (1955–1975 CE), the organic matter was derived from a mix of terrestrial and aquatic sources. The high C:N ratio of most Zone 1 samples () indicates a major contribution from terrestrial vegetation. This, in combination with the relatively low concentrations of sediment carbon and nitrogen, indicates that the sediment accumulated during a period of variable water availability. It is unlikely, based on the low concentrations of total nitrogen (N), that there was deep (>0.5 m) open water during this time.
The inferred absence of open water in Zone 1 is supported by low overall pigment concentrations, an absence of taxonomically specific pigments and a dominance of degradation products in most samples. Pigment degradation occurs in environments where pigments are exposed to oxygen and UV light (Leavitt and Hodgson Citation2002), a situation consistent with an absence of deep open water. However, the presence of echinenone could be interpreted as indicating pools of water sufficient to support cyanobacteria. Alternatively, cyanobacteria are common in microbial mats on damp soil on Minjerribah and hence the presence of echinenone is not inconsistent with our interpretation. The lack of open water may explain the absence of any pigments in the 115–117 cm sample. This observation is consistent with the site being intermittently wet but experiencing surface drying. In addition, there is a lack of seed macrofossils preserved in the first half of this zone; only charred remains survived the oxidation events associated with drying. The historical map and aerial photographs are consistent with these observations and reveal no persisting open water. The collection of images indicates that the wetland and its appearance as an open water feature post-dates construction of Fishermans Road (1958–1967) (see and ) and subsequent deposition of material from the road.
In Zone 2 (1975–2006 CE), the organic matter is characterised by consistently elevated sediment carbon concentrations, generally increasing amounts of total nitrogen and largely invariant δ13C. These characteristics indicate that organic matter was derived from a mix of aquatic and terrestrial sources. During this time Melaleuca pollen was at its highest levels, as were some sedimentary pigments (including Pheophytin a and b which are degradation products of Chlorophyll a and b, respectively). We interpret the wetland plant history in Zone 2 as indicative of successional processes that commenced with the formation of the site in the 1950s. In particular, the increased dominance of Melaleuca at the expense of Cyperaceae and Restionaceae probably resulted from the establishment of Melaleuca quinquenervia trees and the competitive exclusion of sedges and rushes from some areas of the wetland. Importantly, Melaleuca quinquenervia cannot germinate under water and thus its expansion in Zone 2 further supports the interpretation of a lack of persistent open water during Zone 2. While there were no prolonged periods of open water, the presence of floating aquatic plant Nymphaea caerulea during the late 1960s to early 1970s (60–68 cm) suggests a temporary increase in water levels.
The aerial photography supports the palaeoecological data, with no evidence of open water in, or prior to, June 1974 (). This observation contrasts with other wetlands on the island such as Swallow Lagoon and Brown Lake which all had larger areas of open surface-water in the mid-1970s which were strong La Niña years (Barr et al. Citation2013). The absence of open water is not due to an inability to detect this feature in aerial photos since other fine scale features can be observed, such as the deposition of sediment from Fishermans Road following Cyclone Wanda in 1974. In the 1974 aerial photograph, there is evidence of higher than present discharge from Fishermans Creek, with a substantial channel cut across the dunes and beach downstream of the wetland. In 1991, the extent of open water reached, and perhaps exceeded, that observed in 2017, although it had shrunk by 1997 (Supplemental Material). In 2002, the expanse of open water was again similar to that in 2017 (c and 12), although Fishermans was devoid of water in October 2004 (Supplemental Material).
The most recent period of the wetland’s history (2006–2018 CE) is characterised by sediments with the highest total nitrogen concentrations (and the lowest C:N ratios). In addition, the majority of the δ13C values are strongly depleted. These results are indicative of a recent shift in the wetland to one with organic sediment dominated by algae. This zone also has the highest concentration of the algal pigments lutein, fucoxanthin and alloxanthin. Fucoxanthin is one of the dominant pigments of the algae which grow on plants in the wetland at present, consistent with the composition of contemporary algal communities (Supplemental Material). The shift towards an increased dominance of algal material in sediment organic matter is consistent with the relatively recent development of permanent areas of open water. This is supported by the maximum representation of Nymphaea caerulea seeds () and the increased preservation of pigments and production of algal-derived organic matter which is also favoured by permanent open water conditions.
The recent advent of permanent water at the core site may have led to the reduced abundance in Melaleuca pollen, consistent with observations of submerged dead Melaleuca trees (d). Melaleuca quinquenervia requires moist surfaces for its seeds to germinate and can survive periodic water logging as it has adventitious roots (Tibby et al. Citation2017). While Melaleuca quinquenervia grows around the fringes of open water at Fishermans Wetland, at the time of coring, young dead M. quinquenervia trees were observed in water approximately 0.5 m deep, and many living trees had adventitious roots formed at or near current water level. This observation suggests that these trees were able to recruit during times of lower water level but had been subsequently drowned by increasing water levels. It may be that artificial watering which commenced in 2012 contributed to the inundation of these Melaleuca trees.
The distinctive sedimentary total nitrogen and δ13C values in Zone 3 also suggest that there are not equivalent persistent periods of open water in the history of the wetland (despite some indication of a short-lived open water phase in the 1970s from the representation of Nymphaea). This is despite the fact that there have been considerably wetter than present climates in the period since the mid–1950s (Supplemental Material). This conclusion is consistent with the observations made from analysis of aerial photographs, maps and satellite imagery (Supplemental Material).
Potential broader application of this approach
The results of our study have relevance to the post-mining rehabilitation of Yarraman mine, which includes specific requirements for both Fishermans Wetland hydrology and local terrestrial vegetation communities. For vegetation all native tree species and at least 75 per cent understory plants from equivalent unmined reference communities must be returned at specific cover and densities relevant to reference communities (Department of Environment and Science Citation2019a). Our results show that over a time scale of decades there has been variability in local vegetation communities at the wetland, suggesting that targets derived based on a single time-point could be misleading.
Rehabilitation requirements for Fishermans Wetland hydrology specify that there must be no statistical difference in its water level over at least 10 years between pre-mining and post-mining periods unless this variation is not due to the mining activity (Department of Environment and Science Citation2019a). Our results indicate the evolution of Fishermans Wetland and its water level occurred independent of mining activity. It is possible that the artificial watering of Fishermans Wetland during, and following, mining has in fact artificially stabilised water levels due to a mistaken belief it is an ancient and permanent wetland. Based on this history, it seems logical to cease watering and consider any subsequent water depth variability not due to mining. This provides a clear example of how insights from paleoenvironmental and historical studies can inform rehabilitation targets.
Studies such as this could be usefully implemented at a range of mine sites in Australia and overseas where the nature and extent of historical mine impacts are not understood, or are contested. These include The Rum Jungle and Ranger Uranium mines, Northern Territory (Mudd and Patterson Citation2010; Hart et al. Citation2015); The Mt Lyell mine, Tasmania (Tyler Mehler et al. Citation2019); the Thirlmere Lakes, New South Wales (Banerjee, Raval, and Timms Citation2016) and the Kutubu oil fields, Ok Tedi and others in Papua New Guinea (Schneider et al. Citation2016; Mudd et al. Citation2020). Such an approach is particularly useful in context of the new Queensland legislation where a progressive rehabilitation and closure plan for mines can be retrospectively applied (Queensland Government Citation2019). In studies such as this, aerial photographs and maps provide both precise and detailed information at specific time slices, while sediment analysis can provide contiguous information about wetland history for much longer time periods. Hence, the complementary use of these tools can be invaluable. In many settings alterations to water quality are a focus of impact assessment and in such cases analysis of sedimentary diatoms which reflect water quality parameters such as pH, salinity and nutrient status (Reid et al. Citation1995) may be particularly valuable.
Conclusions
Investigation of the age and nature of sediments extracted from Fishermans Wetland, Minjerribah, in combination with analysis of historical maps, aerial photos and satellite imagery, has provided new information about the age and history of the wetland. These insights indicate that Fishermans Wetland is a recent landscape feature, forming in the mid-1950s. Radiocarbon dates of the transition from underlying dune sand to organic wetland sediment from multiple locations indicate that it is less than 70 years old. The recent history of this wetland contrasts with the presence of a number of ancient Minjerribah wetlands. Moreover, probing the sediments identified only a small area where organic sediments greater than 1 m in thickness had accumulated. The contrast between the age of Fishermans Wetland and other Minjerribah wetlands raises the possibility that the former’s origin is anthropogenic. Importantly, the emergence of the wetland in the 1950s pre-dates the 1999 commencement of the Yarraman Mine mineral sand mining operation.
The aim of this study was to identify whether activities from the neighbouring Yarraman Mine have been detrimental to the ecology and hydrology of Fishermans Wetland. There is no evidence that Yarraman Mine operations impacted water quality in Fishermans Wetland, although upstream watering of the wetland’s catchment may have contributed to the maintenance of an artificially permanent water body.
Fishermans Wetland Supplemental material revised.docx
Download MS Word (346.3 KB)Acknowledgements
We thank Troy Sincock for assistance in the field. Pigment analyses were undertaken by Fred Oudyn. Sedimentary carbon and nitrogen analyses were undertaken by Kristine Nielsen and Tony Hall. Queensland Herbarium assisted with plant macrofossil identifications by providing reference photographs
Disclosure statement
No potential conflict of interest was reported by the author(s).
Notes
References
- Banerjee, B. P., S. Raval, and W. Timms. 2016. “Evaluation of Rainfall and Wetland Water Area Variability at Thirlmere Lakes Using Landsat Time-Series Data.” International Journal of Environmental Science and Technology 13 (7): 1781–1792. https://doi.org/10.1007/s13762-016-1018-z.
- Barr, C., J. Tibby, M. J. Leng, J. J. Tyler, A. C. G. Henderson, J. T. Overpeck, G. L. Simpson, et al. 2019. “Holocene El Niño–Southern Oscillation Variability Reflected in Subtropical Australian Precipitation.” Scientific Reports 9 (1): 1627. https://doi.org/10.1038/s41598-019-38626-3.
- Barr, C., J. Tibby, J. C. Marshall, G. B. McGregor, P. T. Moss, G. P. Halverson, and J. Fluin. 2013. “Combining Monitoring, Models and Palaeolimnology to Assess Ecosystem Response to Environmental Change at Monthly to Millennial Timescales: The Stability of Blue Lake, North Stradbroke Island, Australia.” Freshwater Biology 58 (8): 1614–1630. https://doi.org/10.1111/fwb.12154.
- Barr, C., J. Tibby, P. T. Moss, G. P. Halverson, J. C. Marshall, G. B. McGregor, and E. Stirling. 2017. “A 25,000-Year Record of Environmental Change from Welsby Lagoon, North Stradbroke Island, in the Australian Subtropics.” Quaternary International 449: 106–118. https://doi.org/10.1016/j.quaint.2017.04.011.
- Beck, K. K., M. Mariani, M. S. Fletcher, L. Schneider, M. A. Aquino-López, P. S. Gadd, H. Heijnis, K. M. Saunders, and A. Zawadzki. 2020. “The Impacts of Intensive Mining on Terrestrial and Aquatic Ecosystems: A Case of Sediment Pollution and Calcium Decline in Cool Temperate Tasmania, Australia.” Environmental Pollution 265: 114695. https://doi.org/10.1016/j.envpol.2020.114695.
- Bice, S. 2014. “What Gives you a Social Licence? An Exploration of the Social Licence to Operate in the Australian Mining Industry.” Resources 3 (1): 62–80. https://doi.org/10.3390/resources3010062.
- Bond, C., and L. Kelly. 2021. “Returning Land to Country: Indigenous Engagement in Mined Land Closure and Rehabilitation.” Australian Journal of Management 46 (1): 174–192. https://doi.org/10.1177/0312896220919136.
- Bronk Ramsey, C. 2008. “Deposition Models for Chronological Records.” Quaternary Science Reviews 27 (1-2): 42–60. https://doi.org/10.1016/j.quascirev.2007.01.019.
- Bronk Ramsey, C., and S. Lee. 2013. “Recent and Planned Developments of the Program OxCal.” Radiocarbon 55 (2): 720–730. https://doi.org/10.1017/S0033822200057878.
- Cadd, H., B. Sherborne-Higgins, L. Becerra-Valdivia, J. Tibby, C. Barr, M. Forbes, T. J. Cohen, et al. 2022. “The Application of Pollen Radiocarbon Dating and Bayesian age-Depth Modeling for Developing Robust Geochronological Frameworks of Wetland Archives.” Radiocarbon 64 (2): 213–235. https://doi.org/10.1017/RDC.2022.29.
- Cadd, H. R., J. Tibby, C. Barr, J. Tyler, L. Unger, M. J. Leng, J. C. Marshall, et al. 2018. “Development of a Southern Hemisphere Subtropical Wetland (Welsby Lagoon, South-East Queensland, Australia) Through the Last Glacial Cycle.” Quaternary Science Reviews 202: 53–65. https://doi.org/10.1016/j.quascirev.2018.09.010.
- Chang, J. C., J. Shulmeister, C. Woodward, L. Steinberger, J. Tibby, and C. Barr. 2015. “A Chironomid-Inferred Summer Temperature Reconstruction from Subtropical Australia During the Last Glacial Maximum (LGM) and the Last Deglaciation.” Quaternary Science Reviews 122: 282–292. https://doi.org/10.1016/j.quascirev.2015.06.006.
- Costanza, R., R. D'Arge, R. De Groot, S. Farber, M. Grasso, B. Hannon, K. Limburg, et al. 1997. “The Value of the World's Ecosystem Services and Natural Capital.” Nature 387 (6630): 253–260. https://doi.org/10.1038/387253a0.
- Cristescu, R. H., C. Frère, and P. B. Banks. 2012. “A Review of Fauna in Mine Rehabilitation in Australia: Current State and Future Directions.” Biological Conservation 149 (1): 60–72. https://doi.org/10.1016/j.biocon.2012.02.003.
- Department of Environment and Science. 2019a. “Environmental Authority EPML00575913.” In. Queensland: Department of Environment and Science.
- Department of Environment and Science. 2019b. “Investigations into Potential Impacts of Yarraman Mine on Fishermans Wetland.” In. Brisbane: Queensland Department of Environment and Science.
- Getty, R., and A. Morrison-Saunders. 2020. “Evaluating the Effectiveness of Integrating the Environmental Impact Assessment and Mine Closure Planning Processes.” Environmental Impact Assessment Review 82: 106366–1063669. https://doi.org/10.1016/j.eiar.2020.106366.
- Grimm, E. C. 1987. “CONISS: A FORTRAN 77 Program for Stratigraphically Constrained Cluster Analysis by the Method of Incremental sum of Squares.” Computers and Geosciences 13 (1): 13–35. https://doi.org/10.1016/0098-3004(87)90022-7.
- Hart, B. T., M. Taylor, M. Iles, G. Kyle, and G. Sinclair. 2015. “Resolving Long-Term Issues Related to Surface Water Management and Monitoring Associated with the Ranger Uranium Mine, Northern Territory, Australia.” Australasian Journal of Environmental Management 22 (4): 417–431. https://doi.org/10.1080/14486563.2015.1028487.
- Hogg, A. G., T. J. Heaton, Q. Hua, J. G. Palmer, C. S. M. Turney, J. Southon, A. Bayliss, et al. 2020. “SHCal20 Southern Hemisphere Calibration, 0–55,000 Years cal BP.” Radiocarbon 62 (4): 759–778. https://doi.org/10.1017/RDC.2020.59.
- Hua, Q., J. C. Turnbull, G. M. Santos, A. Z. Rakowski, S. Ancapichún, R. De Pol-Holz, S. Hammer, et al. 2022. “Atmospheric Radiocarbon for the Period 1950–2019.” Radiocarbon 64 (4): 723–745. https://doi.org/10.1017/RDC.2021.95.
- Juggins, S. 2023. “Rioja: Analysis of Quaternary science data.” http://cran.r-project.org/package=rioja.
- Junk, W. J., M. Brown, I. C. Campbell, M. Finlayson, B. Gopal, L. Ramberg, and B. G. Warner. 2006. “The Comparative Biodiversity of Seven Globally Important Wetlands: A Synthesis.” Aquatic Sciences (AS) 68 (3): 400–414. https://doi.org/10.1007/s00027-006-0856-z.
- Kemp, C. W., J. Tibby, L. J. Arnold, C. Barr, P. S. Gadd, J. C. Marshall, G. B. McGregor, and G. E. Jacobsen. 2020. “Climates of the Last Three Interglacials in Subtropical Eastern Australia Inferred from Wetland Sediment Geochemistry.” Palaeogeography, Palaeoclimatology, Palaeoecology 538: 109463. https://doi.org/10.1016/j.palaeo.2019.109463.
- Khanal, M., and J. H. Hodgkinson. 2021. “Subsidence Prediction Versus Observation in Australia: A Short Comment.” Environmental Impact Assessment Review 86: 106479. https://doi.org/10.1016/j.eiar.2020.106479.
- Lamb, D., P. D. Erskine, and A. Fletcher. 2015. “Widening gap Between Expectations and Practice in Australian Minesite Rehabilitation.” Ecological Management and Restoration 16 (3): 186–195. https://doi.org/10.1111/emr.12179.
- Laurence, D. 2021. “The Devolution of the Social Licence to Operate in the Australian Mining Industry.” Extractive Industries and Society 8 (2): 100742. https://doi.org/10.1016/j.exis.2020.05.021.
- Laycock, J. W. 1978. “North Stradbroke Island.” Papers of the Department of Geology, University of Queensland 8 (2): 59–96.
- Leach, L. M. 2011. “Hydrological and Physical Setting of North Stradbroke Island.” The Proceedings of the Royal Society of Queensland 117: 21–46. https://doi.org/10.5962/p.357745.
- Leavitt, P. R., and D. A. Hodgson. 2002. “Sedimentary Pigments.” In Tracking Environmental Change Using Lake Sediments. Volume 3: Terrestrial, Algal, and Siliceous Indicators, edited by J. P. Smol, H. J. Birks, and W. M. Last, 295–325. Dordrecht: Kluwer AcademicPublishers.
- Lechner, A. M., O. Kassulke, and C. Unger. 2016. “Spatial Assessment of Open cut Coal Mining Progressive Rehabilitation to Support the Monitoring of Rehabilitation Liabilities.” Resources Policy 50: 234–243. https://doi.org/10.1016/j.resourpol.2016.10.009.
- Lethem, H. M., M. G. Foster-Barkam, and Brisbane Board of Waterworks. 1904. Stradbroke Island Survey Feature Map. Queensland: Survey Office, Department of Public Lands.
- Lewis, T. M. 2012. “A Plant Macrofossil Identification Tool for South-West Victoria.” The Artefact 35: 88–98.
- Lewis, R. J., J. Tibby, L. J. Arnold, P. Gadd, G. Jacobsen, C. Barr, P. M. Negus, et al. 2021. “Patterns of Aeolian Deposition in Subtropical Australia Through the Last Glacial and Deglacial Periods.” Quaternary Research 102 (102): 1–23. https://doi.org/10.1017/qua.2020.117.
- Manero, A., M. Kragt, R. Standish, B. Miller, D. Jasper, G. Boggs, and R. Young. 2020. “A Framework for Developing Completion Criteria for Mine Closure and Rehabilitation.” Journal of Environmental Management 273: 111078. https://doi.org/10.1016/j.jenvman.2020.111078.
- Mariani, M., S. E. Connor, M. Theuerkauf, P. Kuneš, and M. S. Fletcher. 2016. “Testing Quantitative Pollen Dispersal Models in Animal-Pollinated Vegetation Mosaics: An Example from Temperate Tasmania, Australia.” Quaternary Science Reviews 154: 214–225. https://doi.org/10.1016/j.quascirev.2016.10.020.
- Marshall, J. C., P. Negus, A. L. Steward, and G. McGregor. 2011. “Distributions of the Freshwater Fish and Aquatic Macroinvertebrates of North Stradbroke Island are Diferentially Influenced by Landscape History, Marine Connectivity and Habitat Preference.” The Proceedings of the Royal Society of Queensland 117: 239–260. https://doi.org/10.5962/p.357757.
- Maxson, C., J. Tibby, C. Barr, J. Tyler, M. Leng, B. Lomax, J. Marshall, et al. 2022. “Ecology and Climate Sensitivity of a Groundwater-fed Lake on Subtropical North Stradbroke Island (Minjerribah), Queensland, Australia Over the Last 7500 Years.” Journal of Paleolimnology 67 (1): 75–93. https://doi.org/10.1007/s10933-021-00222-9.
- Maxson, C., J. Tibby, J. Marshall, M. Kent, J. Tyler, C. Barr, G. McGregor, et al. 2021. “Fourier Transform Infrared Spectroscopy as a Tracer of Organic Matter Sources in Lake Sediments.” Palaeogeography, Palaeoclimatology, Palaeoecology 581: 110622. https://doi.org/10.1016/j.palaeo.2021.110622.
- Mettam, P., J. Tibby, C. Barr, and J. C. Marshall. 2011. “Development of Eighteen Mile Swamp, North Stradbroke Island: A Palaeolimnological Study” The Proceedings of the Royal Society of Queensland 117: 119–131. https://doi.org/10.5962/p.357750.
- Meyers, P. A., and J. L. Teranes. 2001. “Sediment Organic Matter.” In Tracking Environmental Change Using Lake Sediments. Voume 2: Physical and Geochemical Methods, edited by W. M. Last, and J. P. Smol, 239–269. Dordrecht: Kluwer Academic Publishers.
- Morgan, Richard K. 2012. “Environmental Impact Assessment: The State of the art.” Impact Assessment and Project Appraisal 30 (1): 5–14. https://doi.org/10.1080/14615517.2012.661557.
- Moss, P. T., J. Tibby, L. Petherick, H. McGowan, and C. Barr. 2013. “Late Quaternary Vegetation History of North Stradbroke Island, Queensland, Eastern Australia.” Quaternary Science Reviews 74: 257–272. https://doi.org/10.1016/j.quascirev.2013.02.019.
- Mudd, G. M., and J. Patterson. 2010. “Continuing Pollution from the Rum Jungle U-Cu Project: A Critical Evaluation of Environmental Monitoring and Rehabilitation.” Environmental Pollution 158 (5): 1252–1260. https://doi.org/10.1016/j.envpol.2010.01.017.
- Mudd, G. M., C. Roche, S. A. Northey, S. M. Jowitt, and G. Gamato. 2020. “Mining in Papua New Guinea: A Complex Story of Trends, Impacts and Governance.” Science of The Total Environment 741: 1252–1260. https://doi.org/10.1016/j.scitotenv.2020.140375.
- Queensland Government. 2019. “Mineral and Energy Resources (Financial Provisioning) Act 2018.”
- Queensland Government. 2022. “North Stradbroke Island Protection and Sustainability Act 2011.”
- R Core Team. 2020. “R: A Language and Environment for Statistical Computing.” In Vienna, Austria: Foundation for Statistical Computing.
- Reid, M. A., J. C. Tibby, D. Penny, and P. A. Gell. 1995. “The use of Diatoms to Assess Past and Present Water Quality.” Australian Journal of Ecology 20 (1): 57–64. https://doi.org/10.1111/j.1442-9993.1995.tb00522.x.
- Rott, E., H. Kling, and G. McGregor. 2006. “Studies on the Diatom Urosolenia Round & Crawford (Rhizosoleniophycideae) Part 1. New and Re-Classified Species from Subtropical and Tropical Freshwaters.” Diatom Research 21 (1): 105–124. https://doi.org/10.1080/0269249X.2006.9705655.
- Roy, S., C. Llewellyn, E. S. Egeland, and G. Johnsen. 2011. Phytoplankton Pigments: Characterization, Chemotaxonomy and Applications in Oceanography, Cambridge Environmental Chemistry Series. Cambridge: Cambridge University Press.
- Schneider, L., S. G. Haberle, W. A. Maher, F. Krikowa, A. Zawadzki, and H. Heijnis. 2016. “History of Human Impact on Lake Kutubu, Papua New Guinea: The Geochemical Signatures of oil and gas Mining Activities in Sediments.” Chemosphere 148: 369–379. https://doi.org/10.1016/j.chemosphere.2015.12.086.
- Tibby, J., C. Barr, J. C. Marshall, G. B. McGregor, P. T. Moss, L. J. Arnold, T. J. Page, et al. 2017. “Persistence of Wetlands on North Stradbroke Island (South-East Queensland, Australia) During the Last Glacial Cycle: Implications for Quaternary Science and Biogeography.” Journal of Quaternary Science 32 (6): 770–781. https://doi.org/10.1002/jqs.2981.
- Tibby, J., and C. D. Sayer. 2017. “Inferring Environmental Change in Estuaries from Plant Macrofossils.” In Applications of Paleoenvironmental Techniques to Estuarine Systems, edited by K. Weckström, K. Saunders, P. Gell, and C. G. Skilbeck, 423–440. Berlin/Heidelberg/New York: Springer.
- Tyler, J. J., J. C. Marshall, C. Schulz, C. Barr, H. Hofmann, J. J. Blessing, K. McCoy, G. B. McGregor, and J. Tibby. 2022. “Hydrological and Isotopic Variability of Perched Wetlands on North Stradbroke Island (Minjerribah), Australia: Implications for Understanding the Effects of Past and Future Climate Change.” Frontiers in Environmental Science 10, https://doi.org/10.3389/fenvs.2022.868114.
- Tyler Mehler, W., B. Gagliardi, M. J. Keough, and V. Pettigrove. 2019. “Evaluating Freshwater Mining Sediment Toxicity in Tasmania: Achieving Strong Multiple Lines of Evidence.” Science of the Total Environment 651: 1243–1252. https://doi.org/10.1016/j.scitotenv.2018.09.245.
- Unger, C. J., J. A. Everingham, and C. J. Bond. 2020. “Transition or Transformation: Shifting Priorities and Stakeholders in Australian Mined Land Rehabilitation and Closure.” Australasian Journal of Environmental Management 27 (1): 84–113. https://doi.org/10.1080/14486563.2020.1719440.
- Vivoda, V., D. Kemp, and J. Owen. 2019. “Regulating the Social Aspects of Mine Closure in Three Australian States.” Journal of Energy and Natural Resources Law 37 (4): 405–424. https://doi.org/10.1080/02646811.2019.1608030.
- Waldron, R. P., and A. B. McCallum. 2021. “A Review of Road Infrastructure Development and Contemporary Degradation on K’gari-Fraser Island.” Australasian Journal of Environmental Management 28 (2): 104–125. https://doi.org/10.1080/14486563.2021.1918586.
- Walsh, B., S. van der Plank, and P. Behrens. 2017. “The Effect of Community Consultation on Perceptions of a Proposed Mine: A Case Study from Southeast Australia.” Resources Policy 51: 163–171. https://doi.org/10.1016/j.resourpol.2016.12.006.
- Werner, T. T., P. M. Bach, M. Yellishetty, F. Amirpoorsaeed, S. Walsh, A. Miller, M. Roach, et al. 2020. “A Geospatial Database for Effective Mine Rehabilitation in Australia.” Minerals 10 (9): 1–21. https://doi.org/10.3390/MIN10090745.