
 ?Mathematical formulae have been encoded as MathML and are displayed in this HTML version using MathJax in order to improve their display. Uncheck the box to turn MathJax off. This feature requires Javascript. Click on a formula to zoom.
ABSTRACT
Hemp-based construction materials have increasingly captured attention in recent years as viable alternatives to carbon-intensive materials. A benefit of using hemp (Cannabis sativa L) in construction is its ability to sequester carbon dioxide during plant growth, thereby providing the potential to create carbon-negative materials. However, hemp production can contribute to other environmental impacts such as acidification and eutrophication. Additionally, hemp-based materials usually involve higher costs compared to traditional materials. This study presented an application of an eco-efficiency framework to explore options for improving the environmental and economic performance of non-load-bearing hemp-based construction boards at the production stage in Australia. The study integrated environmental life cycle assessment, multi-criteria analysis, environmental mitigation strategies, life cycle costing and eco-efficiency portfolio analysis in order to identify eco-efficiency improvement opportunities for non-structural hemp-based construction boards and to compare them with conventional alternatives. The analysis showed that the use of solar electricity during the post-farm stage of hemp-based board production can reduce their environmental impact by 26 per cent and production costs by 0.4 per cent. The proposed framework can assist hemp growers and hemp-based composite manufacturers in Australia in developing cost-effective environmental mitigation strategies to assist sustainability in the construction sector.
1. Introduction
The Australian building and construction sector is a major driver of the nation's economy with a workforce of around 1.2 million people contributing to 7.3 per cent to the gross domestic product (RBA Citation2023; Shooshtarian et al. Citation2023). Despite its importance, this sector faces widespread criticism for practices that have adverse effects on the environment, economy and society across the lifetime of buildings, i.e. resource extraction, material production, construction, operation, demolition and end-of-life of waste production (Rivas-Aybar, John, and Biswas Citation2023a).
The development of sustainable buildings and building materials begins at the early stages of their life cycle, necessitating the use of life cycle assessments for decision-making (Backes and Traverso Citation2021). Life cycle assessment tools are useful in estimating environmental, economic and social impacts, jointly known as triple bottom line objectives, for the sustainability assessment of building products (Dong, Ng, and Liu Citation2023). Environmental life cycle assessment (ELCA) is widely employed to evaluate environmental impacts over a product's lifetime, in order to compare the performance of different products and to identify improvement opportunities (Abdalla et al. Citation2021; Satola et al. Citation2021). Whilst ELCA initial focus was on the evaluation of global warming potential (Cabeza et al. Citation2014), ELCAs have expanded to incorporate more impact categories deemed relevant in the construction realm, including land use, acidification, eutrophication, ozone depletion, biodiversity impacts and water use (CEN Citation2019). Life cycle costing (LCC) assesses the economic viability (Xie, Cui, and Li Citation2022) and social life cycle assessment evaluates positive and negative social impacts of a product during its life cycle (Huertas-Valdivia et al. Citation2020).
As highlighted in numerous ELCA-based studies, plant-based materials hold promise for mitigating resource depletion and environmental degradation in the construction sector (Rivas-Aybar, John, and Biswas Citation2023a). Among various plants suitable for construction, industrial hemp (Cannabis sativa L.) stands out due to its high carbon dioxide sequestration ability, rapid growth cycles, adaptability to various climatic and soil conditions, and hygrothermal and acoustic properties (Mouton, Allacker, and Röck Citation2023; Ntimugura et al. Citation2021). In Australia, hemp-based building materials exhibit considerably lower greenhouse gas emissions compared to their traditional counterparts and can help to achieve Australia’s emission targets (Rivas-Aybar, John, and Biswas Citation2023b). However, there are still uncertainties in mitigating other environmental impacts caused by construction activities such as land use changes, eco-toxicity and eutrophication (Ingrao et al. Citation2018). These impacts are further compounded by potential economic challenges due to the higher costs of plant-based materials compared with traditional materials (Soonsawad, Martinez, and Schandl Citation2022).
The choice of construction material is not solely driven by environmental performance but is ultimately based on costs (Colli, Bataille, and Antczak Citation2020; Yang and Yue Citation2021). As such, the LCC methodology is increasingly being combined with ELCA to conduct economic and environmental assessments of emerging building materials in a manner that mirrors the concept of eco-efficiency (Zhang and Biswas Citation2021). Eco-efficiency (EE) aims to provide competitively priced products that minimise ecological impacts and resource intensity across their lifecycle (Verfaillie Citation2000). Therefore, EE can aid in the selection of building materials optimising environmental performance at the lowest possible cost (Dynan et al. Citation2023). EE evaluations have also been conducted by manufacturers in the early stages of product development to provide a choice for the most eco-efficient product alternative (Grosse-Sommer et al. Citation2020). This has been the case for the German firm BASF, which developed an EE toolbox gaining popularity across various industrial sectors, including construction (Heijungs Citation2022). Arceo, Biswas, and John (Citation2019) proposed an enhanced version of the BASF tool to generate product alternatives that incorporate EE strategies at the design stage.
Incorporating economic and environmental impacts in the EE framework can provide a better understanding of sustainability challenges for construction materials (Gundes Citation2016; Hollberg and Ruth Citation2016). However, it is worth noting that the EE method lacks the incorporation of the social pillar of sustainability. This exclusion is recognised as a limitation since building materials deemed cost-competitive and environmentally friendly may result in unfavourable social consequences, including increased health and safety risks, job losses and human rights issues (Rivas-Aybar, John, and Biswas Citation2023a).
Despite this limitation, an increasing number of studies have applied the EE framework to evaluate the sustainability of alternative solutions such as the use of hemp biomass in construction. Dickson and Pavía (Citation2021) compared the energy, environmental and cost performance of 21 different insulation materials in Ireland that exhibited the same thermal performance including hemp-based alternatives. The study reported that bio-based materials such as cellulose, recycled cotton, sheep wool and cork board as well as conventional alternatives including rock wool, phenolic foam, glass mineral wool, aerogel and polyisocyanurate board showed better performance than hemp-based materials. In a more comprehensive application of the EE framework, Colli, Bataille, and Antczak (Citation2020) compared the EE performance of six different thermal insulation materials over their life cycle in France. These materials included glass wool, hemp concrete, cellulose fibre, expanded polystyrene insulation, extruded polystyrene insulation and polyurethane. The study suggested that hemp concrete offered the most favourable environmental performance. In contrast, hemp-based materials presented the least favourable economic performance due to its higher cost. As a result, hemp concrete was not considered an eco-efficient material in comparison to the other alternatives.
It appears that the previous research has applied the EE tool to help select the most eco-efficient option amongst various commercially available building materials, including those derived from hemp. However, no study has yet applied the EE framework to enhance the EE performance of hemp-based materials at the design stage. Such a framework could help find strategies for improving the environmental performance whilst balancing cost performance. The goal of this study is to address this gap by integrating ELCA, multi-criteria analysis, environmental mitigation strategies, LCC and EE portfolio analysis to help identify EE improvement opportunities for hemp-based materials at the design stage. This research assesses novel non-structural hemp-based boards using this methodology and propose strategies to improve hemp-board EE performance in comparison to other conventional alternatives available in the Australian market such as gypsum plasterboards.
2. Materials and methods
2.1. Eco-efficiency framework
The EE concept has been advocated by the World Business Council for Sustainable Development since 1992 (Belucio et al. Citation2021). In this time, EE has gained recognition as a strategy for sustainability progress in the manufacturing sector (Grosse-Sommer et al. Citation2020). The prefix ‘eco’ in EE encompasses both economic and ecological considerations (Yin et al. Citation2014). EE does not contemplate the social dimension of sustainability, a characteristic that has been identified as a limitation of this approach (Rivas-Aybar, John, and Biswas Citation2023a). The significance of EE, however, lies in its capacity to integrate the other two pillars of sustainability, environmental and economic (Ehrenfeld Citation2004).
The EE concept recognises that improved environmental outcomes can involve extra costs and reducing costs may be associated with an increase in environmental burdens (Zhang and Biswas Citation2021). Elaborating on this, the EE framework has been operationalised using the ELCA and LCC methodologies, where both are conducted for the same functional unit and system boundary (Saling et al. Citation2002).
The calculation of EE involves a number of steps, including the normalisation of ELCA and LCC of alternative products to enable comparisons between them (Kicherer et al. Citation2007). A weighting approach is also necessary during the ELCA in order to take into account the level of importance of different environmental impacts and to obtain a single environmental score for each alternative product (Biswas and John Citation2023).
Under the EE framework, the environmental and economic impact results of each product alternative are converted to ordered pairs as displayed in (Kicherer et al. Citation2007). The vertical axis represents normalised environmental impacts whereas the horizontal axis presents normalised costs.
Figure 1. The eco-efficiency portfolio (Grosse-Sommer et al. Citation2020).
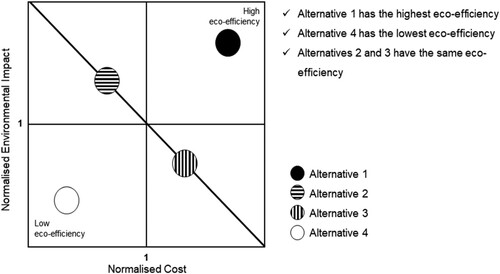
The visual portfolio plot simplifies the ranking of different product alternatives based on their relative EE performance, aiding decision-making (Grosse-Sommer et al. Citation2020). Eco-efficient options are above or on the diagonal line, also known as the EE line, with distance from it indicating EE. The highest EE corresponds to the greatest distance above the line, while options below it are considered not eco-efficient, potentially having higher environmental impacts or costs. A more detailed description of the EE portfolio structure can be found in Kicherer et al. (Citation2007). is instrumental in directing the selection of eco-efficient hemp-based board alternatives and the alternative with the highest EE.
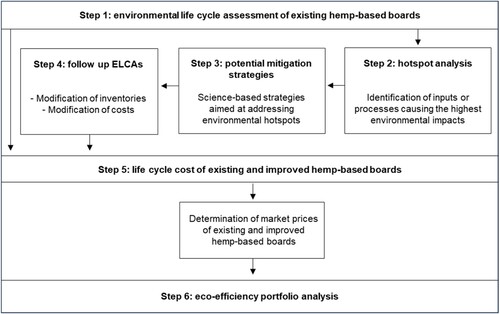
A drawback of the EE framework is its lack of ability to simultaneously enhance both the economic and environmental aspects of a product through EE strategies (Arceo, Biswas, and John Citation2019). To address this, Arceo, Biswas, and John (Citation2019) improved the EE tool by adding a mechanism for integrating appropriate EE strategies within the ‘existing’ version of the product resulting in different ‘improved’ alternatives. The current study follows the modified version of the EE tool which is applied to incorporate the changes in the life cycle impact assessment stage of the ELCA and LCC results associated with potential mitigation strategies in the development of hemp-based boards. The novelty of the present study is that it includes a procedure to compare the ‘existing’ and ‘improved’ alternatives of hemp-based products with traditional commercially available alternatives, i.e. gypsum plasterboards from the EE perspective. displays the methodology used for the present study.
Figure 2. Flow diagram for eco-efficiency analysis (modified from Arceo, Biswas, and John Citation2019).
It is worth noting that an EE framework provides a comparative analysis for the selection of the best option amongst different alternatives but not absolute values (Saling et al. Citation2002). The EE strategies identified in this case study are region specific, potentially lacking applicability to hemp-based materials produced in other geographical locations.
2.1.1. Environmental implications: environmental life cycle assessment
The first step involves conducting an ELCA in order to identify the inputs or processes causing the highest environmental impacts (environmental hotspots) for the existing hemp-based board. Next, mitigation strategies are proposed to potentially enhance the environmental performance of the existing board. The ELCA is conducted following ISO 14040-44 standards (ISO Citation2006) which split the assessment into four phases: goal and scope, life cycle inventory analysis, life cycle impact assessment and life cycle interpretation. The fourth phase of the ELCA is presented in the results and discussion section.
Goal and scope
This work adds to previous research conducted by Rivas-Aybar, John, and Biswas (Citation2023b) that developed a comprehensive single-focused ELCA estimating the global warming impact of producing 1 m2 of a non-load bearing hemp-based board. The authors gathered primary data from the partner industries, including hemp producers and board manufacturers to develop the inventory of materials and energy required to produce hemp-based boards.
Global warming impact is significant when discussing environmental sustainability, however, this indicator alone does not fully address all the environmental concerns associated with the production of hemp-based materials (Ingrao et al. Citation2018). To address this, the current study includes various environmental impact categories considered relevant to the hemp industry in Australia. These additional categories have been selected through a multi-criteria analysis supplemented by a questionnaire-based survey, which adequately captured the perspectives of key stakeholders.
The functional unit used in the present study also differs from Rivas-Aybar, John, and Biswas (Citation2023b) as it is based on structural performance of the hemp-based board, specifically compressive strength. This choice of the functional unit was made because it is more closely aligned with the functional requirements of non-structural materials and because mechanical performance is a major concern in the development of boards based on agricultural feedstocks (Baharuddin et al. Citation2023). The functional unit was specified as 1 MPa of hemp-based board and the system boundary was defined as cradle-to-gate and included all production stages as indicated in .
Figure 3. System boundary for conducting the life cycle assessment of 1 MPa of hemp-based board (modified from Rivas-Aybar, John, and Biswas Citation2023b).
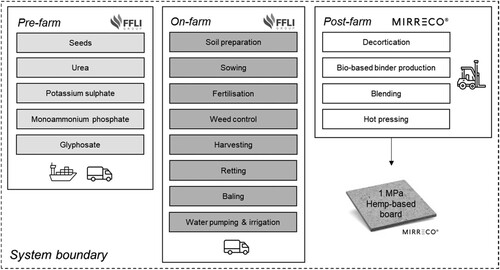
As shown in , the stages involved in the production of hemp-based boards comprise pre-farm, on-farm and post-farm activities as follows:
Pre-farm: production of agricultural inputs and transport to the farm.
On-farm: operation of farming machinery, transportation of hemp bales from the farm to processing plant and soil emissions from N fertilisation.
Post-farm: indoor transportation of raw materials, decortication, binder production, blending process and hot pressing.
The study was conducted under the following assumptions and limitations:
Inventory input data was obtained from Rivas-Aybar, John, and Biswas (Citation2023b).
The technical performance of the hemp-based board was not assessed as it was not the objective of this study. Technical data was obtained from Sassoni et al. (Citation2014) who estimated that the compressive strength of a similar non-load bearing hem-based board is 3.04 MPa.
Similarly, the technical performance of traditional low strength non-load bearing materials, i.e. gypsum plasterboards, was obtained from literature review.
Life cycle inventory analysis
This stage involved the quantification of materials and energy to produce the volume of hemp-based board needed to obtain a compressive strength of 1 MPa which is equivalent to 25 cm3 (Sassoni et al. Citation2014) ().
| (b) | Life cycle impact analysis | ||||
Table 1. Inventory inputs to produce the volume equivalent to 1 MPa of hemp-based board.
This stage is the most significant step for the subsequent EE analysis (Grosse-Sommer et al. Citation2020). During this stage, the inputs and outputs obtained in the life cycle inventory analysis are assigned to different environmental impact categories, e.g. acidification, eutrophication, ozone depletion and others. Consequently, the initial phase of the life cycle impact analysis entails selecting impact categories relevant to the product and region under study (Biswas and John Citation2023).
A participatory multi-criteria analysis technique was applied to select the relevant environmental impact categories and define their corresponding weights. This participatory tool has proven effective in ELCA, owing to its ability to integrate diverse stakeholder perspectives (Zanghelini, Cherubini, and Soares Citation2018). The current study engaged stakeholders from six broad groups: sustainable agriculture researchers and practitioners, hemp growers, hemp processors, hemp researchers, developers and manufacturers of hemp-based product as well as public extensionists. This approach acted as a safeguard against greenwashing by ensuring all significant impact categories are considered (Grosse-Sommer et al. Citation2020).
The participatory tool was implemented between March 2023 and January 2024, following ethics approval. Initially, 60 potential participants (ten from each stakeholder group) were invited via email and LinkedIn to contribute to this research. A final list of six stakeholders from each group, who consented to participate, were asked to complete an online questionnaire-based survey. The questionnaire-based survey included an initial list of ten impact categories, chosen through an extensive literature review on environmental impacts of products derived from hemp. The respondents were asked to determine if the proposed impact categories were relevant to evaluate the environmental performance of hemp-based materials and to rank the level of importance of the categories that were considered relevant by them.
Impact categories considered relevant by 50 per cent or more of the survey respondents were included in this study (Lim and Biswas Citation2018). Notably, all ten preliminary categories were considered relevant by more than 50 per cent of the total respondents. presents the final list of impact categories assessed.
Table 2. Relevant environmental impact categories and respective assessment methods.
The next steps in the life cycle impact analysis include classification and characterisation which were conducted using the SimaPro 9.2 software. In the classification phase, inventory data was allocated to the chosen impact categories (Renouf et al. Citation2015). Following classification, the characterisation stage employs characterisation factors to model environmental impacts, thereby generating quantified impact values for each impact category. For this, the software enabled to link inventory data of material and energy flows with the Australian National Life Cycle Inventory Database (ALCAS Citation2011). The Best Practice Guide for Life Cycle Impact Analysis in Australia (Renouf et al. Citation2015) was then used to select adequate impact assessment methods to help calculate each impact category (). This research adopted a conservative position, presuming that the Australian National Life Cycle Inventory Database accurately estimates the impacts of the inventory throughout the production of hemp-based boards. Recognising the potential for both overestimation and underestimation of impacts, an uncertainty analysis was conducted to assess results reliability. A Monte Carlo simulation was executed, running 1,000 iterations at a 95 per cent confidence interval. This simulation estimated the uncertainty levels in the calculation of impacts derived from hemp-based board production.
The environmental implications of the production of gypsum plasterboards were estimated using the same functional unit, system boundary, environmental impact categories, database and assessment methods as used for the above hemp-based board production.
2.1.2. Normalisation and weighting of environmental implications
According to ISO 14044, normalisation and weighting are optional steps of the life cycle impact analysis (ISO Citation2006). These stages, however, are necessary to aggregate the different impact categories into a single environmental score and provide data for the EE portfolio analysis (Grosse-Sommer et al. Citation2020).
The normalisation process sets a specific figure into relation to a global figure in a reference year (Kicherer et al. Citation2007). To normalise the impact categories, they were divided by the corresponding gross domestic environmental impact per capita in Australia presented in using Equation (1). This figure represents the quantity of a particular impact category a single person releases every year on average in Australia (Bengtsson and Howard Citation2010).
(1)
(1) where: Ni = normalised impact category i, LCIAi = life cycle environmental impact for impact category i, GDEIi = gross domestic environmental impact per capita for impact category i.
Table 3. Normalisation factors of relevant environmental impact categories.
In the next step, the normalised impact categories were multiplied by their corresponding weighting factor (Afrinaldi Citation2022). The weighting factors were calculated based on the survey results, where respondents were tasked with not only selecting appropriate impact categories but also indicating the level of importance of the selected categories. This assessment was conducted using a Likert-type scale ranging from 1 to 4, where 1 = somewhat important, 2 = moderately important, 3 = important and 4 = very important. The total point value of each impact category was calculated using Equation (2).
(2)
(2) where: Wi = total point value of the impact category i, i = impact category, ni1 = number of ‘somewhat important’ responses for impact category i, ni2 = number of ‘moderately important’ responses for impact category i, ni3 = number of ‘important’ responses for impact category i, ni4 = number of ‘very important’ responses for impact category i.
Then, the total weight for the total number of impact categories was calculated using Equation (3)
(3)
(3) where: Wtotal = total weight for the 10 impact categories, i = 1, 2, 3, … , 10 impact categories.
Finally, the weighting factor for each environmental impact category was calculated using Equation (4).
(4)
(4) where: W’i = weighting factor for impact category i.
summarises the weighting factors obtained for each environmental impact category.
Table 4. Weighting factors of relevant environmental impact categories.
The single environmental impact score of each board alternative evaluated in this study is calculated using Equation (5).
(5)
(5) where: EI = single environmental impact score.
The life cycle environmental impact stage enables a thorough examination of impacts derived from material and energy flows, allowing the identification of hotspots in the production of hemp-based boards. Mitigation strategies to alleviate these hotspots then can be proposed based on those suggested in the literature review. When these strategies are incorporated into the existing hemp-based board production, they may either decrease or increase material and energy inputs, thereby modifying inventory data. Consequently, subsequent ELCAs were conducted to assess the life cycle environmental impacts of each improved alternative hemp-based board to generate the corresponding single environmental score.
2.1.3. Economic implications: life cycle costing
The next step is to use the LCC method to estimate the production costs of the existing hemp-based board and improved board alternatives. The LCC was conducted with the same functional unit and system boundary as the ELCA, ensuring a cohesive analysis (Lawania and Biswas Citation2018).
Economic data related to the pre-farm and on-farm stages were collected through interviews with hemp growers from the Food, Fibre and Land International Group and expert advisors from the Department of Primary Industries and Regional Development. Data for the post-farm stage was gathered by interviewing a representative of MIRRECO®.
The economic implications of gypsum plasterboards were estimated by considering a minimum of three different prices obtained from the local market, which were then averaged.
2.1.4. Normalisation of economic implications
To normalise the LCC figures of hemp-based boards and gypsum plasterboards, they were divided by the Australian gross domestic product per capita using Equation (6). The gross domestic product per capita of Australia for the 2022–2023 financial year is AUD 84,230.05 (RBA Citation2023). This figure represents the economic value generated on average by each Australian inhabitant per year.
(6)
(6) where: N = normalised costs, LCC = life cycle costs, GDP = gross domestic product per capita.
2.1.5. Eco-efficiency portfolio generation
The single environmental score and normalised costs of ‘b’ product alternatives are used to plot their positions in the EE portfolio i.e. the existing hemp-based board, the improved hemp-based board and the gypsum plasterboards. Initial positions are estimated by dividing each alternative's environmental impact and cost impact to the average values, as outlined in Equations (7) and (8) (Kicherer et al. Citation2007).
(7)
(7)
(8)
(8) where: iP E,α = initial environmental impact position for board α, iP C,α = initial cost impact position for board α, EI α = environmental impact score of board α, N α = normalised cost of board α, b = number of boards under consideration (1,2,3 … b).
The initial positions are modified by incorporating the environment-to-cost relevance factor (RE,C) (Equation (9)). This aids in assessing whether cost or environmental impact holds greater influence in determining eco-efficient options. A relevance factor is employed to establish the ultimate portfolio positions (fP) for the existing and improved hemp-based boards and gypsum plasterboards (Equations 10–11).
(9)
(9)
(10)
(10)
(11)
(11) where: R E,C = environmental to cost relation for the portfolio, fP E,α = final environmental impact position for board α, fP C,α = final cost impact position for board α.
3. Results and discussion
3.1. Environmental implications
3.1.1. Uncertainty analysis
displays the results of the Monte Carlo simulations conducted over 1,000 iterations with a 95 per cent confidence level for the characterised environmental impacts of existing hemp-based boards. Discrepancies between calculated values and mean values ranged from 0.3 to 12.4 per cent. The calculated coefficient of variance for global warming is 2.67 per cent, indicating a relatively low uncertainty level. However, high levels of disparity were observed in more local impact categories including land use, acidification, ecotoxicity and ozone depletion (Arceo, Biswas, and John Citation2019).
Table 5. Characterised environmental impacts of the existing hemp-based board.
3.1.2. Environmental life cycle assessment of existing hemp-based boards
After conducting Monte Carlo simulations and verifying the quality of the data, the characterised impact categories were normalised and weighted (). As shown in , the single environmental impact score of the board is 1.94E-06. Impact categories contributing to 5 per cent or more of the total score were considered for hotspot analysis (Arceo, Biswas, and John Citation2019). Freshwater ecotoxicity had the highest contribution to the total environmental impact, accounting for 66.13 per cent, followed by eutrophication and human toxicity at 10.09 per cent and 7.99 per cent, respectively. Although global warming potential had a small contribution to the total environmental impact (3.30 per cent), it was included in the hotspot analysis due to increasing global concern on climate change (Pirani et al. Citation2024).
Table 6. Breakdown of normalised environmental impacts according to the stage to produce the volume of hemp-based board equivalent to the functional unit (1 MPa).
summarises the hotspot analysis conducted for freshwater ecotoxicity, eutrophication, human toxicity and global warming potential. These hotspots were then used for identifying potential environmental impact mitigation strategies.
Table 7. Breakdown of significant environmental impacts according to the stage to produce the functional unit (1 MPa).
As can be seen in , the primary contributors to the environmental impact of existing hemp-based boards are the production of synthetic fertilisers, i.e. urea, potassium sulphate and monoammonium phosphate, during the pre-farm stage. This aligns with the findings of previous ELCAs conducted on hemp-derived building materials where chemical fertilisation was found to be an environmental hotspot (Heidari et al. Citation2019; Ingrao et al. Citation2015; Sinka et al. Citation2018). It has been often reported that modern farming practices are accelerating the pressure on climate change, interrupting biogeochemical nitrogen and phosphorus cycles, causing ozone layer depletion, chemical pollution, biodiversity loss and the degradation of land and freshwater resources (Avadí et al. Citation2022; Gerten et al. Citation2020; Sandström et al. Citation2023; Schulte-Uebbing et al. Citation2022). In addition, farming is one of the largest sources of anthropogenic nutrient (nitrogen and phosphorus) and greenhouse gas emissions globally (Lee et al. Citation2020).
Specifically in terms of global warming potential, the electricity from the South West Interconnected System grid in Western Australia where this analysis was based, particularly during the post-farm stage (binder production and manufacturing), had the most significant impact. This is mainly attributed to the fact that the grid in Western Australia derives approximately 70 per cent of its power from fossil fuels (coal and gas), with the remaining portion generated from renewables (Synergy Citation2023).
3.1.3. Environmental life cycle assessment of improved hemp-based boards
3.1.3.1. Mitigation strategies for existing hemp-based board
According to the framework presented in , potential mitigation strategies for improving the environmental performance of existing hemp-based board were proposed. These strategies could potentially mitigate the hotspots identified in the ELCA described in section 3.1.2 (). Three mitigation strategies were determined based on the work published by Barton et al. (Citation2014) and Scrucca et al. (Citation2020) who proposed strategies to decrease the environmental burden of the production of agricultural products. presents the potential reduction in environmental impact for each strategy, along with their respective single environmental impact scores. As can be seen in , all strategies have led to a reduction in the impact score of the hemp-based board.
Table 8. Environmental impact reduction and environmental impact scores of the improved hemp-based board alternatives.
3.1.3.2. Mitigation strategy 1: installation of a rotation crop – HB1
This strategy examined the implementation of a legume-hemp rotation system as a strategy to enhance soil nitrogen fixation during legume growth and reduce the use of synthetic nitrogen fertilisers (urea and potassium sulphate) applied in subsequent hemp cultivation. This approach was based on a local study that estimated that a two-year lupin-wheat rotation significantly decreased the global warming impact of wheat in Western Australia's South West (Barton et al. Citation2014). The reduction was attributed to increased nitrogen levels in the soil during legume growth, enabling a 30 kg/ha reduction in nitrogen use in wheat production. This not only curtailed greenhouse gas emissions related to synthetic nitrogen fertiliser manufacturing but also reduced associated soil emissions from fertiliser application. Utilising supplementary data obtained from the authors (Barton et al. Citation2014) and representatives of the Department of Primary Industries and Regional Development, the mitigation strategy assumed a two-year lupin-hemp rotation. As the overall nitrogen requirement was unchanged (114 kg/ha), no changes in hemp yields (1 tonne/ha) were assumed.
As outlined in , implementing this strategy has led to a reduction across all impact categories decreasing the single environmental impact score of existing hemp-based board production by 22 per cent. This decrease can be attributed to the lower input of urea and potassium sulphate, with the most significant reductions observed in freshwater ecotoxicity and acidification.
3.1.3.3. Mitigation strategy 2: partial replacement of synthetic fertilisers with compost – HB2
This strategy was based on the work of Scrucca et al. (Citation2020) who reported that the substitution of the main synthetic nitrogen fertiliser (ammonium sulphate) with compost in varying ratios reduced global warming impact from hemp production. Similarly, the present work assessed the use of compost to partially substitute the amount of synthetic N fertiliser. Compost requirements were calculated considering that 1 m3 of compost could contribute to approximately 1.38 kg of nitrogen, 2.70 kg of phosphorus and 4.05 kg of potassium (Paulin and O'Malley Citation2008). According to these values, the amount of compost needed to reach the phosphorus and potassium requirement per ha for hemp cultivation is 14.8 m3. The nitrogen requirement was partially covered by the compost, with an application of 200 kg of urea per ha assumed to comply with the nutrient demand of hemp. Transportation of compost was modelled considering a mean distance of 100 km between the hemp farm location (Kaloorup, Western Australia) and the local composting facilities available in the study area. Like the previous mitigation strategy, the overall nutrient requirement was maintained and no changes in hemp yields were assumed.
As shown in , the use of compost as a partial substitute for synthetic fertilisers decreased the environmental score of existing hemp-based boards by 13 per cent. However, this mitigation strategy increased levels in global warming, land use, ozone depletion and acidification, as presented in . This increment across a few impact categories was attributed to an increase in the transport and farm machinery used to deliver and apply the required quantities of compost. This finding aligns with the results obtained by Venkat (Citation2012), who reported that the use of compost could lead to increased emissions compared to the use of conventional nitrogen fertilisers. However, the use of compost as an organic fertiliser did contribute to a reduction in the remaining impact categories, with significant decreases in eutrophication, human toxicity, freshwater ecotoxicity, water depletion and marine ecotoxicity.
3.1.3.4. Mitigation strategy 3: installation of solar photovoltaics – HB3
The installation and operation of solar photovoltaics to generate enough electricity to entirely replace the reliance on the electricity grid during the post-farm stage (0.0077 Kw) was assessed. As shown in , this strategy decreased the environmental impact score of existing hemp-based boards by 26 per cent, exhibiting the lowest impact score. The strategy also resulted in the decrease of emissions across all impact categories, with a significant level of reduction in the four categories considered in the hotspot analysis i.e. global warming, eutrophication, human toxicity and freshwater ecotoxicity.
3.1.4. Environmental life cycle assessment of conventional materials
The environmental impacts of gypsum plasterboard production were evaluated using the same functional unit, system boundary and impact categories as those for hemp-based boards. presents the compressive strength values used to calculate the volume equivalent to the functional unit (1 MPa) is presented in .
Table 9. Compressive strength values of conventional materials.
Impacts were estimated based on data from the Australian National Life Cycle Inventory Database (ALCAS Citation2011) using the SimaPro 9.2 software ().
Table 10. Environmental impact from the production of 1 MPa of gypsum plasterboards.
3.2. Economic implications
This section estimates the life cycle costs, or production costs, for both the existing and the improved hemp-based board. To maintain consistency with the environmental analyses, the same inventory data (including labour) was considered in the LCC. All cost information was obtained from representatives of Food, Fibre and Land International Group and MIRRECO®. displayed the cost breakdown of the existing hemp-based board.
Table 11. Breakdown of the costs to produce the volume of the existing hemp-based board equivalent to the functional unit (1 MPa).
3.2.1. Life cycle cost of existing hemp-based boards
As presented in , the cost to produce the functional unit of the existing hemp-based board was estimated to be 0.0521 AUD. The bio-based binder contributed to 40 per cent of total costs whereas the production of hemp boards which comprised pre-farm and on-farm stages contributed to 29 per cent of total costs.
3.2.2. Life cycle cost of improved hemp-based board alternatives
The LCC of the three improved hemp-based board alternatives were estimated according to their inventory data. Complementary data was acquired from different local suppliers for cross-checking purposes. Total costs for each alternative board are presented in .
Table 12. Total costs to produce the volume of improved hemp-based boards equivalent to the functional unit (1 MPa).
As presented in , the only strategy that decreased production costs of existing hemp-based boards was the installation of solar photovoltaics (HB3) (0.4 per cent decrease). Conversely, the installation of a rotation crop (HB1) and the partial replacement of synthetic fertilisers with compost (HB2) increased the total production costs by 7 per cent and 6 per cent respectively. This increment to the production costs is due to a variety of factors as described below:
3.2.2.1. Mitigation strategy 1: installation of a rotation crop – HB1
Economic analysis indicated that the lupin-hemp rotation system was less profitable than the hemp-hemp system as the cost of the former is 7 per cent higher than the latter. This is due to the price of lupin being lower than the price of hemp per ha and the yield of lupin in the hemp-production region under study (Kaloorup) is lower compared to other regions in Western Australia (Telfer, D., Department of Primary Industries and Regional Development representative, pers. comm., 7 October 2023). This finding aligns with the results obtained by Barton et al. (Citation2014) who reported that incorporating a legume in a cropping rotation as a strategy to mitigate greenhouse gas emissions from wheat production in Western Australia was not financially attractive for wheat growers.
3.2.2.2. Mitigation strategy 2: partial replacement of synthetic fertilisers with compost – HB2
The purchase, transportation and application cost associated with the use of a large amount of compost (17.81 m3/ha) as a partial replacement for the synthetic fertilisers resulted in a 6 per cent increase of the total production costs of the existing hemp-based board. This is due to the higher costs of compost (1,240 AUD per ha), which alone is responsible for increasing the cost by 24 per cent through replacing urea, potassium sulphate and mono-ammonium phosphate combined.
3.2.3. Cost of existing and improved hemp-based boards and conventional boards
The selling price of the existing and improved hemp-based boards was calculated by multiplying total production costs by a factor of 1.5 which is the profit margin established by the manufacturer MIRRECO® (Evans, R., MIRRECO® CEO, pers. comm., 1 October 2023). Gypsum plasterboard prices have been sourced from the market and they have been averaged, based on different prices.
The estimated price of hemp-based and conventional boards were normalised by dividing them by the gross domestic product per inhabitant for the 2022–2023 financial year which is AUD 84,230.05 (RBA Citation2023). presents the normalised prices of the existing and improved hemp-based boards and gypsum plasterboards related to the functional unit (1 MPa).
Table 13. Normalised prices of the existing and improved hemp-based boards and conventional boards related to the functional unit (per MPa).
3.3. Eco-efficiency portfolio analysis
The generation of an EE portfolio was performed. This analysis was focused on the determination of the most eco-efficient option for boards among the alternatives assessed. The positions of the existing and improved hemp-based boards and gypsum plasterboards in the EE portfolio were calculated using the results from sections 3.1.2 to 3.2.3 and using equations (2) to (6).
As shown in , both the gypsum plasterboard and the hemp-based board using solar energy (HB3) are the only eco-efficient options since their corresponding positions were located above the EE line. Therefore, in this case, the only mitigation strategy that can be considered eco-efficient is HB3. As discussed previously, the complete replacement of the electricity network by solar photovoltaics exhibited the lowest environmental impact score and reduced all environmental impacts. In addition, this was the only mitigation strategy that decreased the production costs of hemp-based boards.
Figure 4. Eco-efficiency portfolio of four hemp-based boards and conventional gypsum plasterboard.
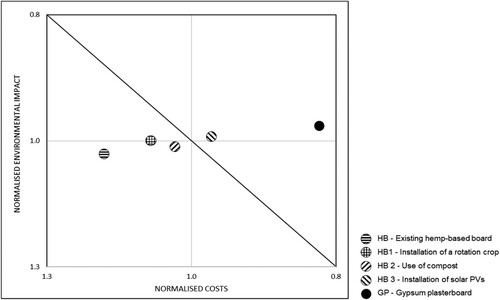
According to the EE portfolio presented in , the existing hemp-based board along with two of the improved options (HB1 and HB2) were not considered eco-efficient alternatives. It is worth noting that the strategies used in HB1 and HB2, i.e. installation of a rotation crop and use of compost respectively, decreased the environmental burdens caused by the use of synthetic fertilisers which were the main contributors to the total environmental impact of the existing hemp-based boards. Despite these strategies reducing the environmental impact scores, they significantly increased production costs and therefore failed to be eco-efficient. These results are consisted with previous studies, where commercially available hemp-based materials were found to be non-eco-efficient compared to their traditional counterparts due to their higher market prices (Colli, Bataille, and Antczak Citation2020; Dickson and Pavía Citation2021). Future research should focus on finding cost-effective mitigation strategies to mitigate the environmental impacts caused by the use of synthetic fertiliser in the hemp-based materials life cycle.
The results obtained from the EE framework confirms the EE of these plant-based construction materials and can assist hemp producers and hemp-based materials manufacturers in the decision-making processes to improve cost-competitiveness while maintaining both environmental performance and structural integrity.
4. Conclusion
This research has applied an EE framework to investigate the opportunities available for simultaneously enhancing the environmental and economic performance of non-structural hemp-based boards. The study integrated ELCA, multi-criteria analysis, environmental mitigation strategies, LCC and EE portfolio analysis to propose EE strategies at the production stage of this product and compare it with conventional alternatives, i.e. gypsum plasterboards. The functional unit was based on mechanical characteristics of 1 MPa and the system boundary included all production stages: pre-farm, on-farm and post-farm. The ELCA showed that the main environmental hotspots are the use of synthetic fertilisers during the pre-farm stage and the use of electricity from the South West Interconnected System grid during the post-farm stage. Accordingly, three different mitigation strategies were proposed: the installation of a rotation crop, the partial replacement of synthetic fertilisers with compost and the installation of solar photovoltaics which reduced environmental impacts by 22 per cent, 13 per cent and 26 per cent respectively. The LCC indicated that the implementation of solar photovoltaics was the only mitigation strategy that led to cost reduction. The EE portfolio analysis suggested that both, the hemp-based board using solar energy and the gypsum plasterboard, are the only eco-efficient options among the alternatives assessed. The EE framework deployed in this study can provide useful information to hemp growers and manufacturers of hemp-based materials in Australia to improve the sustainability performance of their products.
Disclosure statement
No potential conflict of interest was reported by the author(s).
Additional information
Funding
References
- Abdalla, H., K. P. Fattah, M. Abdallah, and A. K. Tamimi. 2021. “Environmental Footprint and Economics of a Full-Scale 3D-Printed House.” Sustainability 13 (21): 11978.
- Afrinaldi, F. 2022. “A New Method for Measuring Eco-Efficiency.” Cleaner Environmental Systems 7: 100097.
- ALCAS. 2011. The Australian Life Cycle Inventory Database Initiative. Australian Life Cycle Assessment Society. Accessed August 24, 2023 from https://www.auslci.com.au/.
- Arceo, A., W. K. Biswas, and M. John. 2019. “Eco-Efficiency Improvement of Western Australian Remote Area Power Supply.” Journal of Cleaner Production 230: 820–834.
- Avadí, A., V. Galland, A. Versini, and C. Bockstaller. 2022. “Suitability of Operational N Direct Field Emissions Models to Represent Contrasting Agricultural Situations in Agricultural LCA: Review and Prospectus.” Science of The Total Environment 802: 149960.
- Backes, J. G., and M. Traverso. 2021. “Application of Life Cycle Sustainability Assessment in the Construction Sector: A Systematic Literature Review.” Processes 9 (7): 1248.
- Baharuddin, M., N. M. Zain, W. Harun, E. N. Roslin, F. A. Ghazali, and S. N. M. Som. 2023. “Development and Performance of Particleboard From Various Types of Organic Waste and Adhesives: A Review.” International Journal of Adhesion and Adhesives 124: 103378.
- Barton, L., T. Thamo, D. Engelbrecht, and W. K. Biswas. 2014. “Does Growing Grain Legumes or Applying Lime Cost Effectively Lower Greenhouse Gas Emissions From Wheat Production in a Semi-Arid Climate?” Journal of Cleaner Production 83: 194–203.
- Belucio, M., C. Rodrigues, C. H. Antunes, F. Freire, and L. C. Dias. 2021. “Eco-Efficiency in Early Design Decisions: A Multimethodology Approach.” Journal of cleaner production 283: 124630.
- Bengtsson, J., and N. Howard. 2010. A life Cycle Impact Assessment Method for Use in Australia—Classification, Characterisation and Research Needs. New South Wales: Edge Environment Pty Ltd.
- Biswas, W. K., and M. John. 2023. Engineering for Sustainable Development: Theory and Practice. Hoboken, New Jersey: John Wiley & Sons.
- Cabeza, L. F., L. Rincón, V. Vilariño, G. Pérez, and A. Castell. 2014. “Life Cycle Assessment (LCA) and Life Cycle Energy Analysis (LCEA) of Buildings and the Building Sector: A Review.” Renewable and Sustainable Energy Reviews 29: 394–416.
- CEN, E. 2019. 15804: 2012+ A2: 2019 Sustainability of Construction Works—Environmental Product Declarations—Core Rules for the Product Category of Construction Products. Brussels: European Committee for Standardization (CEN).
- Colli, C., A. Bataille, and E. Antczak. 2020. “Investigating Eco-Efficiency Procedure to Compare Refurbishment Scenarios with Different Insulating Materials.” Procedia CIRP 90: 322–327.
- Dickson, T., and S. Pavía. 2021. “Energy Performance, Environmental Impact and Cost of a Range of Insulation Materials.” Renewable and Sustainable Energy Reviews 140: 110752.
- Dong, Y., S. T. Ng, and P. Liu. 2023. “Towards the Principles of Life Cycle Sustainability Assessment: An Integrative Review for the Construction and Building Industry.” Sustainable Cities and Society 95: 104604.
- Dynan, D., F. Shaikh, S. Derry, and W. K. Biswas. 2023. “Eco-Efficiency Assessment Utilizing Recycled Glass Aggregate in Concrete.” Buildings 13 (4): 910.
- Ehrenfeld, J. 2004. “Industrial Ecology: A New Field or Only a Metaphor?” Journal of cleaner production 12 (8-10): 825–831.
- Gerten, D., V. Heck, J. Jägermeyr, B. L. Bodirsky, I. Fetzer, M. Jalava, M. Kummu, et al. 2020. “Feeding Ten Billion People is Possible Within Four Terrestrial Planetary Boundaries.” Nature Sustainability 3 (3): 200–208. https://doi.org/10.1038/s41893-019-0465-1.
- Grosse-Sommer, A. P., T. H. Grünenwald, N. S. Paczkowski, R. N. van Gelder, and P. R. Saling. 2020. “Applied Sustainability in Industry: The BASF Eco-Efficiency Toolbox.” Journal of cleaner production 258: 120792.
- Gundes, S. 2016. “The Use of Life Cycle Techniques in the Assessment of Sustainability.” Procedia-Social and Behavioral Sciences 216: 916–922.
- Heidari, M. D., M. Lawrence, P. Blanchet, and B. Amor. 2019. “Regionalised Life Cycle Assessment of Bio-Based Materials in Construction; the Case of Hemp Shiv Treated with Sol-Gel Coatings.” Materials 12 (18): 2987.
- Heijungs, R. 2022. “Ratio, Sum, or Weighted Sum? The Curious Case of BASF’s Eco-Efficiency Analysis.” ACS Sustainable Chemistry & Engineering 10 (27): 8754–8762.
- Hollberg, A., and J. Ruth. 2016. “LCA in Architectural Design – A Parametric Approach.” The International Journal of Life Cycle Assessment 21: 943–960.
- Huertas-Valdivia, I., A. M. Ferrari, D. Settembre-Blundo, and F. E. García-Muiña. 2020. “Social Life-Cycle Assessment: A Review by Bibliometric Analysis.” Sustainability 12 (15): 6211.
- Ingrao, C., A. L. Giudice, J. Bacenetti, C. Tricase, G. Dotelli, M. Fiala, V. Siracusa, and C. Mbohwa. 2015. “Energy and Environmental Assessment of Industrial Hemp for Building Applications: A Review.” Renewable and Sustainable Energy Reviews 51: 29–42.
- Ingrao, C., A. Messineo, R. Beltramo, T. Yigitcanlar, and G. Ioppolo. 2018. “How can Life Cycle Thinking Support Sustainability of Buildings? Investigating Life Cycle Assessment Applications for Energy Efficiency and Environmental Performance.” Journal of cleaner production 201: 556–569. https://doi.org/10.1016/j.jclepro.2018.08.080.
- ISO. 2006. Environmental Management: Life Cycle Assessment; Principles and Framework. Geneva, Switzerland: International Organization for Standardization.
- Kicherer, A., S. Schaltegger, H. Tschochohei, and B. F. Pozo. 2007. “Eco-Efficiency: Combining Life Cycle Assessment and Life Cycle Costs Via Normalization.” The International Journal of Life Cycle Assessment 12: 537–543.
- Lawania, K., and W. K. Biswas. 2018. “Application of Life Cycle Assessment Approach to Deliver Low Carbon Houses at Regional Level in Western Australia.” The International Journal of Life Cycle Assessment 23: 204–224.
- Lee, E. K., X. Zhang, P. R. Adler, G. S. Kleppel, and X. X. Romeiko. 2020. “Spatially and Temporally Explicit Life Cycle Global Warming, Eutrophication, and Acidification Impacts from Corn Production in the U.S. Midwest.” Journal of cleaner production 242: 118465. https://doi.org/10.1016/j.jclepro.2019.118465.
- Lim, C. I., and W. K. Biswas. 2018. “Development of Triple Bottom Line Indicators for Sustainability Assessment Framework of Malaysian Palm Oil Industry.” Clean Technologies and Environmental Policy 20: 539–560.
- Mouton, L., K. Allacker, and M. Röck. 2023. “Bio-Based Building Material Solutions for Environmental Benefits Over Conventional Construction Products–Life Cycle Assessment of Regenerative Design Strategies (1/2).” Energy and Buildings 282: 112767.
- Ntimugura, F., R. Vinai, A. B. Harper, and P. Walker. 2021. “Environmental Performance of Miscanthus-Lime Lightweight Concrete Using Life Cycle Assessment: Application in External Wall Assemblies.” Sustainable Materials and Technologies 28: e00253.
- Paulin, B., and P. O'Malley. 2008. Compost Production and Use in Horticulture. https://library.dpird.wa.gov.au/cgi/viewcontent.cgi?article=1197&context=bulletins#:~:text=Compost%20provides%20potentially%20one%20of,to%20soil%20quality%20and%20performance.
- Petrone, C., G. Magliulo, and G. Manfredi. 2016. “Mechanical Properties of Plasterboards: Experimental Tests and Statistical Analysis.” Journal of Materials in Civil Engineering 28 (11): 04016129.
- Pirani, A., J. S. Fuglestvedt, E. Byers, B. O’Neill, K. Riahi, J.-Y. Lee, J. Marotzke, S. K. Rose, R. Schaeffer, and C. Tebaldi. 2024. “Scenarios in IPCC Assessments: Lessons from AR6 and Opportunities for AR7.” NPJ Climate Action 3 (1): 1.
- RBA. 2023. Composition of the Australian Economy. Reserve Bank of Australia. Retrieved 26/10/2023 from https://www.rba.gov.au/education/resources/snapshots/economy-composition-snapshot/.
- Renouf, M., T. Grant, M. Sevenster, J. Logie, B. Ridoutt, F. Ximenes, J. Bengtsson, A. Cowie, and J. Lane. 2015. Best Practice Guide for Life Cycle Impact Assessment (LCIA) in Australia. Australian Life Cycle Assessment Society.
- Rivas-Aybar, D., M. John, and W. Biswas. 2023a. “Can the Hemp Industry Improve the Sustainability Performance of the Australian Construction Sector?” Buildings 13 (6): 1504.
- Rivas-Aybar, D., M. John, and W. Biswas. 2023b. Environmental Life Cycle Assessment of a Novel Hemp-Based Building Material.
- Saling, P., A. Kicherer, B. Dittrich-Krämer, R. Wittlinger, W. Zombik, I. Schmidt, W. Schrott, and S. Schmidt. 2002. “Eco-Efficiency Analysis by BASF: The Method.” The International Journal of Life Cycle Assessment 7: 203–218.
- Sandström, V., J. Kaseva, M. Porkka, M. Kuisma, Y. Sakieh, and H. Kahiluoto. 2023. “Disparate History of Transgressing Planetary Boundaries for Nutrients.” Global Environmental Change 78: 102628.
- Sassoni, E., S. Manzi, A. Motori, M. Montecchi, and M. Canti. 2014. “Novel Sustainable Hemp-Based Composites for Application in the Building Industry: Physical, Thermal and Mechanical Characterization.” Energy and Buildings 77: 219–226.
- Satola, D., M. Balouktsi, T. Lützkendorf, A. H. Wiberg, and A. Gustavsen. 2021. “How to Define (Net) Zero Greenhouse Gas Emissions Buildings: The Results of an International Survey as Part of IEA EBC Annex 72.” Building and Environment 192: 107619.
- Schulte-Uebbing, L., A. Beusen, A. Bouwman, and W. De Vries. 2022. “From Planetary to Regional Boundaries for Agricultural Nitrogen Pollution.” Nature 610 (7932): 507–512.
- Scrucca, F., C. Ingrao, C. Maalouf, T. Moussa, G. Polidori, A. Messineo, C. Arcidiacono, and F. Asdrubali. 2020. “Energy and Carbon Footprint Assessment of Production of Hemp Hurds for Application in Buildings.” Environmental Impact Assessment Review 84: 106417.
- Shooshtarian, S., M. R. Hosseini, T. Kocaturk, T. Arnel, and N. Garofano. 2023. “Circular Economy in the Australian AEC Industry: Investigation of Barriers and Enablers.” Building Research & Information 51 (1): 56–68.
- Sinka, M., A. Korjakins, D. Bajare, Z. Zimele, and G. Sahmenko. 2018. “Bio-Based Construction Panels for Low Carbon Development.” Energy Procedia 147: 220–226.
- Soonsawad, N., R. M. Martinez, and H. Schandl. 2022. “Material Demand, and Environmental and Climate Implications of Australia’s Building Stock: Current Status and Outlook to 2060.” Resources, conservation and recycling 180: 106143.
- Synergy. 2023. Annual Report 2023. https://www.synergy.net.au/About-us/News-and-announcements/Annual-reports/2023-Annual-Report.
- Venkat, K. 2012. “Comparison of Twelve Organic and Conventional Farming Systems: A Life Cycle Greenhouse Gas Emissions Perspective.” Journal of Sustainable Agriculture 36 (6): 620–649.
- Verfaillie, H. A. 2000. Measuring Eco-Efficiency: A Guide to Reporting Company Performance. London: World Business Council for Sustainable Development.
- Xie, H., Q. Cui, and Y. Li. 2022. “Net Present Value Method: A Method Recommended by ISO 15686-5 for Economic Evaluation of Building Life Cycle Costs.” World Journal of Engineering and Technology 10 (2): 224–229.
- Yang, H., and Y. Yue. 2021. “Optimization of Green and Low-Carbon Concept in Prefabricated Building Design.” E3S Web of Conferences.
- Yin, K., R. Wang, Q. An, L. Yao, and J. Liang. 2014. “Using Eco-Efficiency as an Indicator for Sustainable Urban Development: A Case Study of Chinese Provincial Capital Cities.” Ecological Indicators 36: 665–671. https://doi.org/10.1016/j.ecolind.2013.09.003.
- Zanghelini, G. M., E. Cherubini, and S. R. Soares. 2018. “How Multi-Criteria Decision Analysis (MCDA) is Aiding Life Cycle Assessment (LCA) in Results Interpretation.” Journal of Cleaner Production 172: 609–622.
- Zhang, X., and W. K. Biswas. 2021. “Development of Eco-Efficient Bricks–A Life Cycle Assessment Approach.” Journal of Building Engineering 42: 102429.