
 ?Mathematical formulae have been encoded as MathML and are displayed in this HTML version using MathJax in order to improve their display. Uncheck the box to turn MathJax off. This feature requires Javascript. Click on a formula to zoom.
ABSTRACT
The power distribution network is an important link between the end of power grid and the users. Precise predictions on the risk probability of the distribution network in severe weather could provide the electric company with a reference to daily operation and maintenance arrangements. The company could also prepare professional mechanists and necessary supplies in advance and restoring power supply in a short time. In this paper, a failure risk prediction of power distribution network method based on particle swarm optimisation and extreme gradient boosting tree algorithm is proposed. The local weather data is fed into the model, outputting the failure severity and probability of the area in the same period. The case study shows that our proposed method relieves the low accuracy problem by introducing the particle swarm optimisation algorithm to search the optimal values of critical parameters. On the testing dataset, the accuracy of our method reaches 96.19%, showing that our model can efficiently evaluate the risk level of the distribution network working conditions. Moreover, the algorithm can extract the association rules between the weather features and the failure risk levels, offering the data support for the failure risk prevention of the distribution network under severe weather.
1. Introduction
The power distribution network is an important facility closely related to users at the end of the power grid. Its failure may lead to power outage in the local area and even trigger a chain reaction to cause power supply accidents in a larger area, thus causing great damage to the power system (Hanqing, Yadong, and Gehao et al. Citation2017). Especially in severe weather conditions, power distribution network facilities are always threatened by wet environment caused by precipitation and heavy load (Xiuchen, Yadong, and Xiaofei et al. Citation2019). In 2008, 20 provinces and cities were affected by a nationwide ice and snow disaster. As a result, 36,000 power lines were shut down; more than 350,000 lines were broken; more than 560,000 towers collapsed, causing direct economic losses of 10.45 billion yuan (Shouxiang, Renshan, and Zhixin et al. Citation2020).
Because of factors such as remote monitoring, incomplete remote-control switches, redundancy deficiency, and N-1 check, the power distribution network has poorer disaster response ability than the power transmission network. Hurricane Sandy in 2012 caused power outages for 8.2 million users in the United States and 35 million in India, resulting in huge economic losses (Hongbin, Jian, and Jiaxing et al. Citation2019). After that incident, the ‘resilient’ power supply by the power distribution network in severe weather became a focus of academic and industrial circles (Xiangyang, Zhiwei, and Zhiwei Citation2010).
Improving the severe weather response capacity of the power distribution network could effectively improve the reliability and safety of power supply and reduce the range of power failures when disasters occur. At the same time, with the rapid development of meteorological forecasting technology, the feasibility of meteorological data-based power distribution network operation risk assessment has been greatly improved (Rui, Yue, and Jian et al. Citation2011). By predicting the failure probability of the power distribution network in a future period, we can work out operation and maintenance plans according to the severity, and make targeted personnel arrangement and material reserve to deal with the corresponding risk level. This could lay a solid foundation for post-disaster repair of the power distribution network and restoration of power supply (Tewei, Zongxiang, and Ying et al. Citation2017).
Currently, research on failure risk prediction of the power distribution networks considering weather factors has been widely concerned in the academic circle, and the methods are mostly mathematical statistics. The literature (Hui, Hao, and Yong et al. Citation2019) presents an empirical failure probability of transmission-line towers in typhoon weather considering wind load. The literature (Wen, Wanxing, and Keyan et al. Citation2018) adopts C4 decision tree to predict the failure risk level of a power distribution network, taking into account the frequency of failure occurrence, weather and other factors. The literature (Yong, Ruizeng, and Enze et al. Citation2018) uses a statistical model of normal distribution and type I extreme value distribution functions to fit the wind load of transmission lines (Yong, Ruizeng, and Enze et al. Citation2018) to predict the severity of line damage in typhoon weather. The literature (Xiaomin, Shaoyun, and Teng et al. Citation2018) combines information entropy screening and kernel density estimation to model and deduce the failure rate of components in power distribution networks in severe weather.
Considering that the dataset of power distribution network in severe weather is a small sample set, the possibility of fixed data distribution is low. However, the rise of machine learning has brought a new exploration direction to this subject. Most methods are data-driven, not experience-based, and can achieve high accuracy. The extreme gradient boosting (XGBoost) proposed by T Q and Guestrin C in the 2016 international data classification contest has been widely popularised in many fields, such as competition, medicine, finance and so on, because of its excellent classification performance. On that basis, particle swarm optimisation (PSO) is used to optimise the structural parameters. Thus, a more stable and accurate power distribution network failure risk prediction model is obtained through cross integration.
PSO-XGBoost is the basis of the failure prediction model. The failure cases of the power distribution network in a city in eastern China from 2011 to 2017 in severe weather are selected as samples. The weather data before the failures is fed into the model for severity classification of the power distribution network failures in the same period. Experimental results show that the method relieves the low accuracy problem of decision tree that sets parameters according to experience. This model achieves an accuracy of 96.19% on the test set. This means that it can accurately evaluate the risk level of power distribution network working conditions. At the same time, the feature extraction function of XGBoost can give the influence of each weather index on failure occurrence so as to provide data support for risk control of power distribution network in severe weather.
2. Extreme gradient boosting algorithm
The extreme gradient boosting tree is an integrated learning algorithm based on gradient boosting. Taking classification and regression tree (CART) as the elementary tree (Chen and Guestrin Citation2016), it calculates the final classification results by integrating multiple elementary trees. It has the advantages of high efficiency and high accuracy in classification tasks. On the basis of Gradient Boosting Decision Tree (GBDT), the second derivative of the loss function on the prediction result is introduced, and the complexity of a tree model is added to the objective function as a regularisation term, which can prevent overfitting and improve the generalisation performance of the model.
Dataset ,
contains
samples. Each sample input consists of the M-dimension feature and a one-dimensional label. CART subtrees numbering K are constructed. Then, the prediction result after XGBoost integrates all subtrees can be expressed as
Where is the mapping function of the k’th subtree,
is a set of mapping functions of all subtrees, and
is the function mapping of the model after integrating all subtrees.
XGBoost is not to build all subtrees at one time, but to add one subtree at every round on the basis of a greedy algorithm using gradient boosting method. Fitting is carried out step by step. The prediction result of round t is
The objective function in the course of training can be deduced from the above formula as
Where is the loss function between the prediction result and the actual label and
is the complicated function of the subtree.
The loss function can be user-defined according to the type of problem, but it should be a second derivative. In a classification problem, square error is generally used. A second-order expansion is conducted according to Taylor series, which can be expressed as
Where and
are, respectively, the first-order partial derivative and the second-order partial derivative of the loss function about the last round of prediction result.
The tree complexity is usually controlled by regularisation terms to prevent overfitting, usually defined as
Where and
are, respectively, the penalty coefficients of the regularisation term
and the regularisation term
.
is the number of leaf nodes of the k’th tree.
is the weight of the
’th leaf node of the
’th tree.
We define the structure of each subtree as , which satisfies the structural relationship of Index No.
leaf node of Sample
in this tree, and the sample set on each leaf is
. Synthesis Equationequations (4)
(4)
(4) and (Equation5
(5)
(5) ) are
. So the objective function of XGBoost can be summarised as
From the above, we can know it is necessary to set a large number of parameters for modelling using XGBoost, such as the number of CART subtrees, the maximum tree height, the regularisation penalty coefficient, the iteration step, the learning rate and so on. For finding the best combination of parameters, this paper uses particle swarm optimisation to optimise the parameters in XGBoost to improve the classification performance of the model.
3. Particle swarm optimisation
Particle swarm optimisation (PSO) is an evolutionary computing technique widely used in the fields of function optimisation, neural network training and genetic algorithm (Kennedy and Eberhart Citation1995). PSO, which comes from studies on the predation of bird swarms, is a random optimisation model established on the basic idea of information sharing and cooperation among individuals in a swarm to find the optimal solution.
Each individual of a swarm is abstracted and simplified into a particle without mass and volume and extended into D-dimension space. The two variables (position and velocity) can be used to represent the state of a particle. The position vector and velocity vector of the ’th particle are
and
respectively.
Before the optimisation begins, each particle randomly generates a set of solutions. Then, particles, in the process of spatial motion, search for the personal optimal solution particle and the global optimal solution particle
to update their position and velocity at the next moment.
When defining individual and global optimal solution particles, computational particles are usually used to quantify the fitness of the current optimisation problem, and the optimal solution is constantly updated at each moment as the search experience of the remaining particles.
Where is the current moment,
is the personal inertia factor,
are respectively acceleration factors approaching the personal optimal solution particle and the global optimal solution particle, and
are random numbers between 0 and 1 that assure the solution diversity in the process of convergence to extreme values.
The particle fitness in this paper is the objective function of XGBoost in the previous chapter, that is, formula (6). The smaller the objective function value is, the stronger the particle fitness is. At the same time, linear differential degression is used to tune the values of inertia factor and acceleration factor in the training process to ensure the search ability of particles for local and global optimal solutions.
Where are the maximum and the minimum of the preset inertia factor,
are the initial values of the acceleration factor,
are the final values of the acceleration factor, and
is the maximum number of iterations.
4. Failure prediction frame for power distribution network
A flowchart failure prediction model based on particle swarm optimisation and extreme gradient boosting is shown in . The weather data of where the power distribution network is located is fed into the model. The structure of XGBoost model is optimised by PSO to obtain the optimal prediction model (Kai, Feng, and Ting et al. Citation2020) and give the final probability level of failure.
Figure 1. Flowchart of failure prediction model.
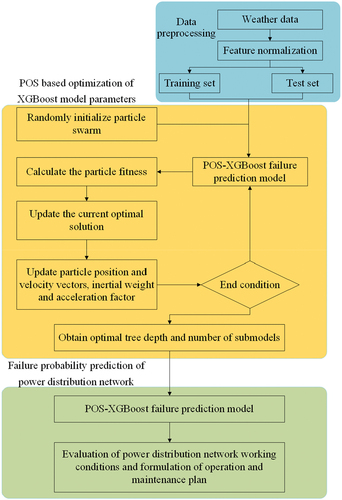
4.1. Preprocessing of weather data
The weather data is first normalised according to their features to prevent the numerical differences between the features from affecting the convergence of the model. No. dimension feature
of
-dimension features is normalised, and the result is as follows:
Then, the case base is divided into a training set and a test set at the ratio of 70%: 30%. The ’th sample is recorded as
, where
represent the feature of the normalised input weather data and the corresponding failure-level label respectively.
4.2. XGBoost model optimised by PSO
Step 1: Set the search ranges of the iteration step and the maximal sub-tree depth of each PSO particle in XGBoost model, and initialise the PSO model particle swarm;
Step 2: Establish the corresponding XGBoost model on the basis of each particle parameter, input the training set is input, and calculate the fitness of each particle in the swarm with XGBoost objective function as the fitness;
Step 3: Update the personal optimal solution particle and the global optimal solution particle by the standard that the minimum objective function value has the highest fitness;
Step 4: Update each particle’s position vector and velocity vector, and calculate the inertia factor and acceleration factor of the next round;
Step 5: The end condition is that particle fitness tends to be stable or the number of iterations reaches the maximum. If satisfied, the next step is continued. Otherwise, Step 2 is re-executed;
Step 6: The final PSO-XGBoost failure prediction model is obtained by taking the iteration step and the maximal sub-tree depth of the global optimal solution particle in PSO as XGBoost structural parameters;
Step 7: The training set and the test set are input at the same time to obtain the failure severity of each sample.
4.3. Model evaluation methodology
To comprehensively evaluate the performance of this method in power distribution network failure prediction, four indexes – accuracy, precision, recall and F1-score – are selected to conduct analysis from such aspects as the prediction accuracy of all failure levels and the prediction precision ratio and recall ratio of each failure level. The accuracy and F1-score are judged from the recognition rate and accuracy rate of all samples. The formulas for the above four evaluation indexes are:
5. Example analysis
In this paper, the failure cases of power distribution network in a prefecture-level city in south-eastern inland China from 2011 to 2017 are selected. The failure fault records of the power distribution network are provided by the local power grid operation and maintenance company. We carefully select the failures caused by bad weather, thunderstorms and lighting and so on and so forth, as our data set. The weather data before the failures occurred are input into the model to classify the failure severity of the power distribution network in the same period.
Considering the uncertainty of weather forecast, 1 week, which is commonly used in meteorological forecast, is selected as a cycle. There are 364 weeks from 2011 to 2017. At most 14 failures occurred in 1 week, and no failure occurred in most weeks. The number of power distribution network failures caused by severe weather per week is used as the indicator for determining the risk level, altogether 4 levels. Details about the distribution of samples at each level and the division of test set and training set are shown in .
Table 1. Sample Distribution.
In windy weather, it is easy for power distribution networks to contact surrounding trees or be hooked by foreign matters so as to cause single-phase ground failure. In continuous rainy days, the increase in humidity may affect the insulation performance of the equipment, leading to leakage of current or pollution flashover. Under the action of thunder and lightning, power distribution network-related equipment may suffer overvoltage, current leakage or other failures due to lightning stroke. Therefore, this paper mainly selects weather indexes including gale, precipitation, thunder and lightning as the input of the failure risk prediction model, as shown in .
Table 2. Weather Feature.
5.1. Parameter optimisation results of XGBoost model
This paper uses the particle evolution idea of PSO to optimise the iteration step and the maximal sub-tree depth, two key parameters in XGBoost model, through searching the fitness extremum by particles. The maximum iteration number of the PSO model is preset to 300, the swarm number to 20, the inertia factors to 0.9 and 0.4, the initial values of the acceleration factor
to 2 and 0.5, and the final values of the acceleration factor
to 0.5 and 2. The search range of XGBoost iteration step is set to [100,800], and the search range of the maximal sub-tree depth to (Shouxiang, Renshan, and Zhixin et al. Citation2020; ZHAO, ZENG, and WANG et al. Citation2020). The other parameters of the XGBoost classification model are set as follows: the number of subtrees: 300; the learning rate: 0.05; the penalty factors
and
of the tree model complexity: 0.01 and 0.9.
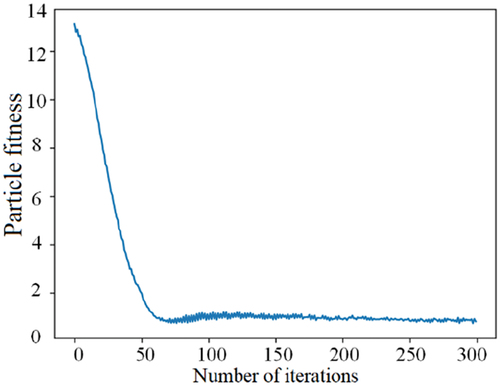
The particle fitness in the optimisation process of PSO is shown in . During the iterative search process, the particle fitness decreases rapidly in the first 50 steps. This manifests that the XGBoost parameter combination of individual and global optimal particles makes the objective function of the classification model continuously decline. That is, the loss function value between the predicted level and the actual level of failure risk decreases, and the complexity regularisation penalty function also decreases. After 50 steps, the fitness function tends to be stable, which indicates that most of the particles have found an optimal XGBoost parameter combination and that PSO is basically converged.
Figure 2. Training Curve of particle fitness.
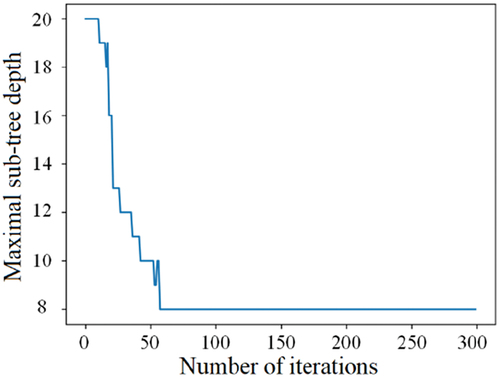
The optimisation of the iteration step and the maximal sub-tree depth is shown in respectively. With the continuous swarm evolution of particles, the iteration step is finally stable at about 105, and the maximal sub-tree depth is finally stable at 8. The XGBoost model corresponding to the global optimal particle after iterations are completed, that is, the particle with the lowest fitness, is used as the final power distribution network failure risk prediction model.
Figure 3. Training curve of iteration step.
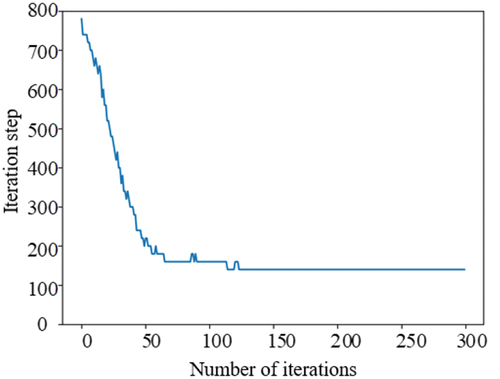
Figure 4. Training curve of the maximal sub-tree depth.
5.2. Multi-model comparison
To verify the competitiveness of our method, this paper compares it with three classical methods – back propagation neural network, support vector machine and random forest.
Back propagation neural network (BPNN) (Zhang, Lim, and K et al. Citation2017) is constituted by multiple fully connected layers and trained by computing the gradient of the loss work for a single weight by the chain rule. In order to make a reasonable comparison with our PSO-XGBoost model, the BPNN model adopts six hidden layers, each layer adopting 16 neurons equal to the maximum number of leaf nodes of XGBoost, with a learning rate of 0.001. The training cycle is 2,000 times.
Support Vector Machine (SVM) (Zhao, Tao, and Zio et al. Citation2016) is a type of generalised linear or non-linear classifier that performs binary classification on data by supervised learning. For experiments, the SVM model adopts radial basis kernel function and interclass unbalanced weight adjustment mechanism; the number of decision trees of random forest is set to 300, and interclass unbalanced weight adjustment mechanism is also adopted. The training cycle is 2,000 times.
Random Forest (Breiman Citation2001) is a supervised machine learning algorithm made up of decision trees and can be used for both classification and regression. The maximum number of leaf nodes and the number of decision trees of a random forest are set identically to those of XGBoost model.
The specific prediction on the test set of the above three methods and the PSO-XGBoost method adopted by this paper are shown in .
Table 3. Prediction results on testing dataset.
In terms of the prediction performance on the whole samples, our method has the highest accuracy among the four methods. XGBoost, by introducing the second derivative of the loss function on the prediction results and adding the tree model complexity as a regularisation term to the objective function can prevent overfitting and improve the generalisation performance of the model. As shown in , the accuracy is 7.41% higher than that of BPNN, 5.1% higher than that of SVM and 1.51% higher than that of random forest. The decision tree classifier can effectively balance the numeric relationship between labels and identify the samples of failure risk levels more comprehensively. F1-score is 12.84% higher than that of BPNN, 9.03% higher than that of SVM and 2.75% higher than that of random forest. Overall, this method is practically effective in power distribution network failure risk prediction.
shows that the sample sizes of the failure risk levels vary greatly. The label with the smallest sample size has the highest failure risk, so more adequate operation and maintenance inspection must be carried out than for the other risk levels. Therefore, we should attach great importance to the prediction recognition rate of the model at this level. As shown in , the recall rates of our method and random forest at level 3 are both 100%, indicating that all samples of this level are identified. In contrast, the recall rates of BPNN and SVM are only 75%, indicating that some samples at this level are missed, which may lead to the delay of operation and maintenance plans. At the same time, the accuracy and recall rate at the other levels of our method are always better than those of the other three methods, and exceed 75% in all cases. Our method balances the sample distribution of failures at all levels and has a more balanced prediction and classification performance.
5.3. Sorting of the importance of weather features
XGBoost has the function of sorting the importance of features (Chen, He, and Benesty Citation2015). The importance of each feature recorded by a leaf node in each tree is quantified by the reduction in the number of times and degree of the objective function when each node splits. The greater number of times or degrees of the objective function reduced by a feature suggests that the feature is selected by more subtree features, so it is more important to solve the problem.
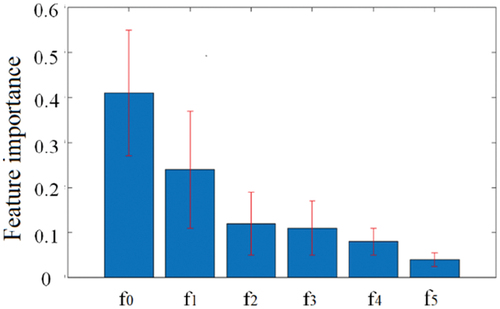
The importance of the weather features mined by this model is shown in and . The longitudinal axis in represents the association rules between weather features and failure risk levels, and the sum is one. The influence degrees from high to low are weekly maximum wind speed, weekly maximum precipitation, weekly lightning days, weekly average wind speed, weekly average precipitation, and weekly precipitation days. Combined with the failure cases of the city, further analysis tells us that the frequency of gale weather is high, so the number of failure samples covering this feature is huge and the association rules are close. Although the frequency of lightning weather is low, its damage to power distribution network is usually big, so it also has a high importance, ranked third. The city has many light rain days, and the number of precipitation days is big, but the precipitation is not big in most situations, so its importance is the least.
Figure 5. Weather feature importance.
The significance of sorting the importance of weather features is that when a more important weather occurs, the power grid maintenance company should improve the vigilance against power distribution network failure and strengthen operation and maintenance in the corresponding area (MA, CHEN, and WANG Citation2018). Especially when the failure prediction model gives a high failure risk level, personnel arrangement and material reserve should be done well. In this way, once a failure occurs, emergency maintenance can be completed as soon as possible, so as to shorten the duration of power failure and reduce the scope of power failure.
The city discussed in this section is of subtropical monsoon climate, which is widely distributed in the south of the Huaihe River in the Qinling Mountains and north of the tropical monsoon climate in eastern China. Therefore, the power grid maintenance companies in these areas could refer from each other’s preparation plans, especially the model result of the discussed city, to make the power distribution more reliable.
6. Conclusion
This paper establishes a failure prediction model of power distribution networks by combining particle swarm optimisation (PSO) and extreme gradient boosting (XGBoost). By searching for the important parameters of XGBoost model structure with PSO, we find the optimal parameter combination suitable for the problem herein, and relieve the low accuracy problem caused by the empirical preset parameters. At the same time, XGBoost can effectively mine the association rules between weather features and failure risk levels to provide a reference for pre-research of determining the power distribution network working conditions through weather types. Through the simulation of power distribution network failure cases in a certain East China city within 7 years, the accuracy of failure risk prediction on the test set reaches 96.19%, which is higher than that of the other machine learning methods. The effectiveness of this method is thus verified. In the future, we will make efforts to improve our model performance on small dataset and will continue to collect data samples as much as possible to make our dataset and model more diverse.
Disclosure statement
No potential conflict of interest was reported by the author(s).
Additional information
Funding
References
- Breiman, L. 2001. “Random forests[J].” Machine Learning 45 (1): 5–32. doi:10.1023/A:1010933404324.
- Chen, T Q, and C. Guestrin 2016. “XGBoost:A Scalable Tree Boosting System[C].” ACM SIGKDD 2016 Conference on Knowledge Discovery and Data Mining, San Francisco, USA, 785–795.
- Chen, T, T He, and M Benesty. 2015. “Xgboost: Extreme Gradient boosting[J]”. R package version 0.4-2. 1–4.
- Hanqing, LIANG, LIU Yadong, SHENG Gehao, et al. 2017. “Research on Method for Obtaining Key Transient Information of Transmission Line at Unsymmetrical Earth Fault [J].” Power System Technology 41 (8): 2702–2711.
- Hongbin, WANG, FANG Jian, HE Jiaxing, et al. 2019. “A Review of Resilient Distribution Network under Extreme disasters[J].” Distribution and Utilization 36 (7): 20–29.
- Hui, HOU, GENG Hao, HUANG Yong, et al. 2019. “Multi-factor Correction Based Failure Prediction Method of Transmission Line with Typhoon Disaster[J].” Automation of Electric Power Systems 43 (23): 193–201+233.
- Kai, Song, Yan Feng, Ding Ting, et al. 2020. “A Steel Property Optimization Model Based on the XGBoost Algorithm and Improved PSO[J]”. Computational Materials Science 174(C).
- Kennedy, J, and R Eberhart.1995. “Particle Swarm optimization[C].” Proceedings of ICNN95-International Conference on Neural Networks, Perth, Australia. 1942–1948.
- MA, S, B CHEN, and Z. WANG. 2018. “Resilience Enhancement Strategy for Distribution Systems under Extreme Weather events[J].” IEEE Transactions on Smart Grid 9 (2): 1442–1451. doi:10.1109/TSG.2016.2591885.
- Rui, LI, LI Yue, SU Jian, et al. 2011. “Power Supply Interruption Cost of Important Power Consumers in Distribution Network and Its Emergency Management [J].” Power System Technology 35 (10): 170–176.
- Shi, Y, and R Eberhart . 2002. “Empirical Study of Particle Swarm optimization[C].” Congress on Evolutionary Computation, IEEE, Washington, DC, USA, 6-9 July 1999.
- Shouxiang, WANG, HUANG Renshan, PAN Zhixin, et al. 2020. “Construction and Evaluation of Resilience Restoration Capability Indices for Distribution NetworkUnder Extreme Ice and Snow Weather[J].” High Voltage Engineering 46 (1): 123–132.
- Tewei, XU, LU Zongxiang, QIAO Ying, et al. 2017. “A Risk Warning Method for Urban Distribution Network Based on Associated Recognition of Typical Fault and Environment Scenario[J].” Power System Technology 41 (8): 2577–2584.
- Wen, ZHANG, SHENG Wanxing, LIU Keyan, et al. 2018. “A Prediction Method of Fault Risk Level for Distribution Network considering Correlation of Weather Factors[J].” Power System Technology 42 (8): 2391–2398.
- Xiangyang, PENG, HUANG Zhiwei, and DAI Zhiwei. 2010. “Analysis on the Cause of Distribution Lines’s Damage during Typhoon and Counteract measures[J].” Southern Power System Technology 4 (1): 99–102.
- Xiaomin, ZHOU, GE Shaoyun, LI Teng, et al. 2018. “Assessing and Boosting resilience of Distribution System under Extreme weather[J].” Proceedings of the CSEE 38 (2): 505–513, 681.
- Xiuchen, JIANG, LIU Yadong, FU Xiaofei, et al. 2019. “Construction Ideas and Development Trends of Transmission and Distribution[J].” High Voltage Engineering 45 (5): 1345–1351.
- Yong, HUANG, WEI Ruizeng, ZHOU Enze, et al. 2018. “Early Warning Method of Transmission Line Damage under Typhoon disaster[J].”.Automation of Electric Power Systems 42 (23): 142–150.
- Zhang, C, P Lim, Qin A K, et al. 2017. “Multi-objective Deep Belief Networks Ensemble for Remaining Useful Life Estimation in Prognostics [J].” IEEE Transactions on Neural Networks and Learning Systems 28 (10): 2306~2318. DOI:10.1109/TNNLS.2016.2582798.
- Zhao, W, T Tao, E Zio, et al. 2016. “A Novel Hybrid Method of Parameters Tuning in Support Vector Regression for Reliability Prediction:particle Swarm Optimization Combined with Analytical selection[J].” IEEE Transactions on Reliability 65 (3): 1393–1405. DOI:10.110/TR.2016.2515581.
- ZHAO, S, D ZENG, W WANG, et al. 2020. “Mutation Grey Wolf Elite PSO Balanced XGBoost for Radar Emitter Individual Identification Based on Measured signals[J].” Measurement 159: 107777.