
 ?Mathematical formulae have been encoded as MathML and are displayed in this HTML version using MathJax in order to improve their display. Uncheck the box to turn MathJax off. This feature requires Javascript. Click on a formula to zoom.
ABSTRACT
In this study, we evaluated the predictive performance of an adaptive neuro-fuzzy inference system (ANFIS) with six different membership functions (MFs). Using a geographic information system (GIS), we applied ANFIS to land subsidence susceptibility mapping (LSSM) in the study area of Amol County, northern Iran. As a novelty, we derived a land subsidence inventory from the differential synthetic aperture radar interferometry (DInSAR) of two Sentinel-1 images. We used 70% of surface subsidence deformation areas for training, while 30% were reserved for testing and validation. We then investigated regions that are susceptible to subsidence via the ANFIS method and evaluated the resulting prediction maps using receiver operating characteristics (ROC) curves. Out of the six different versions, the most accurate map was generated with a Gaussian membership function, yielding an accuracy of 84%.
1. Introduction
Surface deformations like land subsidence are natural hazard phenomena, which can cause vast damage to the land (Feizizadeh et al. Citation2014a). Land subsidence moves in a vertical direction within a small angle (Xue et al. Citation2005, Shi et al. Citation2016). It can occur suddenly or gradually. The most prominent cause of this type of deformation is a structural weakness of the underground layers (Ashraf and Cawood Citation2015). This weakness is usually caused by human activities, such as mineral extraction from underground sources (Dehghani et al. Citation2014). In our study area, a decline in the aquifer level caused by several wells is one of the main reasons for land subsidence. This surface deformation is harmful to human lives, properties and the environment.
In this study, we used the DInSAR data for measuring surface subsidence in Amol County. This type of data has been used to measure/monitor the land subsidence in several previous studies; for instance, Ge et al. (Citation2007) used DInSAR data to measure the land subsidence caused by mining activities. Amelung et al. (Citation1999) used InSAR data to measure the subsidence rate before and after artificial recharge in the Las Vegas Valley. Bell et al. (Citation2008) used the same data to detect ground surface variations caused by groundwater pumping and artificial recharge, both seasonally and in the long term. Kim et al. (Citation2010) measured and predicted land subsidence areas using InSAR data in conjunction with hyperbolic models. Qu et al. (Citation2015) used multi-temporal InSAR data to map the spatial and temporal differences of the land surface deformation in the Houston–Galveston region in Texas. In the case of Iran, Anderssohn et al. (Citation2008) and Dehghan-Soraki et al. (Citation2015) applied the same data to analyse and measure the surface deformation in the northeastern and northwestern parts of the country, respectively. Nowadays, DInSAR is considered as a sophisticated method of space geodesy to monitor different aspects of land deformations. DInSAR’s wide spatial coverage and its sensitivity to vertical surface deformations make it a popular method for measuring land subsidence (Karimzadeh Citation2016). One of the most recent works about land subsidence was carried out by Shrestha et al. (Citation2017), who used the Shetran hydrological modelling system (http://research.ncl.ac.uk/shetran/), which is a system of integrated surface and subsurface modelling for land subsidence estimation.
The simultaneous use of remote sensing (RS), GIS and surface deformation observations, along with an appropriate model, has been shown to produce satisfactory results for monitoring natural hazards (Contreras et al. Citation2016). Generating models to identify areas of possible future land subsidence through susceptibility mapping is a widely accepted approach to hazard mitigation (Lee et al. Citation2012). Such models are useful for environmental planning managers and stakeholders to control the adverse impacts of this phenomenon (VaeziNejad et al. Citation2011). Land subsidence susceptibility mapping is a practical approach to identify high-risk regions. The spatial models with a variety of related factors and parameters have produced fairly good results for this aim (Feizizadeh and Blaschke Citation2013). GIS as a spatial model and well-organized datasets such as satellite images are necessary to monitor any natural hazard (Janssen Citation2007). Several recent studies have been conducted to map regions susceptible to natural hazards based on surface deformation. These studies used a range of methods, such as global positioning system survey methods (GPS, Abidin et al. Citation2007, Ge et al. Citation2014, Citation2017), artificial neural networks (ANN, Lee et al. Citation2012, Chen et al. Citation2017a), multi-criteria decision analysis (Feizizadeh and Blaschke Citation2014, Ashraf and Cawood Citation2015, Ghorbanzadeh et al. Citation2017), logistic regression analysis (Oh and Lee Citation2011, LR, Pham et al. Citation2016), decision trees (Lee and Park Citation2013), k-nearest-neighbour analysis (k-NN, Pradhan and Jebur Citation2017), weights of evidence and support vector machines (WOE and SVM, Goetz et al. Citation2015, Okwuashi and Ndehedehe Citation2017), neuro-fuzzy systems (Vahidnia et al. Citation2010) and adaptive neuro-fuzzy inference systems (ANFIS, Sezer et al. Citation2011, Bui et al. Citation2012, Basser et al. Citation2014, Polykretis et al. Citation2017, Chen et al. Citation2017b). A literature review indicates that a variety of methods have been used for natural hazard mapping and susceptibility prediction.
Combining new methods is a common approach to obtaining more accurate results of susceptibility mapping (Feizizadeh and Kienberger Citation2017). To this end, our study combines the ANFIS method and DInSAR data to achieve more accurate results. Once provided with input and training data, ANFIS can run a fuzzy inference structure (Cakıt and Karwowski Citation2017). In this structure, the membership functions(MFs) take advantage of the hybrid learning algorithm of the ANN to adjust themselves to output function parameters (Bui et al. Citation2017). The ANFIS method with different MFs has previously been applied to model natural hazards such as landslides. We used this approach along with the DInSAR data for land subsidence prediction. The proper land subsidence investigation technique depends on the subsidence’s spatial extent and its magnitude (Koros and Agustin Citation2017). Our study utilized GIS capabilities along with the ANFIS method for LSSM in a three-stage research design. First, we prepared input layers from different sources and generated a training data layer from DInSAR data. Second, we produced LSSMs using input and training data with different MFs. Third, we evaluated the resulting displacement map and the final results generated from each MF.
2. Study area
The study area was Amol County, which is situated in the Mazandaran province in northern Iran (see ). This county is located on the southern coastline of the Caspian Sea, on the Mazandaran plain of the Haraz river delta. This area is bound to the south by the Alborz mountain range, which is characterized by steep slopes, with angles reaching over 47%. However, the vast majority of slopes in the centre and the north of the study area have gradients of less than 2%. The vegetation cover is almost homogeneous in the whole study area, except for the mountainous border areas in the south, which are covered by forest.
Figure 1. Study area: (a) north of Iran; (b) Amol County; (c) surface deformation map.
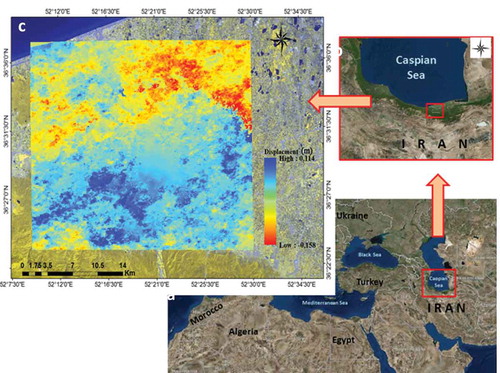
In general, SAR images are sensitive to the change of vegetation cover. Using a pair of SAR images acquired at times of varying vegetation cover can lead to a low coherence, even within a period of one month (Ge et al. Citation2007). To avoid vegetation cover changes, we selected two SAR images that were captured on the same day of August in two separate years for the present study.
Our study area is suitable for a wide range of agricultural activities such as rice production and orchards, which are the main sources of income for the local population. Although agriculture in this area is primarily dependent on rainfall, there are several wells that have been used for groundwater extraction. The widespread exploitation of groundwater resources makes Amol County subject to land subsidence. According to the Iranian Bureau of Statistics 2017 census dataset, the population rate in Amol County has increased dramatically over the past three decades. This growth can also be seen by the footprint of Amol city. As a result of the population growth in our study area, agricultural activities have increased and, consequently, water demand and groundwater extraction have greatly increased.
3. Input data
3.1. Related input factors
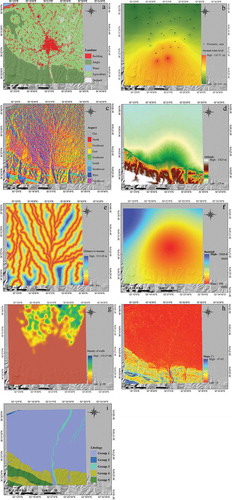
There are nine factors related to land subsidence in our study area: groundwater level, slope, elevation, distance to streams, well density, rainfall, land use, aspect and lithology (see ). The lithological elements of the lithology layer were aggregated to five groups that are summarized in . The Landsat satellite data that served as the basis of the land cover map have a spatial resolution of 30 m. Similarly, the digital elevation model (DEM) of the SRTM, which was used for the generation of derivatives like the slope and aspect layers, also has a 30 m spatial resolution. However, in this study, we aggregated pixels to a pixel size of 90 m to accelerate computations and analysis. The aggregation is suitable for the subsidence study, considering the influence of each layer on this phenomenon. The layers were also prepared in raster format for further analysis.
Table 1. Lithology of Amol County.
Figure 2. Nine input land subsidence factors used in the ANFIS model: (a) land use/cover; (b) ground water level; (c) aspect; (d) DEM; (e) distance to streams; (f) rainfall; (g) density of wells; (h) slope; (i) lithology.
3.2. Data generation for training and testing
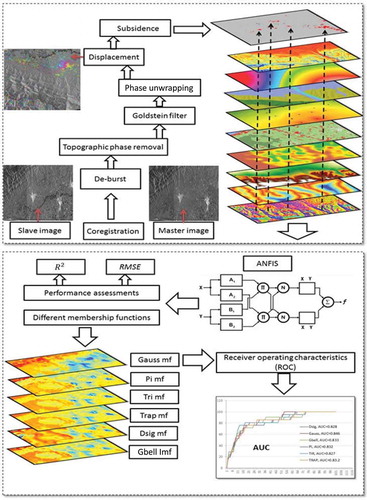
In this subsection, we summarize the generation process of our training and test data. There are some common surface deformation measurement systems that are used to monitor and measure land subsidence, such as precise theodolite vertical angles and electronic levels (Savvaidis Citation2003). These common systems are really useful, and the approximated accuracies are close to 10 mm. They are straightforward and suitable for small regions (Koros and Agustin Citation2017). Furthermore, since these systems are ground point-based, they are usually affected by some problems in the process of field surveying and information gathering (Nagaomo et al. Citation2007). Nowadays, monitoring of ground deformation hazards such as land subsidence is possible using remote sensing satellites. The land subsidence inventory database of the study area was created using DInSAR data. In this study, the interferometric wide swath (IW) modes of Sentinel-1 images were used for further processing. This satellite (launched by the European environmental monitoring program Copernicus in 2014) presents synthetic aperture radar (SAR) data for ground deformation applications (Yu et al. Citation2017). Two sets of SAR images acquired at different times are the main input for the approach (Barra et al. Citation2017). To avoid the impacts of vegetation cover changes our first and second selected images were taken on 22 August 2015 and 22 August 2017, respectively. The Sentinel-1 IW interferometric pair was coregistered by the precise orbit state vectors and DEM (Jiang et al. Citation2017). The next step was to generate an interferogram. Because Sentinel-1 applies the TOPS (Terrain Observation by Progressive Scan) imaging mode (De Zan and Guarnieri Citation2006), it is able to cover a wide area (Yagüe-Martínez et al. Citation2016). This leads to images being captured within a series of overlapping regions (Czikhardt et al. Citation2017). Therefore, the small difference within overlap bursts is advantageous for retrieving the horizontal motion of the ground parallel to the satellite path (Grandin et al. Citation2016). The noise of these bursts was removed in a de-bursting process. De-bursted stacks were used to subtract the topographic phase. A Goldstein filter (Goldstein and Werner Citation1998) was applied to the results to improve the phase measurement. This filter has also been effective in reducing phase noise and before the implementation of unwrapping process (Notti et al. Citation2015). The resulting deformation map is presented in , and all these steps are shown in . The resulting deformation map provides detailed information on surface deformation for landslides and land subsidence. However, in this study, we focused on just land subsidence. For more certainty, the subsidences that occurred with a magnitude of over 0.02 metres were selected for both training and test data. Seventy percent (6654 pixels) of these areas were randomly selected as training data.
4. Workflow
4.1. Land subsidence susceptibility mapping using ANFIS
The ANFIS method contains a hybrid model with different nodes and layers in a neural network, which can estimate the fuzzy parameters of the model (Polykretis et al. Citation2017). This method is a combination of both fuzzy logic and artificial neural networks (Dehnavi et al. Citation2015). presents two input values of x and y, and f as an output (Jang Citation1993, Armaghani et al. Citation2015).
Figure 3. ANFIS architecture (Asadpour et al. Citation2013).
Rule 1: If x is A1 and y is B1 then
f 1 = p1x+ q1y+ r1
Rule 2: If x is A2 and y is B2 then
f 2 = p2x+ q2y+ r2
The membership functions of x and y are,
,
,
, and output function parameters are
,
,
,
,
,
.
ANFIS consists of five different layers and two types of nodes, namely adaptive and fixed. The differences between the layers are illustrated as follows.
The input variables were fuzzified in the first layer
All nodes in the second layer are used to compute the strength of the rules. All nodes are fixed (shown by ∏ in ), and each of them determines the input and output signals (Zhang et al. Citation2017).
In the third layer, all nodes that are presented with an N are fixed (Asadpour et al. Citation2013). Further, the outputs are normalized for this layer.
All nodes in layer four are adaptive and described by the following equation:
This layer is the final layer. It is shown as Ʃ, which represents the summation. (Basser et al. Citation2014).
4.2. The hybrid learning algorithm
The ANFIS method utilizes an ANN learning algorithm to set up the fuzzy inference system (Tahmasebi and Hezarkhani Citation2012). This algorithm was used for the training part of the process. The main aim of training is to discover the minimum value of the error for the fuzzy inference system. The error is the difference between the target and the results of the method. The ANN learning algorithm is fully described by Bui et al. (Citation2012). The whole workflow is illustrated in .
Figure 4. The flowchart of the integrated methodology for land subsidence susceptibility mapping and accuracy assessment.
5. Results
5.1. The interferometric performances
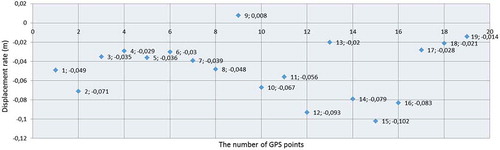
To validate the displacement map resulting from the interferometry process, we compared it against the ground truth data of the land subsidence inventory database, obtained from the Ministry of Water Resources of the Mazandaran Province (MWRMP, Citation2017) and the Ministry of Agricultural Resources for Mazandaran Province (MARMP, Citation2017). The land subsidence inventory database includes 19 land subsidence occurrences, or initial signs of land subsidence, within the study area; it consists of point data collected during field surveys using GPS locations (see ). The values of the resulting surface deformation map were extracted to the GPS points and are shown in .
Figure 5. The extracted values of the surface deformation map to the GPS points. The first number represents the point number and the second number indicates the surface deformation map’s value at its corresponding point.
The validation metric of precision (Guirado et al. Citation2017) was used to assess the reliability of the resulting map. In this regard, the ground truth GPS points located in the subsidence areas depicted by the surface deformation map are considered as true positives (TP), and the rest are false positives (FP). The precision can be calculated from the EquationEquation (7)(7)
(7) :
It can be seen from that there is just one GPS point (point 9) from the ground truth inventory database that does not match our resulting deformation map. According to the analysis of these GPS points, the precision for the displacement map is over 94%.
5.2. The predictive performances
In this study, LSSM was carried out for the Amol County using DInSAR and ANFIS techniques. To identify a suitable mapping technique for land subsidence, we chose the nine most related factors as input data, and the surface displacement layer was defined as the training and test dataset. All input factors were included in the GIS environment as raster layers, and each layer is composed of 97,645 pixels in total. The surface displacement layer was prepared using two different SAR images of the study area from the years 2015 and 2017. The DInSAR approach was used to generate the surface displacement layer. The whole process of the model, including training and testing, was implemented in MATLAB. Seventy percent of land subsidence areas served as the training data, while the rest were divided randomly into two separate parts consisting of 2852 pixels for testing and the same number of pixels for evaluation (see ). Our ANFIS method was implemented with six different types of MFs. Fifty epochs were used for training.
5.3. Comparison of land subsidence susceptibility maps
In this subsection, we summarize the performance assessments of the method. The performance assessments were tested with two validating statistical parameters, namely, the root mean square error (RMSE; EquationEquationEquation (8)(8)
(8) )
(8)
(8) and the coefficient of determination (R2; EquationEquation (9)
(9)
(9) ), as recommended by other researchers, such as Bui et al. (Citation2012), Folorunsho et al. (Citation2012), Chai and Draxler (Citation2014) and Singh et al. (Citation2017).
where and
are the ith observed and result of the model respectively. Low RMSE values indicate better results (Popoola et al. Citation2017), while R2 values closer to 1 show a better fit between the results and training data (Bui et al. Citation2012). According to , the approach revealed the best performance when using a Gaussian MF, which yielded a RMSE value of more than 0.15 and an R2 value of 0.9253. The values of the resulting maps vary from 0 to 1, where a value of 0 indicates a very low susceptibility to land subsidence and 1 a very high susceptibility (see )
Table 2. Description of MFs and statistical criteria for RMSE, R2.
6. Validation and discussion
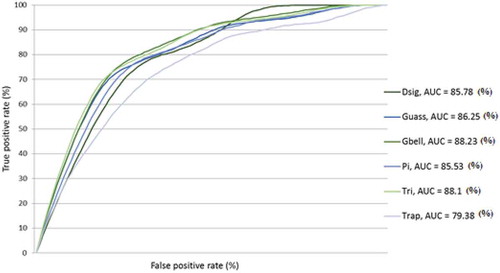
Validation is considered to be an important phase in preparing susceptibility maps to predict possible future natural hazards (Pourghasemi et al. Citation2012, Feizizadeh et al. Citation2014b). In our study, the layer of surface deformation generated from Sentinel-1 data was used for this aim (see ). As previously mentioned, 2852 pixels of land subsidence areas were reserved for the validation section. The receiver operating characteristics (ROC) curves (Shadman Roodposhti et al. Citation2016) were used to validate the resulting maps within validation data. This validation approach shows the full scene of trade-off between the rate of TPs and that of FPs at all possible levels of positivity for the studied case (Liu et al. Citation2005, Baird et al. Citation2013). These curves were calculated for all six resulting LSSMs. The vertical axis presents the rate of true positives, while the horizontal axis shows the rate of false positives (see ) (Sezer et al. Citation2011, Feizizadeh and Ghorbanzadeh Citation2017). TPs are the pixels that correctly referred to land subsidence and FPs are the pixels incorrectly labelled as land subsidence. Generating ROC curves involves first obtaining the correctly and incorrectly labelled pixels in the validation data and then plotting TPs vs. FPs across the whole range of values (Linden Citation2006). Based on the theory behind the ROC, the area under the curve (AUC) is a single measure that represents the accuracy of the results of the prediction methods (Oh and Pradhan Citation2011). The AUC indicates the probability that the value of a correctly labelled pixel will exceed the value of an incorrectly labelled pixel. One of the benefits of this measure is that its output values are easy to interpret. A greater AUC value shows a higher accuracy of the model. A value close to 1 represents a perfect model with the highest accuracy; a value of 0.5 indicates a worthless model (the results of the model are the same as chance). Although there is no defined standard for comparing the results of the AUC, there are some studies that have employed a number of intervals with linguistic measurements or meaning (Baird et al. Citation2013). For instance:
0.90–1 = excellent
0.80–0.90 = good
0.70–0.80 = fair
0.60–0.70 = poor
0.50–0.60 = fail
According to these intervals, almost all of our results are categorized as good performance.
Although all the results of the ANFIS method with different membership functions are relatively close to each other and categorized on the same level, Gbell MF (0.882) yielded the best result (see ). This MF approach also achieved high R2 values and low values of RMSE in the comparison of susceptibility map appearances. This matter indicates a meaningful relationship between the accuracy of the model within the training and testing process and also the overall accuracy of the model’s outputs. In this study, using the ANFIS method with the Gbell MF approach resulted in a fairly good model for land subsidence prediction. The profiles of cumulative vertical surface deformation predicted a probability represented in , which also shows that the pixel values of LSSM derived from the Gbell MF vary at a moderate interval. Such moderate variation is more logical for our case study, since, based on the subsidence information from DInSAR (see ), there is not a severe deformation in this plain. The produced LSSMs show that the northeastern parts of the study area are more susceptible to land subsidence. This shows the impact of groundwater extraction on this phenomenon. According to the layer of well-density, there are more wells in the northeastern areas, which have led to a reduction in the groundwater level. Therefore, it is fair to say that land subsidence in Amol County is caused by groundwater extraction.
Figure 6. Training and validation data, with the location of GPS points.
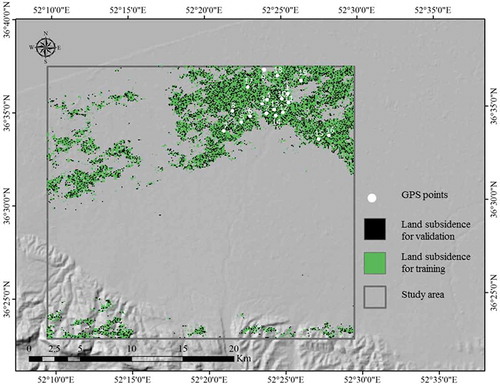
Figure 7. Land subsidence susceptibility maps using the ANFIS model with six different MFs, namely: (a) Dsig MF; (b) Gauss MF; (c) Gbell MF; (d) Pi MF; (e) Trap MF; (f) Tri MF.
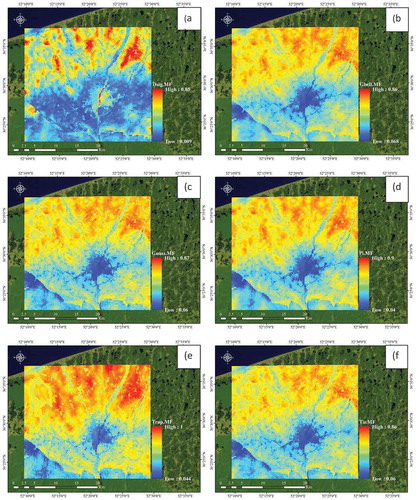
Figure 8. ROC curves for the resulting maps of the six MFs.
7. Conclusion
Land subsidence is one of the most severe natural hazards in Iran. Amol County is particularly susceptible to surface deformation with potentially severe consequences. GIS techniques along with ANFIS were used for LSSM in Amol County using six different MFs. The ANFIS method was structured for land subsidence susceptibility mapping. Sentinel-1 data were used for generating both training and test data, and a validation step was done for the final results. As the quality of the results of the ANFIS method highly depends on the quality of the training data, the surface deformation layer generated within the DInSAR approach provided fairly appropriate data for LSSM. Moreover, the accuracy of this method depends on the selection of the MFs. In summary, the ANFIS method is a technical method which is sensitive to the quality and quantity of training data and parameter selection during the whole process. However, the method is less dependent on user decisions and expert knowledge, which are usually prone to uncertainties. The drawback of the method is that the absolute importance of each factor is relatively hazy. The results of this work can be useful for prioritization of efforts to mitigate adverse consequences of surface deformations, specially land subsidence.
Acknowledgements
We would like to thank the Ministries of Water Resource and Agriculture of the Mazandaran Province, Iran, for their support.
Disclosure statement
No potential conflict of interest was reported by the authors.
Additional information
Funding
References
- Abidin, H.Z., et al., 2007. Studying landslide displacements in the ciloto area (Indonesia) using GPS surveys. Journal of Spatial Science, 52 (1), 55–63. doi:10.1080/14498596.2007.9635100
- Amelung, F., et al., 1999. Sensing the ups and downs of Las Vegas: InSAR reveals structural control of land subsidence and aquifer-system deformation. Geology, 27 (6), 483–486. doi:10.1130/0091-7613(1999)027<0483:STUADO>2.3.CO;2
- Anderssohn, J., et al., 2008. Land subsidence pattern controlled by old alpine basement faults in the Kashmar Valley, northeast Iran: results from InSAR and levelling. Geophysical Journal International, 174 (1), 287–294. doi:10.1111/j.1365-246X.2008.03805.x
- Armaghani, D.J., et al., 2015. Application of two intelligent systems in predicting environmental impacts of quarry blasting. Arabian Journal of Geosciences, 8 (11), 9647–9665. doi:10.1007/s12517-015-1908-2
- Asadpour, V., Ravanfar, M.R., and Fazel-Rezai, R., 2013. Adaptive network fuzzy inference systems for classification in a brain computer interface. In: R. Fazel-Rezai, ed. Brain-computer interface systems: Recent progress and future prospects. London: IntechOpen, 43–59.
- Ashraf, H. and Cawood, F., 2015. Geospatial subsidence hazard modelling at Sterkfontein Caves. South African Journal of Geomatics, 4 (3), 273–284. doi:10.4314/sajg.v4i3.8
- Baird, C., et al., 2013. A comparison of risk assessment instruments in juvenile justice. Madison, WI: National Council on Crime and Delinquency.
- Barra, A., et al., 2017. A methodology to detect and update active deformation areas based on sentinel-1 SAR images. Remote Sensing, 9 (10), 1002. doi:10.3390/rs9101002
- Basser, H., et al., 2014. Adaptive neuro-fuzzy prediction of the optimum parameters of protective spur dike. Natural Hazards, 73 (3), 1439–1449. doi:10.1007/s11069-014-1145-0
- Bell, J.W., et al., 2008. Permanent scatterer InSAR reveals seasonal and long‐term aquifer‐system response to groundwater pumping and artificial recharge. Water Resources Research, 44 (2). doi:10.1029/2007WR006152
- Bui, D.T., et al., 2017. A hybrid artificial intelligence approach using GIS-based neural-fuzzy inference system and particle swarm optimization for forest fire susceptibility modeling at a tropical area. Agricultural and Forest Meteorology, 233, 32–44. doi:10.1016/j.agrformet.2016.11.002
- Bui, D.T., et al., 2012. Landslide susceptibility mapping at Hoa Binh province (Vietnam) using an adaptive neuro-fuzzy inference system and GIS. Computers & Geosciences, 45, 199–211. doi:10.1016/j.cageo.2011.10.031
- Cakıt, E. and Karwowski, W., 2017. Predicting the occurrence of adverse events using an adaptive neuro-fuzzy inference system (ANFIS) approach with the help of ANFIS input selection. Artificial Intelligence Review, 48 (2), 139–155. doi:10.1007/s10462-016-9497-3
- Chai, T. and Draxler, R.R., 2014. Root mean square error (RMSE) or mean absolute error (MAE)?–arguments against avoiding RMSE in the literature. Geoscientific Model Development, 7 (3), 1247–1250. doi:10.5194/gmd-7-1247-2014
- Chen, W., et al., 2017b. Spatial prediction of landslide susceptibility using an adaptive neuro-fuzzy inference system combined with frequency ratio, generalized additive model, and support vector machine techniques. Geomorphology, 297, 69–85. doi:10.1016/j.geomorph.2017.09.007
- Chen, W., Pourghasemi, H.R., and Zhao, Z., 2017a. A GIS-based comparative study of Dempster-Shafer, logistic regression and artificial neural network models for landslide susceptibility mapping. Geocarto International, 32 (4), 367–385. doi:10.1080/10106049.2016.1140824
- Contreras, D., et al., 2016. Monitoring recovery after earthquakes through the integration of remote sensing, GIS, and ground observations: the case of L’Aquila (Italy). Cartography and Geographic Information Science, 43 (2), 115–133. doi:10.1080/15230406.2015.1029520
- Czikhardt, R., et al., 2017. Ground stability monitoring of undermined and landslide prone areas by means of sentinel-1 multi-temporal InSAR, case study from Slovakia. Geosciences, 7 (3), 87. doi:10.3390/geosciences7030087
- De Zan, F. and Guarnieri, A.M., 2006. TOPSAR: terrain observation by progressive scans. IEEE Transactions on Geoscience and Remote Sensing, 44 (9), 2352–2360. doi:10.1109/TGRS.2006.873853
- Dehghani, M., et al., 2014. Interferometric SAR and geospatial techniques used for subsidence study in the Rafsanjan plain. American Journal of Environmental Engineering, 4 (2), 32–40.
- Dehghan-Soraki, Y., Sharifikia, M., and Sahebi, M.R., 2015. A comprehensive interferometric process for monitoring land deformation using ASAR and PALSAR satellite interferometric data. GIScience & Remote Sensing, 52 (1), 58–77. doi:10.1080/15481603.2014.989774
- Dehnavi, A., et al., 2015. A new hybrid model using step-wise weight assessment ratio analysis (SWARA) technique and adaptive neuro-fuzzy inference system (ANFIS) for regional landslide hazard assessment in Iran. Catena, 135, 122–148. doi:10.1016/j.catena.2015.07.020
- Feizizadeh, B. and Blaschke, T., 2013. Land suitability analysis for Tabriz County, Iran: a multi-criteria evaluation approach using GIS. Journal of Environmental Planning and Management, 56 (1), 1–23. doi:10.1080/09640568.2011.646964
- Feizizadeh, B. and Blaschke, T., 2014. An uncertainty and sensitivity analysis approach for GIS-based multicriteria landslide susceptibility mapping. International Journal of Geographical Information Science, 28 (3), 610–638. doi:10.1080/13658816.2013.869821
- Feizizadeh, B. and Ghorbanzadeh, O., 2017. GIS-based interval pairwise comparison matrices as a novel approach for optimizing an analytical hierarchy process and multiple criteria weighting. GI_Forum, 1, 27–35. doi:10.1553/giscience
- Feizizadeh, B., Jankowski, P., and Blaschke, T., 2014b. A GIS based spatially-explicit sensitivity and uncertainty analysis approach for multi-criteria decision analysis. Computers & Geosciences, 64, 81–95. doi:10.1016/j.cageo.2013.11.009
- Feizizadeh, B. and Kienberger, S., 2017. Spatially explicit sensitivity and uncertainty analysis for multicriteria-based vulnerability assessment. Journal of Environmental Planning and Management, 60 (11), 2013–2035.
- Feizizadeh, B., et al., 2014a. A GIS-based extended fuzzy multi-criteria evaluation for landslide susceptibility mapping. Computers & Geosciences, 73, 208–221. doi:10.1016/j.cageo.2014.08.001
- Folorunsho, J.O., et al., 2012. Application of adaptive neuro fuzzy inference system (Anfis) in River kaduna discharge forecasting. Research Journal of Applied Sciences, Engineering and Technology, 4 (21), 4275–4283.
- Ge, L., Chang, H.C., and Rizos, C., 2007. Mine subsidence monitoring using multi-source satellite SAR images. Photogrammetric Engineering & Remote Sensing, 73 (3), 259–266. doi:10.14358/PERS.73.3.259
- Ge, L., et al., 2017. Integrated space geodesy for mapping land deformation over Choushui River Fluvial Plain, Taiwan. International Journal of Remote Sensing, 38 (22), 6319–6345. doi:10.1080/01431161.2017.1353161
- Ge, L., et al., 2014. Land subsidence characteristics of Bandung Basin as revealed by ENVISAT ASAR and ALOS PALSAR interferometry. Remote Sensing of Environment, 154, 46–60. doi:10.1016/j.rse.2014.08.004
- Ghorbanzadeh, O., Feizizadeh, B., and Blaschke, T., 2017. Multi-criteria risk evaluation by integrating an analytical network process approach into GIS-based sensitivity and uncertainty analyses. Geomatics, Natural Hazards and Risk, 9 (1), 127–151.
- Goetz, J.N., et al., 2015. Evaluating machine learning and statistical prediction techniques for landslide susceptibility modeling. Computers & Geosciences, 81, 1–11. doi:10.1016/j.cageo.2015.04.007
- Goldstein, R.M. and Werner, C.L., 1998. Radar interferogram filtering for geophysical applications. Geophysical Research Letters, 25 (21), 4035–4038. doi:10.1029/1998GL900033
- Grandin, R., et al., 2016. Three‐dimensional displacement field of the 2015 Mw8. 3 Illapel earthquake (Chile) from across‐and along‐track Sentinel‐1 TOPS interferometry. Geophysical Research Letters, 43 (6), 2552–2561. doi:10.1002/2016GL067954
- Guirado, E., et al., 2017. Deep-learning convolutional neural networks for scattered shrub detection with google earth imagery. arXiv Preprint. arXiv:1706.00917.
- Jang, J.S., 1993. ANFIS: adaptive-network-based fuzzy inference system. IEEE Transactions on Systems, Man, and Cybernetics, 23 (3), 665–685. doi:10.1109/21.256541
- Janssen, V., 2007. Volcano deformation monitoring using GPS. Journal of Spatial Science, 52 (1), 41–54. doi:10.1080/14498596.2007.9635099
- Jiang, H.J., Pei, Y.Y., and Li, J., February 2017. Sentinel-1 TOPS interferometry for along-track displacement measurement. IOP Conference Series: Earth and Environmental Science, 57 (1), 012019. doi:10.1088/1755-1315/57/1/012019
- Karimzadeh, S., 2016. Characterization of land subsidence in Tabriz basin (NW Iran) using InSAR and watershed analyses. Acta Geodaetica Et Geophysica, 51 (2), 181–195. doi:10.1007/s40328-015-0118-4
- Kim, S.W., et al., 2010. Measurements and predictions of subsidence induced by soil consolidation using persistent scatterer InSAR and a hyperbolic model. Geophysical Research Letters, 37, 5. doi:10.1029/2009GL041644
- Koros, W.K. and Agustin, F., 2017. Subsidence surveys at Olkaria geothermal field, Kenya. Journal of Spatial Science, 62 (1), 195–205.
- Lee, S. and Park, I., 2013. Application of decision tree model for the ground subsidence hazard mapping near abandoned underground coal mines. Journal of Environmental Management, 127, 166–176. doi:10.1016/j.jenvman.2013.04.010
- Lee, S., Park, I., and Choi, J.K., 2012. Spatial prediction of ground subsidence susceptibility using an artificial neural network. Environmental Management, 49 (2), 347–358. doi:10.1007/s00267-011-9766-5
- Linden, A., 2006. Measuring diagnostic and predictive accuracy in disease management: an introduction to receiver operating characteristic (ROC) analysis. Journal of Evaluation in Clinical Practice, 12 (2), 132–139. doi:10.1111/j.1365-2753.2005.00598.x
- Liu, H., et al., 2005. Testing statistical significance of the area under a receiving operating characteristics curve for repeated measures design with bootstrapping. Journal of Data Science, 3 (3), 257–278.
- MARMP: Ministry of agricultural resource for Mazandaran Province, 2017. Land capability assessment in Amol County. Amol County, Iran: National project.
- MWRMP: Ministry of water resource for Mazandaran Province, 2017. Ground water depth assessment in Amol County. Amol County, Iran: National project.
- Nagaomo, S., Fujisuka, T., and Sato, I., 2007. The experimental approach of the regional surface deformation using satellite radar data. Chubu Japan Geotech Symposium, 19, 53–62.
- Notti, D., et al., 2015. A user-oriented methodology for DInSAR time series analysis and interpretation: landslides and subsidence case studies. Pure and Applied Geophysics, 172 (11), 3081–3105. doi:10.1007/s00024-015-1071-4
- Oh, H.J. and Lee, S., 2011. Integration of ground subsidence hazard maps of abandoned coal mines in Samcheok, Korea. International Journal of Coal Geology, 86 (1), 58–72. doi:10.1016/j.coal.2010.11.009
- Oh, H.J. and Pradhan, B., 2011. Application of a neuro-fuzzy model to landslide-susceptibility mapping for shallow landslides in a tropical hilly area. Computers & Geosciences, 37 (9), 1264–1276. doi:10.1016/j.cageo.2010.10.012
- Okwuashi, O. and Ndehedehe, C., 2017. Tide modelling using support vector machine regression. Journal of Spatial Science, 62 (1), 29–46.
- Pham, B.T., et al., 2016. A comparative study of different machine learning methods for landslide susceptibility assessment: a case study of Uttarakhand area (India). Environmental Modelling & Software, 84, 240–250. doi:10.1016/j.envsoft.2016.07.005
- Polykretis, C., Chalkias, C., and Ferentinou, M., 2017. Adaptive neuro-fuzzy inference system (ANFIS) modeling for landslide susceptibility assessment in a Mediterranean hilly area. Bulletin of Engineering Geology and the Environment, 1–15.
- Popoola, O.M., Munda, J., and Mpanda, A., 2017. Residential lighting load profile modelling: ANFIS approach using weighted and non-weighted data. Energy Efficiency, 90, 29–40.
- Pourghasemi, H.R., Pradhan, B., and Gokceoglu, C., 2012. Application of fuzzy logic and analytical hierarchy process (AHP) to landslide susceptibility mapping at Haraz watershed, Iran. Natural Hazards, 63 (2), 965–996. doi:10.1007/s11069-012-0217-2
- Pradhan, B. and Jebur, M.N., 2017. Spatial prediction of landslide-prone areas through k-nearest neighbor algorithm and logistic regression model using high resolution airborne laser scanning data. In: B. Pradhan, ed., Laser scanning applications in landslide assessment. Cham, Switzerland: Springer International Publishing, 151–165.
- Qu, F., et al., 2015. Mapping ground deformation over Houston–galveston, Texas using multi-temporal InSAR. Remote Sensing of Environment, 169, 290–306. doi:10.1016/j.rse.2015.08.027
- Savvaidis, P.D., 2003. Existing landslide monitoring systems and techniques. In: Proceedings of the conference from stars to earth and culture: In honor of the memory of Prof. Alexandros Tsioumis. Thessaloniki, Greece: The Aristotle University of Thessaloniki, 242–258.
- Sezer, E.A., Pradhan, B., and Gokceoglu, C., 2011. Manifestation of an adaptive neuro-fuzzy model on landslide susceptibility mapping: klang valley, Malaysia. Expert Systems with Applications, 38 (7), 8208–8219. doi:10.1016/j.eswa.2010.12.167
- Shadman Roodposhti, M., et al., 2016. Fuzzy shannon entropy: a hybrid GIS-based landslide susceptibility mapping method. Entropy, 18 (10), 343. doi:10.3390/e18100343
- Shi, X., et al., 2016. The effects of artificial recharge of groundwater on controlling land subsidence and its influence on groundwater quality and aquifer energy storage in Shanghai, China. Environmental Earth Sciences, 75 (3), 195. doi:10.1007/s12665-015-5019-x
- Shrestha, P.K., et al., 2017. Model-based estimation of land subsidence in Kathmandu Valley, Nepal. Geomatics, Natural Hazards and Risk, 8 (2), 974–996.
- Singh, R., et al., 2017. Prediction of geomechanical parameters using soft computing and multiple regression approach. Measurement, 99, 108–119. doi:10.1016/j.measurement.2016.12.023
- Tahmasebi, P. and Hezarkhani, A., 2012. A hybrid neural networks-fuzzy logic-genetic algorithm for grade estimation. Computers & Geosciences, 42, 18–27. doi:10.1016/j.cageo.2012.02.004
- VaeziNejad, S.M., Tofigh, M.M., and Marandi, S.M., 2011. Zonation and prediction of land subsidence (case study-Kerman, Iran). International Journal of Geosciences, 2 (02), 102. doi:10.4236/ijg.2011.22011
- Vahidnia, M.H., et al., 2010. A GIS-based neuro-fuzzy procedure for integrating knowledge and data in landslide susceptibility mapping. Computers & Geosciences, 36 (9), 1101–1114. doi:10.1016/j.cageo.2010.04.004
- Xue, Y.Q., et al., 2005. Land subsidence in China. Environmental Geology, 48 (6), 713–720. doi:10.1007/s00254-005-0010-6
- Yagüe-Martínez, N., et al., 2016. Interferometric processing of Sentinel-1 TOPS data. IEEE Transactions on Geoscience and Remote Sensing, 54 (4), 2220–2234. doi:10.1109/TGRS.2015.2497902
- Yu, L., et al., 2017. The 2015–2016 ground displacements of the Shanghai coastal area inferred from a combined COSMO-SkyMed/Sentinel-1 DInSAR analysis. Remote Sensing, 9 (11), 1194. doi:10.3390/rs9111194
- Zhang, N., et al., 2017. Groundwater depth predictions by GSM, RBF, and ANFIS models: a comparative assessment. Arabian Journal of Geosciences, 10 (8), 189. doi:10.1007/s12517-017-2954-8