
 ?Mathematical formulae have been encoded as MathML and are displayed in this HTML version using MathJax in order to improve their display. Uncheck the box to turn MathJax off. This feature requires Javascript. Click on a formula to zoom.
ABSTRACT
Rice is one of the most essential food crops in the world and accurate estimation of rice yield is a major content of agricultural research. Recently, scholars have used machine learning algorithms for rice yield estimation. However, there are few studies on rice yield prediction based on rice phenological stages. In this study, a method for rice yield prediction on the basis of rice phenology analysis was proposed. For this study, the cumulative NDVI and EVI based Logistic regression curves were carried out to determine the phenological period. Comparing several regression models, the results of the random forest regression model developed using phenology-based regression analysis performed better. The R2 of training and validation samples were 0.96 and 0.95, respectively, with RMSE of 0.06 ton/ha. This method is feasible for governments to predict rice yield and make farm risk management decisions.
1. Introduction
Food crops are essential resources for human survival, and with the world’s population constantly increasing, accurate yield estimation is critical for food reserves and economic decision-making (Yang et al. Citation2020). Rice is the major food crop in the world especially in Asia, where rice is grown widely and has a large yield (Wang et al. Citation2019, Yu et al. Citation2020). Thailand is a typical large rice-producing country and Thailand’s rice mainly includes main rice and second rice. Meanwhile, accurate estimation of rice yield is one of the main tasks of the Ministry of Agriculture and remote sensing technology has become one of the most important means in agricultural fields such as timely and accurate acquisition of paddy yield and dynamic monitoring of paddy growth (Vergouw et al. Citation2016, Arumugam et al. Citation2021).
Traditional rice yield estimation has certain defects and the method of relying on the field measurement of rice yield requires a lot of time and cost. Therefore, remote sensing technology has great advantages in the field of large-scale and accurate acquisition of food crop yield (Yang et al. Citation2020). In crop yield estimation, some scholars have widely used optical remote sensing image parameters, such as Normalised Difference Vegetation Index (NDVI), Enhanced Vegetation Index (EVI) and meteorological data (i.e. rainfall, etc.) as the main parameters for crop yield estimation (Rahman et al. Citation2012, Kouadio et al. Citation2014, Son et al. Citation2014, Liu et al. Citation2015, Yang et al. Citation2020, Islam et al. Citation2021). NDVI and EVI can reflect the phenological characteristics of rice to a certain extent. With the growth of rice, the NDVI and EVI values of rice will change significantly. Therefore, NDVI and EVI can be important optical parameters indicating the growth stages of rice. Liu et al. (Citation2015) obtained Landsat data of cotton at the flowering and boll stages in southern California, USA, and established a cotton yield estimation regression model using NDVI and EVI. In addition, some scholars have introduced Soil Adjustment Vegetation Index (SAVI) (Liaqat et al. Citation2017, Nazir et al. Citation2021), Ratio Vegetation Index (RVI) (Yang et al. Citation2020), Rice Growth Vegetation Index (RGVI) (Nuarsa et al. Citation2011), etc., to carry out rice yield assessment. Yang et al. (Citation2020) used vegetation index NDVI, EVI, RVI and other parameters to estimate rice yield in Jiutai, Changchun, China.
Although the above model can achieve better experimental results to a certain extent, the input variables of the model are relatively simple. Meanwhile, in tropical rice-growing areas, optical images are easily affected by clouds, fog and rain, resulting in poor image quality, such as Landsat and Sentinel-2. In contrast, microwave remote sensing images, such as synthetic aperture radar (SAR), are not affected by clouds, fog and rain, so that all images of rice growing season can be completely obtained. The dielectric constant of water is relatively large in the microwave band, and microwave images are sensitive to water. Rice contains a lot of water during its growth period, so microwave images have become one of the most important data for rice yield estimation. In recent years, with the development of radar satellite imagery, SAR data (Canisius et al. Citation2018, Zheng and Liu Citation2020), especially the freely available Sentinel-1 data (Lasko et al. Citation2018, Mansaray et al. Citation2019, Singha et al. Citation2019, De Bem et al. Citation2021), has been widely used. In addition to optical remote sensing parameters, radar parameters, especially the backscattering coefficient (σ0), reflecting the echo strength of ground objects, play an important role in crop yield estimation. Most of the growth stages of rice are submerged by water, resulting in different characteristics of rice σ0 at different growth stages (Singha et al. Citation2019). Moreover, microwaves can penetrate the leaf canopy, and the σ0 of rice is very sensitive to changes in plant biomass (Clauss et al. Citation2018). Therefore, the σ0 is one of the most significant parameters of the rice yield estimation model. Zheng and Liu (Citation2020) used Sentinel-1A SAR data, Landsat OLI and DEM data to extract rice information in Wuhua County, Guangdong Province, China.
In addition to using multi-source remote sensing data as the basic data for crop yield estimation, determining the best stage and selecting an appropriate yield estimation model have become the main issues in crop yield estimation. The phenological period of rice from sowing to harvest is relatively long and the phenological stages of rice mainly include vegetative, reproductive and maturing stages (Clauss et al. Citation2018). In order to determine the optimal yield estimation stage of rice, scholars use phenological methods to analyse the phenological characteristics of rice with optical and meteorological parameters (Clauss et al. Citation2018, Paul et al. Citation2020, Nazir et al. Citation2021). Clauss et al. (Citation2018) used super-pixel segmentation and phenology-based decision tree models to classify rice in the Mekong Delta of Vietnam, and combined RF models to complete the rice yield estimation research. The phenology-based rice yield estimation model has high accuracy, with a coefficient of determination (R2) of 0.93. Paul et al. (Citation2020) analysed the phenological characteristics of rice in eastern India based on biomass and multiple vegetation indices, such as NDVI, EVI, RGVI, etc. On the basis of the phenological analysis results, the rice yield estimation research was completed using the linear regression model. Nazir et al. (Citation2021) also analysed the phenological characteristics of rice based on vegetation indices such as NDVI and SAVI, and completed the research on rice yield estimation using the partial least square regression (PLSR) model. However, the highest R2 of the regression model is only 0.84. In addition to analysing the phenological characteristics of rice, it is also necessary to select an appropriate regression model for rice yield estimation. In the current crop yield estimation research, scholars have introduced numerous linear and nonlinear machine learning models (Richetti et al. Citation2018, Kim et al. Citation2019) into crop yield estimation such as simple linear and nonlinear regression (Dempewolf et al. Citation2014, Stepanov et al. Citation2020, Hoang-Phi et al. Citation2021, Kumar et al. Citation2021), Support Vector Regression (SVR) (Hossain et al. Citation2017), Random Forest (RF) Regression (Clauss et al. Citation2018, Kayad et al. Citation2019), Geographically Weighted Regression (Mu et al. Citation2019), Neural Network Regression (Yu et al. Citation2020), Artificial Neural Network (ANN) Regression (Basir et al. Citation2021), Convolutional Neural Network (CNN) Regression (Mu et al. Citation2019, Ghazaryan et al. Citation2020, Fernandez-Beltran et al. Citation2021), etc. Hoang-Phi et al. (Citation2021) used Sentinel-1 images to estimate rice yield in Vietnam. Ghazaryan et al. (Citation2020) obtained multi-source remote sensing images and used RF and CNN regression models to predict rice yield.
However, most scholars mainly focus on optimising the structure of the regression model and few scholars achieve accurate yield estimation by analysing the phenology of rice and optimising the input parameters (independent variables) of the rice yield estimation model. Although optimising the structure of models such as CNN can improve the accuracy of rice yield prediction, the model is more complex and less practical. This study proposed a method for rice yield prediction based on phenological analysis. In this paper, the cumulative NDVI and EVI based Logistic regression curves (CNELRC) method was used to analyse the phenology of rice in the study area to determine the optimal phenological period and the explanatory variables of NDVI, EVI and backscattering coefficient σ0 for rice yield estimation. Finally, a variety of machine learning algorithm models were used to establish a regression model for rice yield estimation of our study area and the best yield estimation model was selected according to the accuracy evaluation results.
2. Material and methods
2.1. Study area
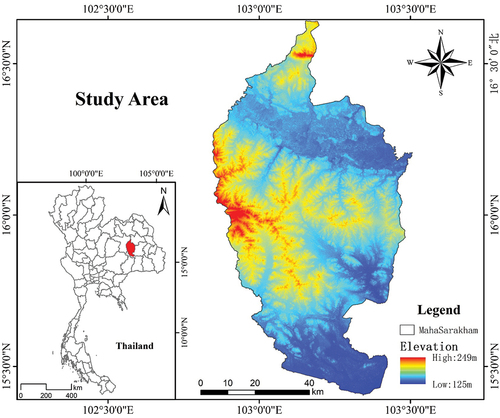
The study area is the province of Maha Sarakham, north-eastern Thailand, which has a tropical monsoon climate with hot weather and abundant rainfall throughout the year (Srisompun and Boontang Citation2020). The average elevation of the study area is between 125 m and 249 m, and the average elevation in the western and northern regions is higher, while other areas are relatively flat with undulating plains (). The study area is mainly composed of sandy soil, with a large number of rice fields distributed around it (Srisompun and Boontang Citation2020). Rice in Thailand is mainly divided into main rice and second rice. The growing period of second rice is from January to June and the growth period of main rice is from May to December. The main type of rice grown in thirteen counties of Maha Sarakham Province is main rice, of which six counties grow both main rice and second rice. This study took both main and second rice as the research objects and developed a rice yield estimation study based on phenological analysis.
Figure 1. The geographical location of the study area.
2.2. Data acquisition
Thailand is located in the tropics and is affected by cloud and rain all year round, resulting in unsatisfactory imaging quality of traditional optical images Landsat (Karydas et al. Citation2015, Dong et al. Citation2016) and Sentinel-2 (Franch et al. Citation2021, Wulder et al. Citation2021) in the study area. Compared with optical images, synthetic aperture radar (SAR) images are not affected by cloud and rain and can image all day and weather. Therefore, based on ESA, this study acquired a total of 64 GRD images from Sentinel-1 IW mode in the study area in 2018. Moreover, this study obtained a total of 23 scenes of the MOD13Q1 vegetation index products of Maha Sarakham Province in 2018 from NASA platform to analyse the phenological characteristics of rice.
2.2.1. Optical data
The MOD13Q1 vegetation index product was mainly used for phenological analysis of rice. This research used MRT and ENVI5.3 software to batch process MOD13Q1 data, and the batch process mainly included reprojection, resampling, band maths, etc. The NDVI and EVI of rice were mainly extracted. The BJ-2 satellite data, with a resolution of 3.2 m in the multi-spectral band and 0.8 m in the panchromatic band, was used to select rice samples in the study area.
2.2.2. SAR data
Sentinel-1 GRD images were mainly used to extract the backscattering coefficients of main and second rice in the study area. The Sentinels Application Platform (SNAP) was used to pre-process the original Sentinel-1 GRD images and extract the backscattering coefficients of rice in the study area. Data pre-processing of Sentinel-1 images mainly included: applying orbit file, thermal noise removal, calibration, slice assembly, speckle filtering, terrain correction, etc.
2.2.3. Rice yield and other data
The shapefile of the administrative area of the study area and the Land Cover (LC) data were obtained from https://www.diva-gis.org/gdata. The LC data were used to select rice samples and the shapefile data was used for image cropping. The rice production data were obtained from the Office of Agricultural Economics of Thailand (Kaeomuangmoon et al. Citation2019), including the rice production data of main rice and second rice in thirteen counties in Maha Sarakham Province in 2018.
2.3. Technology route
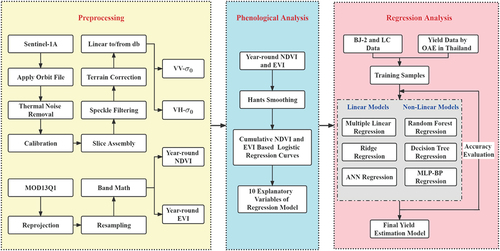
In this study, Sentinel-1 and MOD13Q1 were first pre-processed. The Sentinel-1 images were pre-processed on the SNAP software platform and the pre-processing mainly included applying the orbit file, thermal noise removal, calibration, slice assembly, Refined Lee of speckle filtering and terrain correction. Moreover, the MOD13Q1 product of vegetation index was pre-processed using the MODIS Reprojection Tool (MRT) to acquire the value of NDVI and EVI, and the pre-processing included reprojection, resampling and band maths. Based on Matlab 2021b software, the phenology of rice in the study area was analysed using the CNELRC method, and the phenological period suitable for rice yield estimation was selected to get ten explanatory variables of regression models. Finally, after comparing six rice yield estimation regression models, such as ridge regression and RF regression, the best model for rice yield estimation was concluded ().
Figure 2. The research flowchart. VV and VH represented the polarisation of Sentinel-1 data. VV represented vertical transmitting and vertical receiving and VH represented vertical transmitting and horizontal receiving. The OAE is the office of agricultural economics of Thailand. MLP-BP is the multilayer perceptron BP neural network regression model.
2.4. Methods and principles
2.4.1. The cumulative NDVI and EVI based logistic regression curves (CNELRC)
Main rice and second rice are mainly planted in the study area. The phenological period of main rice is from May to December and the phenological period of second rice is from January to June. In this study, the phenological characteristics of two-season rice were analysed and the phenological period of rice yield estimation was determined to improve the accuracy of the rice yield estimation model. The phenological parameter identification models include the cumulative NDVI based on logistic curves, the change rate method of NDVI, and the change rate method based logistic curves (Bao et al. Citation2017). In this study, the cumulative NDVI based logistic curves was used to analyse the phenology of two-season rice in the study area (Bao et al. Citation2017). In addition, the EVI value was used to replace the NDVI value in the cumulative NDVI based logistic curves, and the cumulative EVI based logistic curves was also analysed.
Hants smoothing was performed on the NDVI and EVI of the study area in 2018, and the CNELRC was analysed on the basis of original NDVI, EVI and Hants-smoothed NDVI and EVI. The CNELRC was to fit the cumulative NDVI and EVI of the study area in combination with the logistic function. Meanwhile, EquationEquations (1)(1)
(1) and (Equation2
(2)
(2) ) (Bao et al. Citation2017) were used to calculate the curve curvature k of the method to extract the phenological information of rice (Bao et al. Citation2017), and finally obtained the optimal phenological period for rice yield estimation.
where k is the logistic curve curvature of the cumulative NDVI and EVI; t is the Julian day; a and b are fitting parameters; c is the difference between the maximum cumulative NDVI and EVI and the background NDVI and EVI values (Bao et al. Citation2017).
2.4.2. Rice yield regression method
In this study, based on the LC and BJ-2 data of the study area, a total of 70 rice samples of 250 m × 250 m were selected. Meanwhile, 70% of the samples were used as the training samples and 30% of the samples were used as the validation samples for the rice regression estimation model.
Rice regression estimation models are mainly divided into linear and nonlinear regression models. The linear regression model mainly introduces multiple linear regression and ridge regression, and the nonlinear regression model mainly introduces RF regression. In addition, the ANN linear regression model was combined with the decision tree (DT) and MLP-BP nonlinear regression model for comparative analysis.
Based on the phenological analysis results, a total of ten optical and radar parameters affecting rice yield were constructed in this study. Consequently, a multiple linear regression model is required for rice yield regression prediction. The highest order term of the simple multiple linear regression model is one, and the main parameters include the weight w and bias b of the ten independent variables. However, the relationship between rice yield and optical and radar parameters could be complicated and nonlinear. Therefore, a multivariate nonlinear model is needed to fit the nonlinear relationship between vegetation indices, backscattering coefficient and rice yield.
Due to the high-order term of the multivariate nonlinear regression model, the regression model has over-fitting phenomenon. The regularised regression model uses the cost function to introduce the regularisation parameter λ to solve the over-fitting phenomenon of the regression model. The regularised regression model is also a linear regression model, including L1 and L2 regularisation terms. Regularised regression models include lasso regression, ridge regression and elastic-net regression. This study mainly used ridge regression which applied the L2 regularisation term to the loss function of the regression model. The most important hyperparameter of ridge regression is alpha, which can be adjusted to achieve the best fitting effect of the regression model. In this study, the accuracy of the regression model was optimised by adjusting the alpha parameter of ridge regression.
Ridge regression is essentially a linear regression model, which cannot fit the nonlinear complex relationship between rice yield, vegetation indices and backscattering coefficient. Among machine learning algorithms, the RF regression algorithm has been widely used by scholars. The RF algorithm is a typical nonlinear machine learning algorithm, and it is also an ensemble algorithm integrated by several weak classifiers, which has a better regression fitting effect (Yu et al. Citation2021). The RF regression model was composed of a set of decision trees and each decision tree was uncorrelated (Wang et al. Citation2019). Firstly, the RF regression model randomly selected n subsets from the training samples (Clauss et al. Citation2018, Kayad et al. Citation2019). Secondly, a decision tree was constructed based on a subset of n training samples. Finally, the final regression value was output through continuous training of the samples. The final prediction result of RF regression was jointly determined by each decision tree that constituted the RF (Wang et al. Citation2019, Yu et al. Citation2021). This regression model can solve the nonlinear relationship between independent variables and dependent variables, and reduce the phenomenon of overfitting (Wang et al. Citation2019). Compared with the single Decision Tree regression model, the RF regression model had better robustness (Clauss et al. Citation2018, Kayad et al. Citation2019).
2.4.3. Accuracy evaluation
In this study, the coefficient of determination (R2) and the root mean square error (RMSE) were used to verify the accuracy of the rice yield regression model. R2 is used to represent the goodness of fit of the regression model, which ranges from 0 to 1, and the equation is shown in EquationEquation (3)(3)
(3) (Yang et al. Citation2020). When R2 is closer to 1, the fitting effect of the regression model is better. Conversely, the fitting effect of the regression model is worse (Yang et al. Citation2020).
where n is the total number of samples; Yi is the actual yield; Y is the mean value of actual rice yield; Ei is the predicted yield obtained by regression models; E is the mean predicted rice yield obtained by regression models (Yang et al. Citation2020).
The RMSE, also known as the standard error, is shown in EquationEquation (4)(4)
(4) (Wang and Wang Citation2017). RMSE is used to measure the deviation between the predicted value of rice yield and its actual value in the rice yield estimation model (Wang and Wang Citation2017). When the RMSE is closer to 0, the accuracy of the regression model is higher and the error between the predicted and the true yield is smaller. Conversely, the lower the regression model accuracy and the larger the error value will be.
where n is the total number of samples; Yi is the actual yield; E is the mean predicted rice yield obtained by regression models (Wang and Wang Citation2017).
3. Results
3.1. Phenological analysis results
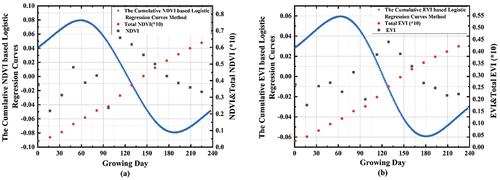
In this study, based on the research of Bao et al. (Citation2017), NDVI and EVI were introduced into the Logistic regression curve curvature method. According to the research results of Bao et al. (Citation2017), when the curvature of the Logistic curve reached a maximum value, it meant that the vegetation growth season began and when the curvature of the Logistic curve reached a minimum value, it meant the end of the vegetation growth season. shows the results of the phenological analysis of the main rice in the rainy season in the study area. In this study, the stage when NDVI and EVI reached the maximum value before the end of the rice growing season was selected as the best stage for main rice yield estimation. According to the phenological analysis results of NDVI and EVI in , the NDVI and EVI of rice in the study area reached the maximum value around the 128th to 144th day of the growth period and this stage was before the end of the main rice growing season.
Figure 3. The phenological analysis results of main rice. (a) Result of the cumulative NDVI based logistic regression curves method; (b) Result of the cumulative EVI based logistic regression curves method.
shows the results of second rice phenology analysis of cumulative NDVI and EVI based Logistic curves in the study area. Similar to the phenological analysis of main rice in the study area, the second rice growing season started on the 30th day and ended on the 110th day. This study used the 65th to 81st days before the end of the second rice growing season as the optimal stage for yield estimation.
Figure 4. The phenological analysis results of second rice. (a) Result of the cumulative NDVI based logistic regression curves method; (b) Result of the cumulative EVI based logistic regression curves method.
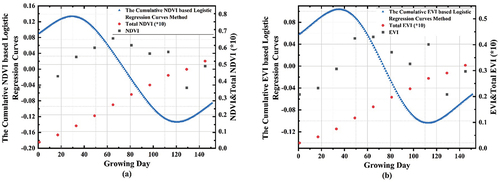
By analysing the CNELRC of main rice and second rice in the study area, NDVI and EVI on the 65th and 81st days of the second rice growing period were used as two explanatory variables for rice yield estimation regression models and the NDVI and EVI of the 128th and 144th days of the main rice growing period (i.e. the 257th and 273rd days in 2018) were also used as the two explanatory variables for regression models. Meanwhile, taking the days corresponding to the vegetation indices during the optimal yield estimation stage as the standard, the VV and VH polarised backscattering coefficient σ0 on the 76th, 88th, 256th and 268th days of paddy in 2018 were used as the four explanatory variables of the rice yield estimation model. Due to the difference in the magnitude of variation between the VV and VH polarised backscattering coefficients in rice throughout the growing season, the difference between the VV and VH polarisation σ0 in the corresponding period was used as two explanatory variables for the regression models.
In summary, a total of ten explanatory variables are identified in this study for the rice yield estimation regression model, as shown in .
Table 1. The explanatory variables of two season-rice yield estimation regression model. The lower right number is the day of year in 2018.
3.2. Regression analysis results
In this study, six linear and nonlinear regression models were used to estimate paddy yield in the study area. The explanatory variables of all regression models for rice yield estimation are listed in .
Table 2. The accuracy of six linear and nonlinear regression models in the training and validation samples.
3.2.1. Linear regression models
Firstly, the multiple linear regression (MLR) model was used to estimate the rice yield in the study area. The MLR model had ten independent variables and the one dependent variable was rice yield (ton/ha). The coefficient of determination R2 of the training samples of the MLR model was 0.90, and the RMSE was 0.09 ton/ha. The R2 of the validation samples was 0.88 and the RMSE was 0.09 ton/ha ().
Figure 5. The accuracy evaluation results of three linear regression models. (a, d) Multiple linear regression model; (b, e) Ridge regression model; (c, f) ANN regression model. The unit of RMSE, the true and predicted yield is ton/ha.
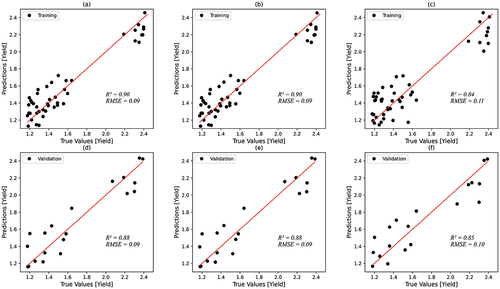
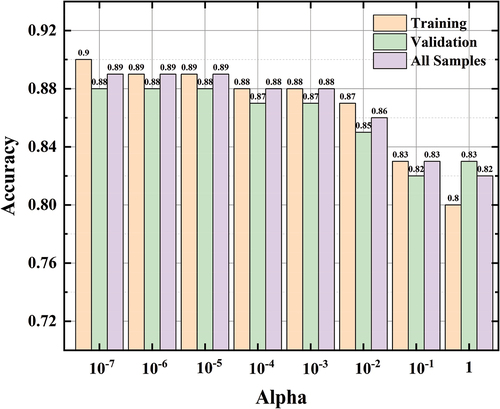
Secondly, the ridge regression model, one of the regularised regression models, was used to develop the rice yield estimation study in the study area. The main hyperparameter that affects the ridge regression model is alpha and this study selected different alpha parameters for rice yield estimation. The alpha of the ridge regression model was set to one by default. It can be seen from that the overall accuracy of the ridge regression model increased as the alpha decreased. When alpha = 1, the ridge regression model had the lowest accuracy and the training sample R2 was only 0.80. When alpha = 10−7, the R2 of the training and the validation samples of the regression model were 0.90 and 0.88, respectively, and the RMSE were both 0.09 ton/ha.
Figure 6. The accuracy of ridge regression model with different alpha parameters and the value of accuracy is the coefficient of determination, R2.
In addition, this study used a typical ANN machine learning algorithm to develop a comparative study of rice yield estimation models in the study area. In this study, the Adam optimiser and the squared loss function (MSE) were used to compile the ANN regression model, with a total of 4000 training epochs and a batch size of 20. Finally, the training and validation samples R2 of the ANN regression model were 0.84 and 0.85, respectively, and RMSE were 0.11 and 0.10 ton/ha, respectively ().
3.2.2. Nonlinear regression models
In the nonlinear regression rice yield estimation research, the RF machine learning regression algorithm was first used to predict the rice yield in the study area. The R2 of the RF regression model training and validation samples were 0.96 and 0.95, respectively, with the RMSE of 0.06 ton/ha ().
Figure 7. The accuracy evaluation results of three nonlinear regression models. (a, d) RF regression model; (b, e) DT regression model; (c, f) MLP-BP regression model. The unit of the true yield, predicted yield and RMSE is ton/ha.
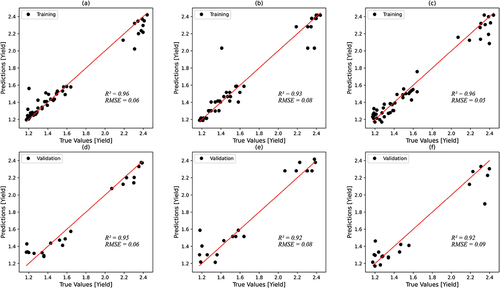
Secondly, this study used decision tree and MLP-BP machine learning regression algorithm for comparative analysis. In this study, the minimum leaf node of the decision tree regression model was set to three and the R2 of the regression model training samples was 0.93 with the RMSE of 0.08 ton/ha. The validation samples had an R2 of 0.92 and an RMSE of 0.08 ton/ha (). A total of 100 hidden layers were set in the MLP-BP regression model, and the activation function of the output layer was the RELU function. The R2 of the training and validation samples of the MLP-BP regression model were 0.96 and 0.92, respectively, and the RMSE were 0.05 and 0.09 ton/ha, respectively ().
summarises the coefficients of determination R2 for different sample sets of the six linear and nonlinear regression models for rice yield estimation used in this study. Among the linear regression models, the simple multiple linear regression model had the highest overall accuracy, with an R2 as high as 0.90 for the training samples and 0.88 for the validation samples. However, among nonlinear regression models, the RF regression model had the highest overall accuracy, with R2 as high as 0.96 for the training samples and 0.95 for the validation samples. Comparing the accuracy of the linear and the nonlinear regression models, the accuracy of the nonlinear regression models for rice yield estimation was generally better than that of the linear regression models in the study area.
4. Discussion
In this study, the CNELRC method was performed to analyse the phenology of main and second rice in Maha Sarakham, Thailand. This method provided the optimal phenotypic stage for rice yield estimation for constructing a regression model of rice yield in the study area. A total of six regression models were established, among which the overall fitting effect of the nonlinear regression model was better than that of the linear regression model. While the R2 of the training samples of the MLP-BP regression model was as high as 0.96, the R2 of its validation samples was lower than that of the RF regression model which had an R2 of 0.95. Obviously, the R2 of the training samples of the MLP-BP regression model was 0.04 higher than that of the validation samples and there was a certain overfitting phenomenon. Therefore, the RF machine learning regression algorithm had a more ideal effect in the estimation of rice yield in the study area.
Microwaves can penetrate leaf canopies, and the σ0 in radar parameters is very sensitive to changes in plant biomass. Based on multiple optical remote sensing parameters (LAI, RGVI, NDVI, etc.), Islam et al. (Citation2021) compared various regression models including ANN regression model, and found that the ANN regression model performed better, with R2 0.91, in the field of rice yield estimation. In the phenology-based PLSR model proposed by Nazir et al. (Citation2021), the model parameters only considered the simple vegetation index, and the R2 of the regression model did not reach 0.90. In contrast, this study introduces the σ0 of radar parameters into the regression model, and the R2 of the final regression model can reach 0.96. It can be seen that introducing radar parameters into the regression model can improve the overall accuracy of the rice yield estimation model. In the study of rice yield estimation in the Mekong Delta of Vietnam, Clauss et al. (Citation2018) extracted the σ0 of rice based on Sentinel-1, and also used the RF algorithm to carry out the research on rice yield estimation. However, the R2 of this model was up to 0.93. In this study, both optical and radar parameters are introduced, and the accuracy of the final model is better than the models proposed by the above scholars.
In addition to model parameters, phenological analysis is also one of the most important tasks in rice yield estimation research. Yang et al. (Citation2020) used the RF algorithm to estimate the rice yield, but did not analyse the phenology of rice. Compared with Yang et al. (Citation2020), in terms of training effect, the R2 of the phenology-based RF regression model proposed in this study is 0.011 higher than that of Yang et al. (Citation2020). Therefore, this study demonstrates the importance of phenological analysis for the establishment of regression models, and the CNELRC method provides the best phenological stage for the regression model of rice yield estimation. Besides, an appropriate regression model is also an important task in rice yield estimation research. Paul et al. (Citation2020) combined multiple vegetation indices to analyse the phenology of rice in Bansloi River Basin, Eastern India, and used a linear regression model to realise rice yield estimation research. However, the R2 of the regression model was only 0.8081, and the effect was not very satisfactory. Similarly, Nazir et al. (Citation2021) used PLSR to establish a rice yield estimation model based on the phenological analysis results. The highest R2 of the regression model was only 0.83, and the RMSE was 0.12 ton/ha. Although Paul et al. (Citation2020) and Nazir et al. (Citation2021) analysed the phenology of rice, they all used a relatively simple linear regression model. There is a complex nonlinear relationship between rice yield and its vegetation indices (i.e. NDVI and EVI) and σ0. In contrast, the R2 of the verification set of the phenology-based RF regression model proposed in this paper is as high as 0.95, which is 0.1419 and 0.12 higher than the R2 of the models proposed by Paul et al. (Citation2020) and Nazir et al. (Citation2021), respectively. The RF model can solve the complex nonlinear relationship between paddy yield and vegetation indices (i.e. NDVI and EVI) and the σ0. Meanwhile, it has high robustness and is not prone to overfitting (Clauss et al. Citation2018, Kayad et al. Citation2019, Yu et al. Citation2021). In general, this study fully proves that on the basis of phenology analysis, the use of RF algorithm can realise the research of rice yield estimation in the study area with high precision.
In addition, the NDVI, EVI, VV and VH polarised backscattering coefficient σ0 were mainly used as the explanatory variables for rice yield estimation of our study area. However, not only are the optical parameters and radar parameters closely related to the rice growth stage, but the non-remote sensing data such as average temperature (Yang et al. Citation2020, Yu et al. Citation2021), soil moisture and so on during the rice growth period also affect the paddy yield to a certain extent. In the future, both remote sensing and non-remote sensing parameters will be comprehensively considered to further optimise the rice yield estimation model, improve the model accuracy and make it universal.
5. Conclusions
After pre-processing the MOD13Q1 and Sentinel-1 data in Maha Sarakham, Thailand in 2018, this study performed a phenological analysis of two-season rice in the study area using the CNELRC method and used various machine learning regression models to predict the rice yield. Here are the main conclusions in this study.
The optimal phenological period for rice yield estimation of our study area was provided using the CNELRC method. As the curvature of CNELRC reached the minimum value, it marked the end of the rice growth period and the stage before the end of the rice growth period was selected as the phenological stage for rice yield prediction. In this study, the 65th-81st day of the second rice growing period and the 128th-144th day of the main rice growing period (i.e. the 257th-273rd day in 2018) were selected as the optimal yield estimation stages. Meanwhile, this study constructed ten explanatory variables for paddy yield estimation on the basis of the results of the phenological analysis.
This study mainly analysed the ridge regression model and RF nonlinear regression model, and compared the above two models with the other 4 regression models, namely multiple linear regression, ANN linear regression, decision tree regression and multi-layer perceptron neural network regression. The results of this study show that among the six regression models, the accuracy of the nonlinear regression model is better than that of the linear regression model. In particular, the RF machine learning regression algorithm has the highest accuracy and the best fitting effect in the rice yield estimation research. In this model, the R2 of the training samples and the validation samples was 0.96 and 0.95, respectively, and the RMSE was both 0.06 ton/ha.
Compared with convolutional neural network regression model (such as LSTM), the RF machine learning regression algorithm of this study had a simpler structure, shorter training time, strong operability and higher accuracy. In this study, the method of the CNELRC was proposed to obtain the phenological information of main rice and second rice and then the optimal phenological stage for rice yield estimation was determined to obtain the explanatory variables of the rice yield prediction regression model. In addition, the RF machine learning regression algorithm was used to realise the rice yield prediction research of our study area. The RF regression model of rice yield estimation based on paddy phenology information proposed in this study can identify the optimal phenological stage of rice yield estimation area and achieve higher accuracy in rice yield estimation research which provides a method for rice yield prediction of our study area.
Acknowledgments
We thanked the European Space Agency and the National Aeronautics and Space Administration for the Sentinel-1 and MOD13Q1 data.
Disclosure statement
No potential conflict of interest was reported by the author(s).
Additional information
Funding
References
- Arumugam, P., et al., 2021. Remote sensing based yield estimation of rice (Oryza Sativa L.) using gradient boosted regression in India. Remote Sensing, 13, 2379. doi:10.3390/rs13122379
- Bao, G., et al., 2017. Spatio-temporal dynamics of vegetation phenology in the Mongolian plateau during 1982~2011. Remote Sensing Technology and Application, 32, 866–874. doi:10.11873/j.1004-0323.2017.5.0866
- Basir, M.S., et al., 2021. Artificial neural network model in predicting yield of mechanically transplanted rice from transplanting parameters in Bangladesh. Journal of Agriculture and Food Research, 5, 100186. doi:10.1016/j.jafr.2021.100186
- Canisius, F., et al., 2018. Tracking crop phenological development using multi-temporal polarimetric Radarsat-2 data. Remote Sensing of Environment, 210, 508–518. doi:10.1016/j.rse.2017.07.031
- Clauss, K., et al., 2018. Estimating rice production in the Mekong Delta, Vietnam, utilizing time series of Sentinel_1 SAR data. International Journal of Applied Earth Observation & Geoinformation, 73, 574–585. doi:10.1016/j.jag.2018.07.022
- De Bem, P.P., et al., 2021. Irrigated rice crop identification in Southern Brazil using convolutional neural networks and Sentinel-1 time series. Remote Sensing Applications: Society and Environment, 24, 100627. doi:10.1016/j.rsase.2021.100627
- Dempewolf, J., et al., 2014. Wheat yield forecasting for Punjab Province from vegetation index time series and historic crop statistics. Remote Sensing, 6, 9653–9675. doi:10.3390/rs6109653
- Dong, J., et al., 2016. Mapping paddy rice planting area in northEastern Asia with Landsat 8 images, phenology-based algorithm and google earth engine. Remote Sensing of Environment, 185, 142–154. doi:10.1016/j.rse.2016.02.016
- Fernandez-Beltran, R., et al., 2021. Rice-yield prediction with multi-temporal Sentinel-2 data and 3D CNN: a case study in Nepal. Remote Sensing, 13, 1391. doi:10.3390/rs13071391
- Franch, B., et al., 2021. Within-field rice yield estimation based on Sentinel-2 satellite data. Remote Sensing, 13, 4095. doi:10.3390/rs13204095
- Ghazaryan, G., et al., 2020. Crop yield estimation using multi-source satellite image series and deep learning. In: GARSS 2020-2020 IEEE international geoscience and remote sensing symposium, Waikoloa Village, USA: IEEE, 5163–5166. doi:10.1109/IGARSS39084.2020.9324027
- Hoang-Phi, P., et al., 2021. Rice yield estimation in an Giang province, the Vietnamese Mekong Delta using Sentinel-1 radar remote sensing data. IOP Conference Series: Earth and Environmental Science, 652, 012001. doi:10.1088/1755-1315/652/1/012001
- Hossain, M.A., et al., 2017. Predicting rice yield for Bangladesh by exploiting weather conditions. In: 2017 International Conference on Information and Communication Technology Convergence (ICTC), Jeju Island, South Korea: IEEE, 589–594. doi:10.1109/ICTC.2017.8191047
- Islam, M.M., et al., 2021. Development of remote sensing-based yield prediction models at the maturity stage of boro rice using parametric and nonparametric approaches. Remote Sensing Applications: Society and Environment, 22, 100494. doi:10.1016/j.rsase.2021.100494
- Kaeomuangmoon, T., et al., 2019. Estimating seasonal fragrant rice production in Thailand using a spatial crop modelling and weather forecasting approach. The Journal of Agricultural Science, 157, 566–577. doi:10.1017/S0021859619000881
- Karydas, C.G., et al., 2015. Development of a rule-based algorithm for rice cultivation mapping using Landsat 8 time series. In: Third International Conference on Remote Sensing and Geoinformation of the Environment (RSCy2015). 3rd ed. Larnaka, Cyprus. doi:10.1117/12.2193162
- Kayad, A., et al., 2019. Monitoring within-field variability of corn yield using Sentinel-2 and machine learning techniques. Remote Sensing, 11, 2873. doi:10.3390/rs11232873
- Kim, N., et al., 2019. A comparison between major artificial intelligence models for crop yield prediction: case study of the Midwestern United States, 2006–2015. ISPRS International Journal of Geo-Information, 8, 240. doi:10.3390/ijgi8050240
- Kouadio, L., et al., 2014. Assessing the performance of MODIS NDVI and EVI for seasonal crop yield forecasting at the ecodistrict scale. Remote Sensing, 6 (10), 10193–10214. doi:10.3390/rs61010193
- Kumar, J., et al., 2021. Pre-harvest forecast of rice yield based on meteorological parameters using discriminant function analysis. Journal of Agriculture and Food Research, 5, 100194. doi:10.1016/j.jafr.2021.100194
- Lasko, K., et al., 2018. Mapping double and single crop paddy rice with Sentinel-1A at varying spatial scales and polarizations in Hanoi, Vietnam. IEEE Journal of Selected Topics in Applied Earth Observations and Remote Sensing, 11, 498–512. doi:10.1109/JSTARS.2017.2784784
- Liaqat, M.U., et al., 2017. Evaluation of MODIS and Landsat multiband vegetation indices used for wheat yield estimation in irrigated Indus Basin. Computers and Electronics in Agriculture, 138, 39–47. doi:10.1016/j.compag.2017.04.006
- Liu, H., et al., 2015. Estimation model of cotton yield with time series Landsat images. Transactions of the Chinese Society of Agricultural Engineering, 31, 215–220. doi:10.11975/j.1002-6819.2015.17.028
- Mansaray, L.R., et al., 2019. Optimising rice mapping in cloud-prone environments by combining quad-source optical with Sentinel-1A microwave satellite imagery. GIScience & Remote Sensing, 56, 1333–1354. doi:10.1080/15481603.2019.1646978
- Mu, H., et al., 2019. Winter wheat yield estimation from multitemporal remote sensing images based on convolutional neural networks. In: 2019 10th International Workshop on the Analysis of Multitemporal Remote Sensing Images (MultiTemp). 10th ed. Shanghai, China: Tongji University, 1–4. doi:10.1109/Multi-Temp.2019.8866918
- Nazir, A., et al., 2021. Estimation and forecasting of rice yield using phenology-based algorithm and linear regression model on Sentinel-II satellite data. Agriculture, 11, 1026. doi:10.3390/agriculture11101026
- Nuarsa, W.I., Nishio, F., and Hongo, C., 2011. Spectral characteristics and mapping of rice plants using multi-temporal Landsat data. Journal of Agricultural Science, 3, 54–67. doi:10.5539/jas.v3n1p54
- Paul, G.C., Saha, S., and Hembram, T.K., 2020. Application of phenology-based algorithm and linear regression model for estimating rice cultivated areas and yield using remote sensing data in Bansloi River Basin, Eastern India. Remote Sensing Applications: Society and Environment, 19, 100367. doi:10.1016/j.rsase.2020.100367
- Rahman, A., et al., 2012. Use of remote sensing data for estimation of Aman rice yield. International Journal of Agriculture and Forestry, 2 (1), 101–107. doi:10.5923/j.ijaf.20120201.16
- Richetti, J., et al., 2018. Using phenology-based enhanced vegetation index and machine learning for soybean yield estimation in Parana´ State, Brazil. Journal of Applied Remote Sensing, 12, 026029. doi:10.1117/1.JRS.12.026029
- Singha, M., et al., 2019. High resolution paddy rice maps in cloud-prone Bangladesh and Northeast India using Sentinel-1 data. Scientific Data, 6. doi:10.1038/s41597-019-0036-3
- Son, N., et al., 2014. A comparative analysis of multitemporal MODIS EVI and NDVI data for large-scale rice yield estimation. Agricultural and Forest Meteorology, 197, 52–64. doi:10.1016/j.agrformet.2014.06.007
- Srisompun, O. and Boontang, S., 2020. Production efficiency and its determinants of cassava farms in Maha Sarakham, Thailand. Journal of the International Society for Southeast Asian Agricultural Sciences, 26, 73–85.
- Stepanov, A., et al., 2020. Predicting Soybean yield at the regional scale using remote sensing and climatic data. Remote Sensing, 12, 1936. doi:10.3390/rs12121936
- Vergouw, B., et al., 2016. Drone technology: types, payloads, applications, frequency spectrum issues and future developments. The Future of Drone Use, 27, 21–45.
- Wang, K. and Wang, X., 2017. Research on winter wheat yield estimation with the multiply remote sensing vegetation index combination. Journal of Arid Land Resources and Environment, 31, 44–49. doi:10.13448/j.cnki.jalre.2017.210
- Wang, P., et al., 2019. Estimation of maize yield based on random forest regression. Transactions of the Chinese Society for Agricultural Machinery, 50, 237–245. doi:10.6041/j.1000-1298.2019.07.026
- Wulder, M.A., et al., 2021. Continuity of Landsat observations: short term considerations. Remote Sensing of Environment, 115, 747–751. doi:10.1016/j.rse.2010.11.002
- Yang, B., et al., 2020. Remote sensing estimation of rice yield based on random forest regression method. Journal of China Agricultural University, 25, 26–34. doi:10.11841/j.1007-4333.2020.06.04
- Yu, H., et al., 2020. Method of remote sensing estimation of corn yield based on genetic algorithm optimized BP neural network. Global Geology, 39, 208–214. doi:10.3969/j.1004-5589.2020.01.022
- Yu, X., et al., 2021. Research in crop yield estimation models on different scales based on remote sensing and crop growth model. Spectroscopy and Spectral Analysis, 41, 2205–2211. doi:10.3964/j.1000-0593(2021)07-2205-07
- Zheng, S. and Liu, L., 2020. Rice information extraction based on single-temporal Sentinel-1A image SAR data. Geospatial Information, 18, 61–64+7. doi:10.3969/j.1672-4623.2020.04.015