
Abstract
This paper proposes a bespoke urban sustainability indicator framework in the context of China’s prevalent property-led urban development. Emphasising local characteristics and incorporating underlying institutions, it advocates a more nuanced, holistic and dynamic approach when addressing sustainability issues. Selection of indicators were based on extensive literature reviews and tested through an international expert survey comprising both China-based and overseas-based experts. The two groups of experts have shown divergent views, with the former prioritising economic and institutional aspects over environmental and social factors. It also provides transferable policy insights into developing countries more generally, given many similarities in broader development challenges. Discussion on recent literature and urban development reinforces the applicability of these tailor-made indicators to not only monitoring but also explaining and predicting urban changes. We argue it is necessary to recognise the centrality of property-led urban development in urban sustainable development, and the need for examining the complex relations between the property sector and urban sustainability via inclusion of institutional analysis and a multi-method approach combining quantitative and qualitative evaluations.
Highlights
| • | Unsuitability of existing indicators in developed nations to China and other developing countries | ||||
| • | A context-specific indicator framework focusing on property and urban development | ||||
| • | An in-depth methodological approach that incorporates institutional dimensions | ||||
| • | A combination of quantitative and qualitative evaluation on urban complex impacts | ||||
| • | A holistic and dynamic understanding for problems, causes, solutions and changes | ||||
Introduction
Sustainable development (SD) has been gathering momentum together with the increasing recognition over immense challenges largely related to the nature of its multitudinous aspects and the need to address their dynamic relations and overall impacts. International organisations, governmental bodies and academic institutions have shown increasing enthusiasm on using indicators to monitor and assess urban performances, identify trends and problems and formulate policies and strategies (e.g. IISD Citation1997; Bell and Morse Citation1999; DEFRA Citation2005; OECD Citation2005; UN Citation2007). The majority of numerous sustainable development indicators (SDIs) remain largely focused on environmental aspects as the roots for development of SD concept (e.g. Giovannini and Linster Citation2005; Singh et al. Citation2009; Ameen et al. Citation2015). Though limited integration of its main components has been made, despite the growing international support for an integrated approach for impact assessment and more efficient decision-making (Kidd and Fischer Citation2007). Indicators of governance and institutions, regardless of increasing contemporary urban studies on its critical role in shaping urban results in different contexts (e.g. Chigora Citation2007; Xu and Yeh Citation2009), have been seldom reflected in SDI systems (Shen et al. Citation2011). Moreover, rare attention has been paid to inter-relations amongst different aspects of sustainability (Wang et al. Citation2013), although an increase in one aspect could relate to a decrease in another.
This has mainly been ascribed to a failure to resolve conceptual and methodological difficulties related to design of certain indicators, availability and quality of data, quantification of qualitative concepts and problems of interpretation (Hemphill et al. Citation2004; Scerri and James Citation2010). Compared to the well-legitimised environmental impact assessment, a more holistic approach to sustainability that brings together SD pillars, incorporates institutional factors and examines their interactions and impacts has only gained more traction recently and is still in its infancy (Kidd and Fischer Citation2007; Ding et al. Citation2015). However, a more in-depth understanding of problems, effective decision-making and implementation and reliable prediction of future changes would be inextricable if limited progress is made in this regard.
Meanwhile, there also emerges concern over the inadequacy of western approaches in providing full description of the fast pace of development and novel features in the developing countries (Samara et al. Citation2013). Different from the industrialised and urbanised developed countries, Chinese cities and other cities in the developing countries are undergoing unprecedented urbanisation in history with great complexity and uncertainty, which according to Wu (Citation2016) requires more flexibility in the framework of research. This is timely under the ‘One Belt, One Road’ strategy (Zhao Citation2017) with greater roles and stronger ties amongst these countries to be seen in emerging international social-economic connections. However, majority indicators established in the developed regions particularly Western Europe and North America could not be directly applied to the developing countries, which is often characterised by distinct contexts and development patterns, economic-oriented priorities and rapid transformation (Ding et al. Citation2015; Mori and Yamashita Citation2015). The intractability of a universal ‘common list’ of indicators that suits equally to all countries, regions or communities is increasingly noted. There ought to be a shift towards developing and testing sustainability indicators for specific locales, subjects and contexts to allow for more appropriate indicators and effective implementation (Shen et al. Citation2011).
The rapid economic advance and urban development of China has been largely fuelled by a property-led urban development model (Cao Citation2009). Characterised by selling state-owned land use rights to fund infrastructure construction and promote urban growth by property development, this model has been generating considerable fund for urban transformation and developing new economic growth points in places without favourable location, human capital or natural resources. Nevertheless, over-emphasis on physical and short-term development results in acute urban problems, including arable land loss, housing speculation and price inflation, unbalanced development within and between cities, economic and financial risks, environmental degradation and social instability (Xu and Yeh Citation2009; Xu Citation2017). It has been repeatedly emphasised in national Five Year Plans (FYP) since 2006 as a central task to reform the mode of economic growth. However, this property-led approach remains crucial to the economic recovery of China and government intervention to prop up the housing market, such as reducing taxes and loosening credits, has become normal practice after the financial crisis (Cao Citation2015). Frequent emergence of so-called ‘land kings’, an appellation for the most expensive land sale deal in a city, and more rapid growth of housing prices in many Chinese cities since mid-2016 has again set off the alarm for urban sustainability (Sina News Citation2016).
This paper proposes a holistic and context-specific urban sustainability indicator (USI) framework for China that incorporates multiple aspects and examines their mutual relations and integrated impacts. It argues that it’s important to approach urban sustainable development by seeing the centrality of property development in its urban development and investigate the underlying drivers by incorporating the institutional element. It presents the main gap of SDIs, builds the connections between property and sustainability, and evaluates the suitability of new indicators to China facilitated by an international expert survey and discussion on recent development. It further identifies transferable implications for studies on developing countries in general.
Urban sustainability measurement
Hundreds of definitions have been provided for sustainable development (Jacobs Citation1991; Fischer Citation1999), when specific localities and aspects of undertakings are concerned. For example, Chambers et al. (Citation2000) argues that it achieves satisfying lives for all while staying within the bounds of nature. Pearce (Citation1994) describes sustainable economic development as a state of continuous rising, or at least non-declining, consumption per capita. With the vital yet vague concept, it becomes more useful to examine its underlying key principles to guide real practice.
Arguably the most cited version given by Brundtland report (WCED Citation1987) states that ‘development that meets the needs of the present without compromising the ability of future generations to meet their own needs’. It sets the fundamental requirement for both inter-generational and intra-generational equity, and strategic balance between needs and limits of development across time and space, which was echoed in Agenda 21 at the 1992 Earth Summit in Rio (UNCED Citation1992). Recognising the human system as fundamentally an integral component of the surrounding world, IISD (Citation1997) highlights the balancing principle that in the long run sustainability requires improvement and maintenance of both the well-being of people (human needs) and the ecosystem (environment needs), not one at the expense of the other.
Bourdic et al. (Citation2012) specifying a system analysis argue that SD should be deemed as a whole system with mutually interrelating elements. It is often the hidden interactions amongst such elements and their holistic impacts that need to be emphasised. It is not a ‘fixed state of harmony’ but an on-going process in which people take continuous actions on equity and balance for now and the future. Therefore, it is important to embed these key principles, i.e. equity, balance, system, holism, dynamism and long-termism, into the whole cycle for developing indicators, as adopted in this paper.
Meanwhile, the traditional ‘Triple Bottom Line’ is increasingly viewed to be overall underpinned by a fourth dimension, i.e. the institutional and governance structures necessary for SD to be realised (Ghosh et al. Citation2006; Ding et al. Citation2015). This is because institutions set the ‘rule of game’ and govern the ‘play of the game’ in the real environment of costly exchanges (North Citation1990). Being path-dependent, changes of institutional framework play a key role in shaping and explaining the dynamic rise and fall of an economy as a whole. Literature has demonstrated the evolutionary perspective that institutional discussions provide on sophisticated issues, such as economic growth, urban development, property market and sustainable policy implementation in both developed and developed regions (e.g. Healey Citation1992a; Keogh and D’arcy Citation1999; Zhu Citation2005; Staley Citation2006).
The interpretation of SD concept and determination and implementation of sustainability goals has social, political and philosophical considerations, depending on the aggregate values of the society and decision-makers (Fischer Citation1999). In the real complex world full of human interactions, including ‘institutional’ as part of SD indicators empowers it as not only ‘assessing’ multifaceted sustainability problems and impacts, but also ‘diagnosing’ interactions and causes, necessary for predicting changes and identifying solutions. Long-term sustainable development only occurs when adaptive efficient institutions are established.
Nevertheless, the institutional dimension has rarely been effectively incorporated into the ‘Triple Bottom Line’ or existing SDIs (Ameen et al. Citation2015). Main advocates are limited to some international organisations and government bodies, such as UNCSD’s (Citation2001) 134 indicators with 15 themes and 38 sub-themes on economic, environmental, social and institutional and 68 SD strategy indicators by the UK government (DEFRA Citation2005). Such an integrated approach brings benefits in terms of increasing stakeholder engagement, joined-up approaches and improved efficiency in decision-making and implementation of public policy (Kidd and Fischer Citation2007). However, their wider application and real impacts remains restrained due to practical complexity of long ‘shopping lists’ and low adaptability to different contexts given the variation in political and socio-economic systems (IISD Citation1997; OECD Citation2005). It is also not clear whether some indicators are to be interpreted as causes or states of problems (Ghosh et al. Citation2006). Moreover, compared to just indicating status and symptoms in multiple dimensions, it is more crucial to discover their underlying relations, drivers, obstacles and structures interwoven with local contexts to enhance impacts of indicators.
In China, the majority of indicator systems are environment-dominated developed by environmental ministry and agencies, whose efficacy is deemed to be weakened due to lacking cross-links between the environment and non-environment domains (Wang et al. Citation2013). Dijk and Zhang (Citation2005) ascribe environmental degradation in China fundamentally to inefficient urban management between multi-sector and multi-actor coordination and develop a set of integrated 22 USI based on three dimensions, i.e. urban status, urban coordination and urban potential (Figure ). This enables an examination of economic and environmental interrelations, trade-offs and longer term changes in China’s context. However, the only institutional indicator on ‘citizen’s satisfaction with their city’ makes it short of scrutinising governance process and quality (e.g. transparency, accountability, efficiency) and identifying institutional determinants on urban impacts.
Recently, features of China’s urban development like the investment-driven and resource-intensive growth are reflected in indictors, e.g. McKinsey’s Urban Sustainability Index (UCI Citation2010). Critical issues such as rapid demographic changes and dominant land financing are addressed. More integrated indicators are also emerging (e.g. Fan and Qi Citation2010; Ding et al. Citation2015; Huang et al. Citation2016) to provide systematic evaluation of SD pillars. Nevertheless, their dynamic interrelations, strategic balance and holistic impacts remain seldom emphasised. Negligence over the impacts of wide-reaching property development sector (Wu Citation2015a) hampers a fuller interpretation of urban outcomes.
Property-led urban development
The seemingly contradictory processes, namely the so called ‘neoliberal’ free market development,Footnote 1 and ‘developmental state’Footnote 2 as developed in the East Asia, are suggested to have been combining well in the Chinese model of economic rise (Wu Citation2016). Different from its counterpart in the West (e.g. US, UK, Ireland, Netherland) (Healey Citation1992b), the property-led approach in China has gone far beyond the scope of regeneration projects towards entire city and urban levels (Cao Citation2015). Following the political-economic incentive system towards economic growth since late 1970s and greater development autonomy and tasks at local levels after the 1994 fiscal reform, local governments have actively promoted local growth and enhanced competitiveness (Xu Citation2017). With the ownership of urban land and emphasis on land financing, a specific form of local government entrepreneurialism has been shaped, speeding up its transition from being market ‘regulator’ towards market ‘player’ (Figure ).
Accordingly, property development has been adopted much beyond the sphere of real estate and plays a crucial role in economic growth, urban transformation, industrial development, and competition for capital at both local and international levels (Wu Citation2015a). During 1991–2015, the government sold a total of 3.74 million hectares of land for RMB26.12 trillion, accounting for 45.6% of local fiscal revenues on average (NBSC Citation2016). Housing condition has been largely improved by uplifting the per capita living space from merely 6.7 m2 in 1978 to 32.9 m2 in 2012 (ibid).
Different from the local state, the central government is more concerned about financial and political risks of over-heating and speculation. It exercises its influence through not only appointing local officials but also market intervention through supervision of mega projects and plans and introducing macro control policies for several rounds since 2004 (Xu and Yeh Citation2009). The policy impacts of these interventions, however, have often been contingent and limited since they have failed to curb house price inflation effectively. The housing price to earning ratio, or the median house price to median gross household income, is recommended to range between 3 to 5, with anything beyond 5 as severely unaffordable (Cox and Pavletich Citation2015). However, it reached 21.7, 20.1 and 19.7, respectively in Shenzhen, Beijing and Shanghai, when the national average in China amounts to 7.5 (E-House China R&D Institute Citation2015). At the same time about 622 million m2 of commercial housing remained available for sale until 2014 (NBSC Citation2016).
Institutional changes such as land and housing reforms towards commodification, fiscal reforms on stronger local autonomy, political officials’ incentives for economic growth and rapid transformation have together underpinned the shaping of the property-led urban development into a growth machine for Chinese cities (Xu Citation2017). Yet, the complexity of regulating and stabilising the market is also largely ascribed to these institutional foundations. It is exacerbated by the fact that urban planning becomes an expansionist growth tool as it has rarely fulfilled its capacity of development control, but rather being used to create development opportunities (Wu Citation2015b).
Consequently, both the positive and negative impacts of this property-led approach in environmental degradation, social inequality and economic instability and policy inefficacy have been substantial and profound, at a much greater scale compared to the Western experience of different political, institutional and local settings. It’s important to see the central role played by this growth model in order to interpret and predict sustainable development of Chinese cities. Extensive studies have been made on China’s housing reforms and market institutions (Wang Citation2000; Zhu Citation2005), housing prices, affordability and regulations (Wang and Murie Citation2011; Cao Citation2015), entrepreneurialism and governance (Qian Citation2007; Xu and Yeh Citation2009), and property-led urban regeneration (He and Wu Citation2007). Yet inadequate attention is paid to relating property development to the wider and complex economic, environmental and social changes and outcomes (Cao Citation2009; Wu Citation2015b). This paper makes a concrete step in this direction to develop tailor-made indicators that explicitly examine the connections between real estate and sustainability.
Research method
The indicator system was developed in four steps: (1) theoretical consolidation on SDIs and property-led urban strategy (2) development of SDIs related to the property sector and institutional dimension (3) international expert survey testing the indicators’ importance and relevance. Since the survey was undertaken in late 2008 to gain expert opinions on indicators, the property-led urban growth becomes even more relevant and widespread amongst Chinese cities. Data discussion contextualised through updated documentation-based research further verifies the importance of examining this growth model and the applicability of these indicators to China’s current and future development.
Towards a property-related USI framework
A conceptual framework is crucial to structure the development of indicators and guide the assessment process (Bell and Morse Citation1999). Existing indicators are developed under two main frameworks, either Economic–Social–Environmental framework by selecting different indicators for SD dimensions or Pressure-State-Response framework by organising indicators with causal chains (Singh et al. Citation2009; Wang et al. Citation2013). Ding et al. (Citation2015) criticise the former as being weak in uncovering relations hidden within indicators, which according to Wang et al. (Citation2013) can be achieved through combining the two frameworks. This paper adopts such a combination and further proposes a new ‘Quadruple Bottom Line’ that emphasises how institutional factors determine interactions amongst all SD sectors.
This integrated approach, without long-list of related items, is focused on explaining trade-offs between subsystems and underlying causes for urban status and problems to facilitate policy setting, influenced by informal rules (North Citation1990; Fischer Citation1999), that allows for more effective implementation. It also incorporates science-oriented quantitative indicators with social science-oriented qualitative indicators (Hemphill et al. Citation2004; Kidd and Fischer Citation2007) to enable a ‘sustainability diagnosis’ with width and depth in longer term perspectives. Instead of picking-up segmented features, determination of indicators is contextualised in China’s property-led urban development and focused on examining its systematic interactions with the urban development process.
A hierarchical structure is employed to capture all areas of above concerns in a clear-structured way and extended from broad categories of data and information to detailed indicators and measures (OECD Citation2005) (Figure ).
Selection criteria
Indicators need to be selective, satisfying appropriateness, comprehensibility, validity, simplicity, reliability, availability, measurability and sensitivity (Bell and Morse Citation1999; Fischer et al. Citation2010). Considering China’s relatively lower transparency compared to developed countries, the level of data availability, reliability and measurability is essential. A pilot study on a pool of indicators, identified through extensive literature reviews in light of Figure , was conducted to refine indicators and iron out any ambiguities. A number of indicators were deleted due to their failure to meet these criteria, e.g. age and refurbishment of property, reduction of CO2 emissions of buildings, proportion of historic buildings at risk of unauthorised alteration/demolition etc. However, institutional and other qualitative indicators were kept to address the above-mentioned methodologies challenges of SDIs and incorporate both quantitative and qualitative evaluation for deeper interpretation. Table illustrates the sources of selection with individual code for indicators and clarification of their connotations. The economic, environmental, social and institutional are coded by EC, EN, SO and IN, respectively.
Table 1. Property-related urban sustainability indicator system.
Survey design
Survey is relevant in terms of both consolidating a different approach to developing indicators and incorporating current sustainability debates particularly in China. Questions were designed by requiring respondents to rate the four sectors, 15 themes and 26 indicators, respectively (Table ) in terms of their importance on urban sustainability. A Likert scale was used to measure responses and minimise refusals (Lee et al. Citation2002). A scale of one to five was used, i.e. 1 = least important, 3 = important and 5 = most important, although freedom of choice was provided when respondents felt not confident enough to give a rating. Each question has an open space that allows respondents to explain their reasons and advice, providing important qualitative data that facilitates data analysis.
Identification of respondents
As a cross-disciplinary study, survey respondents were identified according to their achievements and contributions in relevant areas, e.g. sustainable development and measurement, urban development, urban and environmental economics, land and housing, property development and investment, urban governance and urban/regional planning. Snowballing technique was also utilised by asking pilot study experts to recommend respondents for the survey, and then a qualification check was applied. This reduced the possibility of research bias by inviting a large pool of experts from a wide range of relevant positions and professions. The targeted participants were divided into two main groups, i.e. either residing in or out of China. This division also enabled comparison of opinions between China-based (CN) respondents and overseas-based (FN) ones.
Survey process
An online expert survey was considered as the most appropriate in terms of access, reach and ease of completion and return. In total, 100 invitations were sent via emails, yielding a response rate of 57% in one month. These 57 respondents held senior positions (e.g. President, Chairman, Dean, Director) and had a variety of academic (60% Professors, 22.5% PhD holders) and professional (17.5% senior professionals) achievements. Amongst them, 24 were from different parts of China while the other 33 were overseas-based in seven countries (UK, US, Canada, Singapore, Russia, Czech and Netherlands). Such a diverse background and territorial diversion enabled a wide range of expertise with multi-faceted perspectives on the subject. Additionally, rather than aiming for statistical generalisation, the survey was devised to gain a deeper understanding of sustainability considerations and therefore, the data gathered is considered as valid and sufficient for the purpose.
Data analysis
SPSS was employed to facilitate analysis of the ratings by respondents regarding the importance of sectors, themes and indicators on sustainability. Descriptive statistical techniques were employed, including calculating means to determine relative importance of factors, testing quartiles distribution to identify key indicators, and generating frequency distribution and standard deviations to examine statistical divergence of expert opinions between two expert groups. The qualitative data were utilised when examining underlying reasons for respondent’s choices. Rating results on the sectors, themes and indicators are, respectively shown in Table . Columns A, B and C demonstrate the rankings of ratings according to the mean scores of all respondents (Column H), FN respondents (Column E) and CN respondents (Column F).
Table 2. Results of expert ratings on the 4 sectors, 15 themes and 26 indicators, respectively.
Sector analysis
The mean scores of the four sectors, by all respondents (Column H), FN (Column E) and CN (Column F), respectively, show strong support for the ‘Quadruple Bottom Line’ model that recognises the fourth institutional aspect marginalised in existing SDIs (Ameen et al. Citation2015). The differentiated sectoral ratings have several implications. Firstly, the gap between ‘Economic’ and other three sectors by CN experts indicates the perceived importance of economic resources in achieving sustainability and adoption of ‘weak sustainability’ in China (Neumayer Citation1999). This is well-evidenced in the period after the 2008 Global Financial Crisis, e.g. the market rescue measures by local governments and massive central economic stimulus plan in late 2008, and repeated local rescues during the economic slowdown in late 2014 (Cao Citation2015).
Secondly, the almost equal rating between ‘Economic’ and ‘Environmental’ by FN experts shows the vitality of environmental capacity for sustaining life and explains the majority environmental focus of existing sustainability indices (Ameen et al. Citation2015). Thirdly, the relatively lower ratings on social and institutional sectors partly reflect the difficulty of evaluating these aspects (Scerri and James Citation2010) and limited integration and emphasis on institutional aspect in existing indicators (Ding et al. Citation2015). In policy terms there are increasing efforts to include aspects of social sustainability, e.g. social cohesion, in strategies for developing sustainable communities in western countries like UK (DEFRA Citation2005). Nevertheless, social sustainability seemingly remains being underplayed by policy-makers and market players in transitional China under the on-going and massive urban transformation.
Theme and indicator analysis
Consistently, the top one-third themes and indicators belong to all three sectors except ‘Social’, although the entire indicator system shows high to very high relevance with ratings of all themes and indicators (Column H) range from 3.41 to 4.56. The majority of the ‘Environmental’ themes and indicators are ranked in the top half, while that of the ‘Social’ are in the bottom half, a divide shown clearly by quartile scores in SPSS statistical distribution (Table ), even though it has been increasingly recognised that these two are inseparable (Bourdic et al. Citation2012).
Table 3. Quartile distribution of indicators and key performance indicators (KPIs) by sector.
In contrast, although the ‘Economic’ sector ranks first (Table ), much more weight was put on themes of ‘general economic performance’ and ‘infrastructure quality’, and indicators of ‘economic growth’ and ‘public mass transit’. This conforms to China’s economic growth priority, its dramatic GDP growth and the primary role of fixed asset investment (FAI) in driving this. In 2016, the ratio of FAI to GDP reaches a historic high of 83%, surging from the average 50% before the financial crisis (NBSC Citation2016). This has been largely achieved through large-scale infrastructure investment that is mainly funded by government land sale in China, central to its property-led urban development.
Despite that ‘Institutional’, as a sector, ranks in the third place (Table ), two out of its three themes, and six out of its 10 indicators are amongst the top half (Table ), reflecting its underlying role in determining urban outcomes. This was captured by a respondent’s comment, ‘A trusted and transparent legal infrastructure is better than rapid economic growth … it reduces property market risk and increases investment values and market efficiency’.
FN-CN divergence analysis
Variance analysis has been conducted via a paired sample test. At a 95% confidence level, the Sig. (2-tailed) shows a value of 0.406, much more than 0.05. Hence, at a 5% significance level, no significant differences have been found between FN and CN views. This enhances the overall validity and reliability of survey results and indicator system. However, the two groups by no means share absolutely same contentions, but rather, have interesting divergences (Columns E and F in Table ). Comparison on their individual ratings along with aggregate results offers a path to revealing underlying factors when specific indicators are considered.
Economic sustainability
The biggest gap (0.58) in mean scores amongst all ratings is found on EC1 economic growth, ranked by CN (1st) and FN (8th) experts. To CN economic growth is regarded as the ultimate priority over all factors. Yet to FN there are 3 institutional indicators (IN3, IN4 and IN6) rated higher than EC1, although ‘Economic’ was rated higher than ‘Institutional’ at the sector level. An explanation is that economic growth is determined by these institutional factors, and there are other economic indicators more important than economic growth, such as those emphasising economic stability and quality. The divergent rating on EC5 efficiency of property use exemplifies the limited attention on efficiency issues in China. Rapid and powerful economic recovery dominated post-crisis policies when Chinese governments introduced large-scale local and national economic stimulus measures (Phoenix News Citation2014), leading to greater reliance on the property-led growth. However, policies focusing on quality and sustainable development remain slow to proceed. For instance, the 70/90 policy targeting supply of small houses has eventually withdrawn and the long-waited legislation of property taxation hasn’t realised yet (Xu Citation2016).
EC7 public mass transit has the largest difference of ranking order between FN (2nd) and CN (12th) experts. This may be explained by different perceptions on its benefits. While its impacts on energy saving, pollution curbing, environmental protection and productivity increase are valued in the developed regions (Litman Citation2011), it is deemed as more powerful when being used to stimulate investment and economic growth in China. The substantial surge of FAI ratio to GDP to 83% in 2016 (NBSC Citation2016) could be one exemplification. Meanwhile, this implies the laggard development of public transport in China at the time of the survey, with its positive effects yet to be fully recognised when urbanisation accelerates. For instance, rapid expansion has been seen recently and 24 cities have built rail transit system by 2015, already doubling the number in 2010 with a total mileage under construction over 229% of that in 2010 (NBSC Citation2016).
Environmental sustainability
FN experts rated EN1, EN2 and EN4 at the 1st, 3rd and 4th places, whereas CN experts put all environmental indicators after the 10th place except for EN2 (2nd), similar to the pattern of ratings on corresponding themes. The convergence on EN2 ratings, however, could involve different factors as cities in the Global North focus on regeneration and brownfield development, while in China, availability of land resources has a critical economic dimension as it largely determines the local financing ability and potential for further growth. For instance, land revenue accounts for about 51% of local revenue during 2011–2016 (NBSC Citation2016) and land transaction prices doubled in many first and second tier cities in 2016 (Sina News Citation2016). However, local governments are increasingly challenged by the ever-limited land resources and have to shift away from new-district development towards more intensive development and regeneration. Shanghai, for example, aims to achieve ‘zero land growth’ by 2020 and keep the total construction land within 3226 km2 (Liberation Daily Citation2014).
EN1 tops all indicators, mainly due to the wide recognition and major achievement of energy-efficient buildings in the Global North (Ameen et al. Citation2015). Yet the distant 1st and 10th place between FN and CN reflects much less awareness and progress in China. This could be ascribed to the fact that currently energy consumption remains being dominated by the industrial sector and limited motivation amongst many developers under property-led growth. With the rapid growth of land and housing prices, developers become more reluctant to this additional investment risk and less patient to wait for its long-term return. However, given the large-scale annual new construction of around 1 billion m2, it ought to have both large environmental and economic benefits especially when energy and environmental crisis emerges under the unprecedented urbanisation of China. It needs to be seriously addressed under the national shift towards consumption-led society (NBSC Citation2016). This actually explains the increasing commitment made by central government recently, for instance it advocates the Paris Protocol by aiming to reduce emissions by 60–65% below its 2005 level in 2030 (BBC News Citation2016). It has also set an ambitious target of 20% green building standards for new construction by 2015 and 50% by 2020 (State Council Citation2013). In practice, however, this remains at only 3% (Sina News Citation2015) with various barriers including limited awareness of the wide benefits of green building and its realisation is still subject to uncertainty.
Social sustainability
Although the theme of social cohesion was ranked as 8th by FN and 14th by CN, both groups placed its correspondent indicator SO3 demolition and relocation towards the bottom (24th). Probably negative impacts of demolition and relocation are regarded by CN as short-term in nature and limited in terms of the number of people affected. The increase in compensation level is deemed to already partly solve the problem. Meanwhile, much higher ratings were given by CN than FN experts to SO1 and SO2, reflecting China’s status with pressing challenges of urbanisation and thus intensifying social problems related to shortage of social housing. This explains the strategic attention paid to the re-establishment of affordable and social housing system since 2010 and expansive construction of 36 million units during the 12th FYP period (2011–2015) (Wang and Murie Citation2011). However, over 190,000 such units were found vacant and more than 10,000 residents cheated to gain eligibility according to the 2015 national auditing (Xinhua Daily Citation2016), reflecting again the priority on rapid and scale expansion rather than procedural efficiency.
Institutional sustainability
To CN experts, 5 indicators (IN1–4, IN6) amongst the top eight belong to institutional theme, only below EC1, EN2, SO1 and ahead of EN1 Further, IN1 IN5 and IN7 have all obtained much higher rating by CN than FN experts. This affirms the profound impacts of institutions, especially its applicability to China where there are more frequent institutional changes, less legal certainty and more decision-making powers of governmental sectors (Qian Citation2007). For instance, the power of official appointment retained by the central government, despite continued decentralisation, and the focus on GDP growth as a key selection criterion have strengthened the dominance of government and the preference on rapid growth at all levels (Wu Citation2016). However, insufficiency and uncertainty of policy and legal guidance, particularly those on qualitative and sustainable development, e.g. housing size regulation, property taxation, property rights law, legislation of environmental protection, have fundamentally shaped the collective urban problems in the above-mentioned socio-economic and environmental sectors. The rise of local entrepreneurialism and weakened role of planning in development control (Cao Citation2015; Wu Citation2015b) provides limited mitigation over negative consequences of these problems. There are some recent attempts for long-term urban and industry planning, power restructuring amongst governments. This is more in response to the threats to economic stability after the massive stimulus and emerging risks than to environmental and social factors. However, several rounds of macro control policies have yielded rather mixed impacts on housing price growth. The realisation of sustainable development goals still relies on the creation of adaptive and comprehensive institutions that underpin it consistency.
Discussion
Besides the general support for the ‘Quadruple Bottom Line’ and overall consistency on survey ratings, the trend of variation amongst FN and CN groups is more evident when particular indicators are considered. Figure maps the mean ratings of all 26 indicators by two groups separately and combined. It is clear that the FN trajectory favours environmental area while the CN one emphasises institutional (e.g. legal and policy framework, law enforceability and government transparency) and social factors (e.g. urbanisation and social housing). This reflects the urban context and institutional conditions of China, which should be considered when gauging its sustainability (Shen et al. Citation2011). It could also have transferable lessons to other developing countries that despite different contextual settings often see highly transitional public and social status, weaker governance capacities and unplanned urban expansion (UN-HABITAT Citation2016). This, however, suggests an entrenched perception that cities in developed countries become intrinsically more sustainable than those in developing ones due to the greater emphasis on environmental indicators (Mori and Yamashita Citation2015).
Figure 4. Indicator ratings by FN, CN and all participants.
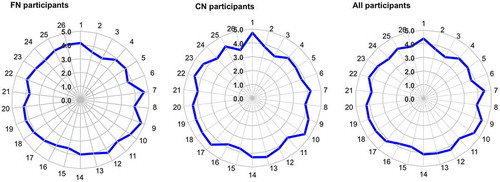
Noticeably, economic growth is such an overarching goal over all sectors that there is a clear economic prioritisation in China even amongst the top environmental and social indicators, this is not similarly weighted in the developed nations.Footnote 3 For instance, urbanisation (SO1) with its unique pace and land recycling (EN2) under the property-led development model, are considered as critically linked with cities’ growth potential by providing essential driving forces and resources for expansion. Property development and investment are subordinate to economic growth, and government intervenes mainly when the sector negatively impacts economic stability. The recent increased attention on the public mass transit (EC7) is more related to its economic impacts on investment than social and environmental benefits. Institutions are created to focus on quantitative expansion while neglecting qualitative improvement in all relevant sectors. The rapid quantitative growth of social housing provision (SO2), though with emerging problems in location, distribution and management (Cao Citation2015), is more a reflection on the recognition of its threats to economic and political foundation, than an attempt for long-term social cohesion. The frustrated progress of energy-efficient buildings (EN1) is also an indication of its limited economic benefits at the current stage of development.
These factors are likely to remain applicable to China for the foreseeable future with an incremental transition. The discussions on post-survey developments reinforce the relevance of indicator system and its explanatory power in providing understanding and prediction for new changes as well as their drivers and impacts.
A key point of discussion is that the concept of sustainable development is understood differently due to the local economic and political context and development conditions and status. In China, economic sustainability is regarded as the primary foundation for other SD sectors, giving rise to a greater contribution made by economic and social sustainability than environmental sustainability (Dijk and Zhang Citation2005). The fundamental motivation is likely to remain on realising longer-term and healthier development of economy, although more efforts are recently made in reducing speed of economic growth and investing in environmental and social development. The ever-increased role of property-led urban development is one manifestation.
However, economic growth should not be achieved at the expense of environmental and social considerations which has arguably been the case of China’s property led urban development thus far. However, the scales are now beginning to shift towards a more balanced approach at least at the higher governmental levels., This can be seen in the firmer commitment of the central government to its internationally leading role in combating climate change (BBC News Citation2016) and its urban development policy shift towards enhancing overall sustainability while emphasising environmental quality (Huang et al. Citation2016). The indicator system developed in this paper, however, provides a contextualised understanding of the differentiated roles of SD pillars and their interactions with property led development at the urban scale thereby providing a clearer perspective for analysis and policy intervention at the local level causes of impacts. A main challenge for the Chinese context is to enable institutional factors to play a key role in changing attitudes and providing regulatory and political incentives for adopting more sustainable perspectives.
Conclusion
Achieving greater sustainability in cities in developing countries that are characterised by economic-growth oriented priorities, unprecedented urbanisation, unplanned extensions, laggard services and infrastructure, informal housing and jobs and weak governance remains a great challenge (Ding et al. Citation2015). None of the global indicators fit all circumstances (Shen et al. Citation2011) and sustainability has been and should be approached differently in the developing countries. This study marks a new step towards a conceptual framework for addressing sustainable growth in any meaningful sense in the context of the ever-more dominant property-led urban development in China. It extends the explanatory power of existing indicators by including the institutional sector, and improves the current quantitative bias (Singh et al. Citation2009) by incorporating qualitative evaluation (Scerri and James Citation2010). Compared to indicators in developed nations, these context and subject-specific indicators show much greater suitability to cities in developing countries with high level of economic activities concentrating in property and infrastructure development in a context of rapid growth and weak institutional framework (e.g. Ameen et al. Citation2015). This provides a timely and more flexible approach for interpretation and prediction in these localities (Wu Citation2016). The complex development experience of China becomes more applicable internationally along with its growing involvement abroad, but in-depth understanding would be less likely without seeing the central role of property in urban development, and therefore its impact on sustainable development. This study provides a solid foundation for scrutinising the sophisticated relations between property and sustainability.
It has the potential to inform decision-making through identifying problems, trends, causes, which was attempted through utilising indicators in discussing recent literature and urban development. Such application, though, needs to be treated as dynamic rather than static, reflecting the transitional status of economies in the developing countries. It is not devised for copying, but for adaptation in policy-making. The importance and connotations of these indicators may change over time, and need adjustment, when urban growth moves forward, sustainability prioritised and property-led urban development reformed/modified. Wider application of the system is needed for further tests and utilisation/adjustment in cities of China and/or other developing countries. This paper is an attempt to facilitate that process.
Disclosure statement
No potential conflict of interest was reported by the authors.
Notes
1. A free market dominance advocated by economists such as Milton Friedman in the 1970s and implemented by Thatcher and Reagan governments in UK and US in the 1980s (Springer et al. Citation2016).
2. Is characterised by strong state intervention and extensive regulation and planning in promoting a development agenda such as developing infrastructure capacity, economic growth, and some social welfare etc. (Cao Citation2009).
3. This does not mean less attention paid to economic growth per se in the developed nations but that it has to be better balanced with higher ratings for environmental and social indicators. Whereas, the highly rated environmental and social indicators in China are also related to their impacts on economic growth.
References
- Adair A , Berry J , McGreal S , Hutchison N , Watkins C , Gibb K . 2003. Urban regeneration and property investment performance. Journal of Property Research. 20(4):37–386.
- Ameen RFM , Mourshed M , Li H . 2015. A critical review of environmental assessment tools for sustainable urban design. Environ Impact Assess Rev. 55:110–125.10.1016/j.eiar.2015.07.006
- Arvanitidis P. A. 2006. Property market purpose efficiency: an exploratory analysis from an institutional economics perspective. The 46th Congress of the European Regional Science Association (ERSA),Volvos, Aug 30–Sep 3.
- Ball M , Lizieri C , MacGregor BD . 1998. The economics of commercial property markets. Routledge.
- BBC News . 2016. China and US climate pledge sets course for future of Paris deal. [accessed 2016 Nov 30]. http://www.bbc.com/news/science-environment-37261246.
- Bell S , Morse S . 1999. Sustainability indicators: measuring the immeasurable? London: Earthscan.
- Bell S , Morse S . 2008. Sustainability indicators: measuring the immeasurable?. 2nd ed. London.
- Bertaud A. 2007. Urbanisation in china: land use efficiency issues. [accessed 2015 Nov 30]. http://alain-bertaud.com/AB_Files/AB_China_land_use_report_6.pdf.
- Bourdic L , Salat S , Nowacki C . 2012. Assessing cities: a new system of cross-scale spatial indicators. Build Res Info. 40:592–605.10.1080/09613218.2012.703488
- Burton E . 2002. Measuring urban compactness in UK towns and cities. Environment and Planning B: Planning and Design. 29(2):219–250.
- Cao JA . 2009. Developmental state, property-led growth and property investment risks in China. J Property Investment Finance. 27:162–179.
- Cao JA , Keivani R. 2007. Why china? Why now? The role of property markets in supporting economic and social development in china. RICS (Royal Institution of Chartered Surveyors) & Shui On Land.
- Cao JA . 2015. The Chinese real estate market: development, regulation and investment. Abingdon: Taylor and Francis.
- Chambers N , Simmons C , Wachernagel M . 2000. Sharing nature’s interest. London: Earthscan.
- Chen C . 2005. Institutional legitimacy of an authoritarian state, china in the mirror of eastern europe. Problems of Post-Communism. 52(4):3–13.
- Chigora P . 2007. Power in global governance. Alternatives Turkish J Int Relat. 14:387–403.
- Cox W , Pavletich H . 2015. The12th annual Demographia international housing affordability survey 2016: rating middle-income housing affordability. [accessed 2016 Nov 28]. http://www.demographia.com/dhi.pdf.
- [DEFRA] Department for Environmental Food and Rural Affairs . 2005. Securing the future: delivering UK sustainable development strategy.
- Dijk MPV , Zhang M . 2005. Sustainability indices as a tool for urban managers, evidence from four medium-sized Chinese cities. Environ Impact Assess Rev. 25:667–688.10.1016/j.eiar.2004.10.001
- Ding X , Zhong W , Shearmur R , et al . 2015. An inclusive model for assessing the sustainability of cities in developing countries – Trinity of cities sustainability from spatical, logical and time dimensions (TCS-SLTD). J Clean Prod. 109:62–75.10.1016/j.jclepro.2015.06.140
- E-House China R&D Institute . 2015. Ranking of housing price to earning ratio in 35 Chinese cities.
- Fan P , Qi J . 2010. Assessing the sustainability of major cities in China. Sustain Sci. 5:51–68.10.1007/s11625-009-0096-y
- Fischer TB . 1999. The consideration of sustainability aspects in transport infrastructure related policies, plans and programmes: a comparative analysis of North West England, Noord-Holland and Brandenburg-Berlin. J Environ Plan Manage. 42:189–219.10.1080/09640569911217
- Fischer TB , Dalkmann H , Lowry M , et al . 2010. The dimensions and context of transport decision making. In: Joumard R , Gudmundsson H , editors. Indicators of environmental sustainability in transport. Paris: Les collections de l’Inrets; p. 79–102.
- German Development Institute. 2008. Energy efficiency in buildings in china - policies, barriers and opportunities.
- Ghosh S , Vale R , Vale B . 2006. Indications from sustainability indicators. J Urban Des. 11:263–275.10.1080/13574800600644597
- Giovannini E , Linster M . 2005. Measuring sustainable development: achievements and challenges. New York (NY): UNDSD Expert Group Meeting.
- Goldwurm M , Santini M . 1993. Key issues in property-led urban restructuring: a European perspective. J Property Valuation Invest. 11(4):339–353.
- He S , Wu F . 2007. Socio-spatial impacts of property-led redevelopment on China’s urban neighbourhoods. Cities. 24:194–208.10.1016/j.cities.2006.12.001
- Healey P . 1992a. An institutional model of the development process. Journal of Property Research. 9:33–44.10.1080/09599919208724049
- Healey P . 1992b. Rebuilding the city: property-led urban regeneration. London: E & FN Spon.
- Hemphill L , Berry J , McGreal S . 2004. An indicator-based approach to measuring sustainable urban regeneration performance: Part 1, conceptual foundations and methodological framework. Urban Stud. 41:725–755.10.1080/0042098042000194089
- Huang L , Yan L , Wu J . 2016. Assessing urban sustainability of Chinese megacities: 35 years after the economic reform and open-door policy. Landsc Urban Plan. 145:57–70.
- [IISD] International Institute for Sustainable Development . 1997. Assessing sustainable development: principles in practice.
- Jacobs M . 1991. The green economy. London: Pluto Press.
- Jenks M , Burgess R . 2000. Compact cities: sustainable urban forms for developing countries. London: E. & F.N. Spon.
- Jia Z , Meng Q . 2008. International comparison study on social housing provision. Ltd: China Merchants Securities Co.
- Keivani R , Parsa A , McGreal S . 2001. Globalisation, institutional structures and real estate markets in central european cities. Urban Studies. 38(13):2457–2476.
- Keogh G , D'Arcy E . 1994. Market maturity and property market behaviour: a European comparison of mature and emergent markets. Journal of Property Research. 11(3):215–235.
- Keogh G , D’arcy E . 1999. Property market efficiency: an institutional economics perspective. Urban Stud. 36:2401–2414.10.1080/0042098992485
- Kidd S , Fischer TB . 2007. Towards sustainability: is integrated appraisal a step in the right direction? Environ Plan C Gov Policy. 25:233–249.10.1068/c57 m
- Lam D . 2008. The reality of environmental sustainability in China. City. 12(2):245–254.
- Lee JW , Jones PS , Mineyama Y , et al . 2002. Cultural differences in responses to a likert scale. Res Nurs Health. 25:295–306.10.1002/(ISSN)1098-240X
- Liberation Daily . 2014. Shanghai to realise ‘zero growth’ of total planned construction land by 2020. http://www.gov.cn/xinwen/2014-04/25/content_2666424.htm.
- Litman T . 2011. Evaluating public transit benefits and costs – best practices guidebook. Victoria: Victoria Transport Policy Institute.
- McCann EJ . 2004. Urban political economy beyond the 'Global City'. Urban Studies. 41(12):2315–2333.
- McKinsey . 2010. The Urban Sustainability Index: a new tool for measuring China’s cities.
- Mori K , Yamashita T . 2015. Methodological framework of sustainability assessment in City Sustainability Index (CSI): a concept of constraint and maximisation indicators. Environ Impact Assess Rev. 45:10–14.
- [NBSC] National Bureau of Statistics of China . 2016. Annual statistic report on domestic economic and social development of People’s Republic of China. [accessed 2017 May 12]. http://www.stats.gov.cn/tjsj/zxfb/201702/t20170228_1467424.html.
- Neumayer E . 1999. Weak versus strong sustainability: exploring the limits of two opposing paradigms. Cheltenham: Edward Elgar.
- North DC . 1990. Institutions, institutional change and economic performance. Cambridge: Cambridge University Press.10.1017/CBO9780511808678
- [OECD] Organisation for Economic Co-operation and Development . 2005. Measuring sustainable development.
- Pearce D . 1994. Blueprint 3: measuring sustainable development. London: Earthscan.
- Phoenix News . 2014. The phenomena of local rescue: insufficient remedy if applying 2008 bailout policy. [accessed 2017 May 12]. http://finance.ifeng.com/a/20140813/12912157_0.shtml.
- Qian Z . 2007. Institutions and local growth coalitions in China’s urban land reform: the case of Hangzhou High-Technology Zone. Asia Pacific Viewpoint. 48:219–233.10.1111/apv.2007.48.issue-2
- Samara TR , He S , Chen G . 2013. Locating right to the city in the Global South. London: Routledge.
- Scerri A , James P . 2010. Accounting for sustainability: combining qualitative and quantitative research in developing ‘indicators’ of sustainability. Int J Soc Res Method. 13:41–53.10.1080/13645570902864145
- Shen L-Y , Ochoa J , Shah M , et al . 2011. The application of urban sustainabilty indicators – a comparison between various practices. Habitat Int. 35:17–29.10.1016/j.habitatint.2010.03.006
- Sina News . 2015. The new-built green building only accounts for 3% of total new construction. [accessed 2016 May 1]. http://news.dichan.sina.com.cn/2015/07/01/1078589.html.
- Sina News . 2016. The mystery of land king: from the perspective of land financing. [accessed 2016 May 1]. http://finance.sina.com.cn/review/jcgc/2016-08-24/doc-ifxvcsrm2357254.shtml.
- Singh RK , Murty HR , Gupta SK , et al . 2009. An overview of sustainability assessment methodoligies. Ecol Indic. 9:189–212.10.1016/j.ecolind.2008.05.011
- Sinha KC . 2003. Sustainability and urban public transportation. Journal of Transportation Engineering. 129(4):331.
- Springer S , Birch K , MacLeavy J . 2016. The handbook of neoliberalism. Abingdon: Routledge.
- Staley SR . 2006. Institutional considerations for sustainable development policy implementation: a US case study. Property Manage. 24:232–250.10.1108/02637470610660138
- State Council . 2013. Green Building Action Plan. [accessed 2015 Jul 10]. http://legal.china.com.cn/2013-01/08/content_27618238_2.htm.
- [UN] United Nations . 2007. Indicators of sustainable development: guidelines and methodologies.
- UN-HABITAT . 2016. Urbanisation and development: emerging futures.
- [UNCED] United Nations Conference on Environment and Development . 1992. The Rio declaration on environment and development.
- [UNCSD] United Nations Commission on Sustainable Development . 2001. Indicators of sustainable development: guidelines and methodologies. [accessed 20 Jan 2008]. http://www.un.org/esa/sustdev/natlinfo/indicators/guidelines.pdf.
- Wang Y . 2000. Housing reform and its impacts on the urban poor in China. Hous Stud. 15:845–864.10.1080/02673030020002573
- Wang Y , Lam KC , Harder MK , et al . 2013. Developing an indicator system to foster sustainability in strategic planning in China: a case study of Pudong New Area, Shanghai. Ecol Indic. 29:376–389.10.1016/j.ecolind.2013.01.007
- Wang YP , Murie A . 2011. The new affordable and social housing provision system in China: implications for comparative housing studies. Int J Hous Policy. 11:237–254.10.1080/14616718.2011.599130
- [WCED] World Commission on Environment and Development . 1987. Our common future. Oxford: Oxford University Press.
- Woetzel J , Mendonca L , Devan J , Negri S . 2008. Preparing for china's urban billion. McKinsey Global Institute.
- Wu F , Xu J , Yeh AG-O . 2007. Urban development in post-reform china: state, market, space. London: Routledge.
- Wu F . 2015a. Commodification and housing market cycles in Chinese cities. Int J Hous Policy. 15:6–26.10.1080/14616718.2014.925255
- Wu F . 2015b. Planning for growth: urban and regional planning in China. Abingdon: Routledge.
- Wu F . 2016. Emerging chinese cities: implications for global urban studies. The Professional Geographer. 68:338–348.10.1080/00330124.2015.1099189
- Xinhua Daily . 2016. Affordable housing is found vacant, but accountability shouldn’t be. http://news.xinhuanet.com/mrdx/2016-08/11/c_135584752.htm.
- Xu J , Yeh A . 2009. Decoding urban land governance: state reconstruction in contemporary Chinese Cities. Urban Stud. 46:559–581.
- Xu Y . 2013. Property-led urban development in china: role, impact and future. Scholars' Press.
- Xu Y . 2016. Property tax reform and property valuation practice in UK: lesson for China (in Chinese). Real Estate Info Chin. 9:21–23.
- Xu Y . 2017. Property-led urban growth, institutional change and urban sustainability: the case of China in an international perspective. In: Caprotti F , Yu L , editors. Sustainable cities in Asia . London: Routledge; p. 322.
- Zhao B . 2017. China’s ‘One Belt, One Road’ initiative: ‘A new silk road linking Asia, Africa and Europe’. http://news.xinhuanet.com/english/2017-05/02/c_136250141.htm.
- Zhu J . 2005. A transitional institution for the emerging land market in urban China. Urban Stud. 42:1369–1390.10.1080/00420980500150714