
ABSTRACT
This article proposes a complex network methodology for the process of Environmental Impact Assessment (EIA) that limits subjectivity and reduces uncertainty by incorporating elements of complex systems theory in the stages of identification and assessment of the significance of environmental impacts. The proposed methodology reduces the sources of uncertainty, which emerge from the use of simplified models that analyse the environment-activity interactions in a unidirectional fashion. This proposal determines the significance of environmental impacts through multidirectional or complex causal relationships. Likewise, it limits the subjectivity of the evaluator by using these causality relationships instead of criteria based on the impacts’ attributes. The application of the proposed methodology demonstrates the advantages of (i) prioritizing the impacts according to their capacity to interact with other impacts, and (ii) the possibility to redirect the environmental management plans towards the prevention of impacts of higher complexity and to reduce the importance of derived impacts.
The application of the proposed methodology reveals that the percentage of irrelevant and moderate impacts is reduced, whereas the percentage of severe and critical impacts increase, in comparison to the conventional methodologies.
1. Introduction
‘Environmental Impact Assessment (EIA) is a systematic process that examines the environmental consequences of development actions, in advance. The emphasis, compared with many other mechanisms for environmental protection, is on prevention. Of course, planners have traditionally assessed the impacts of developments on the environment, but invariably not in the systematic, holistic and multidisciplinary way required by EIA’ (Glasson et al. Citation2012, p. 5).
The EIA aims at improving environmental awareness and attitudes and seeks to guarantee that the environmental values are included in the decision-making processes. These are steps towards the achievement of ecological sustainability and the conformation of sustainable communities (Arts et al. Citation2012; Bond Citation2015).
The EIA involves the generation of information about possible changes that may occur in the environment (Jha-Thakur and Fischer Citation2016; Therivel and Wood Citation2018) and sustainable development (Loomis and Dziedzic Citation2018).
The Environmental Impact Statement (EIS) is the document that presents the findings of a EIA (including proposed mitigation measures) and is submitted to the competent authority responsible of the decision-making if the project, civil work or activity is approved and put into operation (Glasson et al. Citation2012; Therivel and Wood Citation2018).
The methodologies for evaluating the significance of environmental impacts have a predictive approach because they aim at analysing the interaction between Projects, Works or Activities (PWAs) and the features of the environment in order to build a representation of future events, such as environmental impacts. Therefore, it is necessary to clearly establish the difference between predictive and anticipatory systems. Anticipation is a future-oriented action, decision or behaviour based on a prediction (Pezzulo et al. Citation2008). In the context of EIA, predictions are made with regard to the environmental impacts, and those impacts are also anticipated through the use of corrective measures.
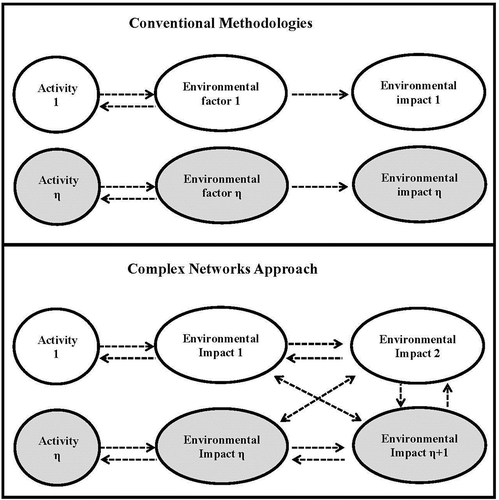
Most of these methodologies are based on the unidirectional analysis of the link between activities and environmental factors (Leopold et al. Citation1971; Sadler Citation1996; Pastakia and Jensen Citation1998; Conesa Citation2010; Gómez Orea Citation2013; Suyono et al. Citation2016). They normally ignore that environmental impacts are the result of complex multidirectional interactions between activities, environmental factors and impacts ().
Figure 1. Comparative approach to the EIA.
The results of the conventional methodologies can be biased and/or easily manipulated because they lack objective indicators, so the significance of the environmental impacts is assessed solely according to the evaluator’s criteria (Sadler Citation1996; Wood Citation2003; Toro et al. Citation2013; Drayson et al. Citation2017; Loomis and Dziedzic Citation2018). This potential manipulation acts normally in favour of the proposed PWAs and in detriment of the natural resources and communities (Sadler Citation1996; Loomis and Dziedzic Citation2018).
The conventional methodological approaches have significant limitations, especially when predicting the environmental impacts that PWAs can generate (Sadler Citation1996; Canter and Sadler Citation1997). To this respect, Morgan (Citation2012) affirms that in spite of the methodological progresses, the evidence confirms the necessity of strengthening the methodologies for the evaluation of the impacts’ significance.
This is because the environment is a complex system, characterized by a high number of components (Boccaletti et al. Citation2006; Okpara et al. Citation2018) of various types (physical, biotic, social, economic and cultural) and with particular intrinsic features (Therivel and Wood Citation2018). For this reason, the EIA requires the participation of multidisciplinary teams.
A major concern of EIA is related with the uncertainties of the methodologies for identifying and evaluating environmental impacts (Tennoy et al. Citation2006; Chivat Citation2016; Leung et al. Citation2016). Audit studies show that the actual environmental impacts of PWAs may differ significantly from the expected or assessed impacts in EIAs (Tennoy et al. Citation2006), a situation recently confirmed by Leung et al. (Citation2015) and Jones and Fischer (Citation2016). As a result, the assessment of the impacts may be smaller than the actual impact. This may explain why the corrective measures do not correspond to the intensity or significance of the impacts, therefore ‘increasing the risk of environmental deterioration in the area of influence of the project’ (Toro et al. Citation2013, p. 9).
This paper presents a methodology for EIA based on complex network theory, particularly a technique based on network analysis, which was developed by the authors and can be used independently or as a complement for qualitative methodologies, such as those proposed by Leopold et al. (Citation1971), Pastakia and Jensen (Citation1998), Gómez Orea (Citation2013), Conesa (Citation2010), and Suyono et al. (Citation2016).
This methodology helps reduce some of the main uncertainty sources of EIA identified by Lohani et al. (Citation1997, p. 52), such as the use of theoretical frameworks that fail at grasping the environmental complexity and methodological models for evaluating the significance of environmental impacts that analyse the environment-anthropogenic activity interactions in a simplified fashion and not from a complex and multidirectional perspective.
Likewise, this methodology allows analysing cumulative impacts, defined as the result of the presence of multiple projects (Franks et al. Citation2013); the interaction of several activities; the sum of the total effects on a resource, ecosystem or human community (U.S. Environmental Protection Agency Citation1999); or the impacts that increase progressively when the action generating them is persistent (Conesa Citation2010).
These features are incorporated in the proposed methodology: it allows establishing the interaction between activities by determining the possible impacts on the same environmental factor and facilitating the identification of additive effects, thus improving the quality of the studies (Connelly Citation2011).
The complex network theory has been utilized for the research in the fields of engineering, medicine, economics, computing, aviation and mathematics (Zhao et al. Citation2006; Ya-Juan et al. Citation2010; Liu et al. Citation2011; Pan et al. Citation2011; Wang et al. Citation2012; Papo et al. Citation2014). However, its application in the field of environmental impact assessment is scarce.
Networks have been generally used in EIA (Glasson et al. Citation2012) but only as a graphic representation of simple relationships between activities and environmental impacts. The scope of this work is wider because it goes further and uses the network analysis to determine the significance of the impacts, thus becoming a tool that allows identifying the most representative impacts generated by the PWAs.
The proposal made by this work revealed a higher objectivity in the evaluation of the impacts’ significance in comparison with other methodologies (Conesa Citation2010). We include as evidence the results of the application of this methodology in a real project validated by the Colombian environmental authority. Additionally, the application of this methodology for the evaluation of environmental impacts in wetlands was approved by the environmental authority of Bogotá, capital city of Colombia.
This article is divided into six sections. After this introduction, the second presents the concept of uncertainty and subjectivity, together with the sources in EIA. Section three presents the conceptual foundations of complex networks and how this approach can be used to reduce uncertainty and limit the subjectivity in EIA. The fourth section presents the methodology for EIA based on network analysis and explains the procedure for its application. In the fifth section an application of the proposed methodology is presented in order to analyse its scope and performance; in addition, the results are compared with those of a qualitative methodology in EIS. Finally, section six presents the conclusions and discusses the advantages and limitations of the proposed methodology.
2. Uncertainty and subjectivity in EIA
Uncertainty is defined as the lack of certainty due to incomplete information, statistical variability, contingency of the explanatory models and randomness (Institute of Medicine Citation2013, p. 38). From a metrological perspective, uncertainty considers all possible sources of error that can take part in a result. The ISO defines it as ‘an estimate linked to the result of a trial that characterizes the range of values within which the true value is placed’ (International Organization for Standardization Citation1993). Although this definition has little practical application since the ‛true value’ cannot be accurately known, it points out that uncertainty implies doubts about the veracity of a result (Institute of Medicine Citation2013).
Academics widely recognize that uncertainty is rooted in at least two conditions (Kamal and Burkell Citation2011): (i) internal uncertainty, which is related to a lack of knowledge about a particular event or phenomenon and can be reduced or eliminated by improving knowledge, and (ii) external uncertainty, which is comparable to random uncertainty, and cannot be reduced by the stochastic characteristics of the behaviour of complex natural phenomena.
Uncertainty in EIA usually emerges because most EIS are conducted in a ‘without project’ scenario, especially regarding the identification and evaluation of environmental impacts. Research about the accuracy of EIAs has shown that ‘42% of the predictions were deemed accurate, 29% nearly accurate and 29% inaccurate, indicates that the prediction performance of EIA is not satisfactory’ (Tennoy et al. Citation2006, p. 52).
One aspect that increases uncertainty in EIA is the use of qualitative methodologies for the evaluation of the significance of environmental impacts. These conventional approaches are based on the qualification of attributes (intensity, magnitude, recoverability) and do not have a clear conceptual framework, therefore lacking scales that can be adapted to any project. In this manner, the scales and assessments can be interpreted and applied by practitioners without complying with any technical justification, thus implying an additional difficulty when comparing projects. To this respect, Therivel and Wood (Citation2018, p. 46) affirm: ‘Finally, all [predictive methods] have a degree of uncertainty should be validated throughout the life of a project’, and Morris and Therivel (Citation2009, p. 9) state that ‘impact prediction is not an exact science.’
Regarding the use of these attributes, it is important to point out that the lack of indicators and scales for their qualification does not allow incorporating the complexity of the environment, since most of them correspond with adjectives such as low, partial, high and very high, chosen according to evaluation criteria that also have a quantitative equivalent. For example, for the appraisal of the intensity of the impact in the methodology proposed by Conesa (Citation2010), the options of qualitative qualifications are low, medium, high, very high or total, with quantitative correspondences 1, 2, 4, 8 and 12, respectively. ‘The qualitative calculation of Impact Importance is carried out by applying a generic mathematical formula (Equation 1) composed of a series of attributes that have been graded by an evaluator’ (Toro et al. Citation2013). The numerical result evaluates the impact significance as irrelevant (0≤ Imp<25), moderate (25≤ Imp<50), severe (50≤ Imp< 75) or critical (Imp≥75) (Conesa Citation2010).
Where Imp: importance, I: intensity, Ex: extension, Mo: moment, Pe: persistence, Rv: reversibility, Sy: synergy, Ac: accumulation, Ef: effect, Pr: periodicity, Rc: recoverability. For a detailed explanation of this methodology, please consult Conesa (Citation2010) or Toro et al. (Citation2013, p. 11).
Lawrence (Citation2007) states that the evaluation of the significance of impacts is one of the hardest and most complicated processes, due mainly to the evaluators’ subjectivity. The imprecision of primary information is another factor that explains uncertainty in EIA, since often the critical data necessary to make forecasting consist of assumptions about the future. Thereby, predictions involving links between interacting assumptions can lead to relevant uncertainties.
Furthermore, the project dynamics may involve unforeseen changes leading to a gap from planned to implemented predictions, therefore affecting mitigation measures formulated to avoid or reduce undesirable environmental impacts (De Jongh Citation1988; Teigland Citation2000; Glasson et al. Citation2012).
With respect to subjectivity, there is consensus on the fact that it is a quality of being based on personal feelings, tastes, or opinion.Footnote1 A main affirmation from the theory of evaluation is that the evaluators’ subjectivity is associated with emotions and values which are characteristic of the personal meaning attributed to external events (Pezzulo et al. Citation2008). Values are beliefs regarding what is important in a process; in EIA, these values are used to decide which methodology should be applied and how to approach the evaluation. Values also influence the scope, data and budgets used in the EIA (Wilkins Citation2003).
Zhang et al. (Citation2018) affirm that EIA is always associated with uncertainty and subjectivity, particularly in the identification, prediction and evaluation of impacts. Subjectivity in EIA highlights the values, scopes and origins of the impacts; however, the nature of the decision-making process is political because the EIA can be used to publicly support or oppose a project, and it can be biased in favour or against environmental sustainability. Therefore, a crucial step in the EIA process is not eliminating subjectivity, but rather establishing limits or guidelines (Bojórquez-Tapia and García Citation1998) aimed at guaranteeing sustainable development (Therivel and Wood Citation2018).
Subjectivity without limits may generate simplified assumptions and structural errors through the use of models that simplify the systems (De Jongh Citation1988). It may bias the researcher and block the objective understanding of reality. Subjective information contains the point of view of the person exposing it and is influenced by their interests and wishes (Tagliani and Walter Citation2018).
Other factors that can reduce uncertainty and limit subjectivity may be the use of better quality baseline information, mathematical modelling, and the development of models and methodologies that develop causal relationships and effects (De Jongh Citation1988; Teigland Citation2000).
3. Complex network analysis to reduce uncertainty and bias in EIA
Complex networks are an effective tool for this purpose, because they allow predicting the occurrence of events in the environment, which as a chaotic system is characterized by a high sensitivity to its initial conditions (i.e. it can be affected by the smallest disturbance) and by the emergence of new properties. This approach allows grasping the complexity of the environmental systems and enables the analysis of multidirectional interactions between all of its components, including those that generate impacts (Barabási, Citation2012; Ren et al. Citation2018).
Regarding complex networks, Ch and Zhao (Citation2016, p. 15) state:
Complex network comprises an emerging interdisciplinary research area. Complex network structures describe a wide variety of systems of high technological and intellectual importance, such as the Internet coupled biological and chemical systems, financial, social and communication.
According to Cárdenas (Citation2016), the network analysis is a theoretical and methodological approach focused on the study of relationships. This approach allows processing, examining and visualising a wide spectrum of elements and their possible relationships by using the theory of graphs.
A complex network is a ‘system of nodes with connecting links’ or a graphic representation of a set of elements (nodes) and their multidirectional interactions (links or connections). It is named ‘complex’ due to the non-lineal, multidirectional interaction between the elements, and also because the behaviour of the analysed system cannot be predicted by isolating its components (Munguía-Rosas and Montiel Citation2013; Ch and Zhao Citation2016), which is the regular procedure followed by the traditional or qualitative methodologies proposed by Leopold et al. (Citation1971); Dee et al. (Citation1973); Pastakia and Jensen (Citation1998); Gómez Orea (Citation2013) and Conesa (Citation2010).
An adjacency matrix is used to elaborate the network. This is a logical and systemic approach that emerged from combinatorics and helps analysing and understanding the system by providing a simple way to represent relationships, and thus characterising their organisation or structure (Geetha and Sekar Citation2016). For a more thorough mathematical description of complex networks, please consult Boccaletti et al. (Citation2006); Ch and Zhao (Citation2016), Geetha and Sekar (Citation2016) or Ren et al. (Citation2018).
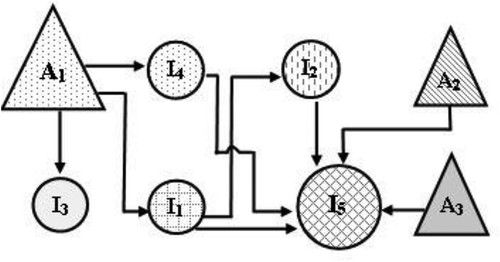
The graphic representation of a complex network depicting the actions of a project and the generated impacts is presented in . The nodes can be either actions (triangles) or environmental impacts (circles). The size of the node indicates its total degree (number of relationships) and the arrows represent the relationship between the nodes and its direction.
Figure 2. Environmental impact network modelled as a graph.
The network analysis allows reducing (not eliminating) uncertainty in EIA by enabling a more accurate identification and evaluation of the impacts’ significance, because it focuses on the analysis of interactions between the environmental components affected by the impacts defined in the scoping stage of the EIA (Therivel and Wood Citation2018) and not on the evaluators’ criteria, thus attenuating the bias and improving the decision-making processes related to management measures.
The use of causality networks in EIA has been reported in specialized literature (Perdicoúlis and Glasson Citation2006; Perdicoúlis Citation2010). However, in these studies the evaluation of impacts is analysed in a simple, unidirectional fashion, for example graphs depicting relationships between activities and impacts and cause-effect charts.
In this sense, the proposed methodology is relevant because it offers an analytical method that allows analysing the complex interrelationships between the projects and the environment, and it evaluates the impacts as consequences of activities, and at the same time, as the cause of subsequent impacts. Therefore, the methodology contributes to solving the difficulties in the analysis of cumulative impacts, which according to Connelly (Citation2011) and Pavlickova and Vyskupova (Citation2015) has had a moderate progress.
4. Network analysis of EIA: methodological proposal
4.1. General characteristics
The EIA methodology based on network analysis utilizes an adjacency matrix in which the activities and the environmental impacts are shown in rows and columns, allowing the assessment of environmental impacts based on their ability to interact with other impacts, thereby guiding Environmental Management Plans (EMP) towards prevention, correction and mitigation. This implies broadening the concept of environmental impact as an element generating new impacts, which can be secondary, tertiary, and not only seen just as a consequence of project activities.
Since this methodology does not use attributes to evaluate the environmental impacts the possibility of influencing the results is limited and the actions are focused on answering the question: is the analysed impact a direct repercussion of another impact or of a peculiar activity? Similarly, the subjective evaluations of impacts are limited, because the methodology avoids questions based on the assessment of qualitative attributes, for example whether the impact intensity is low, medium, high, very high or total. Further, the results of the evaluation can be analysed graphically, in order to facilitate decision-making and the consultation of results by all the interested stakeholders.
4.2. Application procedure
The EIA methodology based on network analysis has three stages, as described below.
Stage 1. Identification of potentially impacting project actions.
In this stage the possible positive and negative impacts generated by the project are identified. Activities are likely to generate impacts if they (Conesa Citation2010; Therivel and Wood Citation2018):
Modify the use of land.
Generate emissions of pollutants into the atmosphere, surface water and groundwater and/or soil.
Involve overexploitation of raw materials, energy consumption and/or water consumption.
Involve under-exploitation of agricultural.
Act on the biotic environment.
Lead to the deterioration of the landscape.
Affect infrastructures; modify the social, economic and cultural environment.
And involve non-compliance with current environmental regulations.
Stage 2. Identification of potentially impacted environmental factors.
This stage consists of identifying the environmental factors on which changes (positive or negative) can be generated by the actions of the PWAs. A checklist is proposed for this step (see ).
Table 1. Environmental components and factors (Morris and Therivel Citation2009; Conesa Citation2010).
The objective of this stage is to create a list of environmental factors susceptible of being impacted, and grouped according to the category to which they belong.
Stage 3. Hierarchical ranking of impacts
The third stage seeks to rank environmental impacts according to their Potential Impact (PI), e.g. the ability to interact with other impacts. This stage consists of four steps:
i) Identification of potential environmental impacts. A ‘double-entry matrix’ is used to identify environmental impacts. For this step, the components and environmental factors on which impacts can be generated should be located in the first and second columns, and in rows 1 and 2, column 3 onwards, the potentially impacting stages and activities of the project (). Subsequently, for each cell it should be determined whether or not the activity interacts with the environmental factor; in the case of an interaction, the impact type should be classified (positive or negative).
Table 2. Impact identification matrix (Conesa Citation2010).
The result of this step is the identification of environmental impacts. For example, shows how activity A1 interacts with environmental factor F1, leading to environmental impact I1. Similarly, it can be interpreted that activity A2 interacts with factor F2, leading to environmental impact I2.
Once all the environmental impacts have been identified by finding out all elements in , a list of impacts should be elaborated, eliminating those that are duplicated, and assigning them a code, for example I1, I2, In.
ii) Elaboration of the adjacency matrix. The adjacency matrix is obtained after all the potential environmental impacts have been identified. This is a squared matrix where impacts are located (Boccaletti et al. Citation2006). The adjacency matrix analyses the causal relationships between all elements, unlike the matrices used by conventional methodologies (Leopold et al. Citation1971; Conesa Citation2010), that only focus on the simple relationships between activities and impacts (see ).
Table 3. Adjacency matrix (own elaboration).
It is important to note that the adjacency matrix must be developed by an interdisciplinary professional team. In addition, the community affected should be involved in this process (Funtowicz and De Marchi Citation2000).
To obtain the adjacency matrix, the codes assigned to the activities and impacts are entered in the columns and rows. Subsequently, in each of the cells, it is established whether there is a direct causal relationship between the elements of the columns and the rows. A direct causal relationship is 1 when the impact is totally attributable to the cause, without an intermediate circumstance intervening. If there is a causal relationship, then 1 must be entered, whereas 0 is to be entered if there is no causal relationship. The relationship of an element to itself is 0.
This matrix will be useful later for the construction of a chart that illustrates with lines the causal relationships between the activities and the impacts, while the significance of the relationships is represented through the size and colours of the nodes.
iii) Impact assessment. Once the adjacency matrix is completed, the relationships between the activities and the impacts are analysed in order to rank them according to their Potential Impact (PI). The PI represents the capacity of an impact to generate other types of impacts and depends on the number of additional elements that can impact the effect within the network. With this approach, an impact can be the cause of higher order impacts and not only a consequence of human activity, as considered in conventional methodologies.
To calculate the PI, all rows and columns of the adjacency matrix should be added. The total of the rows is called the out-degree and represents the frequency to which the activity or the impact is the cause of other impacts, whereas the total of the columns is called the in-degree and corresponds to the frequency to which the activity or impact is a consequence of other activity or impacts. The PI of each impact will be the result of adding its in-degree and out-degree, for example its total degree.
This approach allows determining the significance of the impacts according to causality relationships in order to prioritise management measures, so it can be complementary to other methods, such as modelling (i.e. dispersion of pollutants in water and air) or the spatial analysis with Geographic Information Systems (GIS).
In order to establish a scale that allows comparing the results obtained from both the proposed and the conventional methodologies, we suggest the definition of four categories of impact significance, as explained below:
(a) Calculation of the PI range: The PI range is calculated according to Equation (2)
Where RPI is the PI range, Dmax is the maximum total degree, and Dmim is the minimum total degree.
(b) Calculation of amplitude for the categories: The range divided by four will indicate the amplitude of the categories of environmental impact Equation (3)
Where Ac is the amplitude of the category.
(c) Definition of the categories of environmental impact: The criteria defined in must be employed to determine the segments.
Table 4. Criteria for the definition of impact categories.
(d) Categorisation of impacts: The environmental impacts located in the first segment will be assigned the category of irrelevant, those located in the second will be moderate, those in the third will be considered severe, and the critical will be those in the last segment. In cases where a result is within the limit value of two segments, it is suggested to assign the category of highest significance to that impact.
Therefore, environmental impacts with fewer causal relationships belong to the less complex categories (irrelevant, moderate), while those with the highest number of relationships are located in the most complex categories (severe and critical). This interpretation is based on the assumption that the complexity of an impact increases in proportion with the number of relationships it establishes; however, it is possible that an impact has a high significance even when it has a low number of relationships. Therefore, it is recommended to use this methodology as a complement to other methods, such as spatial analysis and modelling of environmental parameters.
(e) Graphical representation of impacts. This methodology generates a graphic result that allows to differentiate project activities and environmental impacts from two perspectives: (i) the relationship ‛to be a cause’ and (ii) the relationship ‛to be a consequence’. This serves the purpose of formulating corrective measures focusing on the activities that are causes of impacts.
A specific software for the elaboration of networksFootnote2 can be used to elaborate the diagram that represents the interactions between the activities and the environmental impacts.
5. Application
The application illustrates the network approach and gives way for a discussion of its scope and limitations. In this example the methodology prioritizes the environmental impacts by determining the degree that characterizes the number of relationships that an element or node has with the whole network, from the perspectives of ‛being cause’ and ‛being a consequence’.
5.1 Project information
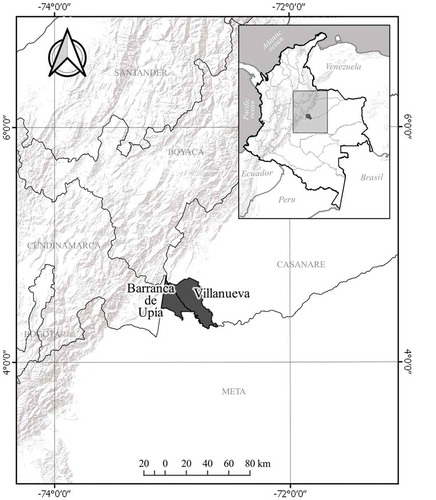
The proposed methodology was applied to a real project of hydrocarbon exploration located in the Casanare and Meta Provinces in Colombia (). This example was selected because the hydrocarbon sector is the main contributor to the Gross Domestic Product and it is also developed in areas of high ecological importance.
Figure 3. Location of the project.
The project had the following general stages:
Adequacy and construction of roads and platforms
Drilling
Production and transportation tests
Dismantling and abandonment
The adequacy of roads included the paths for the access of equipment and staff to the facilities. For the drilling the project used equipment with a range of 5.000 ft and tests of 1, 6 and 12 months (Petrominerales Colombia Ltda Citation2012). Once the production potentiality was evaluated, the fluids were managed in flow lines and the production was concentrated in some sectors for its treatment and transportation. The flow lines are main trunk lines (4–13 in width) installed in the surface. Detailed activities and the assigned codes are presented in .
Table 5. Project activities.
5.2 Identified environmental impacts
The analysed environmental impacts were obtained from the EIS approved by the environmental authority ().
Table 6. Environmental impacts of the project.
5.3 Results
5.3.1 Analysis of impact significance by in-degree
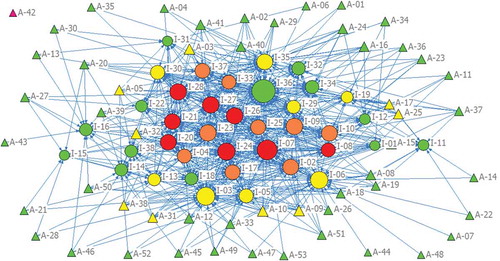
The application of the in-degree analysis allowed to establish the significance of the 38 identified impacts, 8 under the category of irrelevant (green), 25 moderate (yellow), 4 severe (orange) and 1 critical (red) ().
Figure 4. In-degree analysis result.
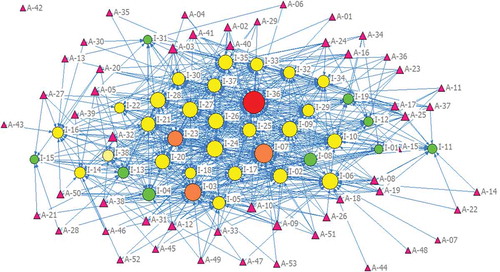
shows how the activities are related to the impacts, and how the impacts are related between them. The nodes with smaller number of relationships are located in the periphery, whereas the nodes with a higher number of relationships are located in the interior. The size of the nodes reflects the total degree of the element, while the colour represents the potential importance. The activities are shown in pink and represented by a triangle, as they do not have an in-degree, for example they are not a consequence of another element.
5.3.2 Analysis of the impact significance by out-degree
Regarding the out-degree, the activities with greater importance are the adaptations of access roads, the disposal of treated wastewater, the construction of geotechnical and environmental works, the removal of vegetation cover, the recruitment of personnel, goods and services, the land movement, and the opening and conformation of rights of pass.
On the other hand, the impacts with greater relevance -because they act as agents that cause other impacts- are the changes in land uses, surface drainage patterns, socioeconomic infrastructures, the supply/demand of goods and services, land tenure, the economic activities, population dynamics, and population relocations. These impacts should be managed through measures that allow their elimination (preventive) or the reduction of their effects (corrective and mitigating measures), since they reinforce the occurrence of other impacts. The network diagram resulting is presented in .
Figure 5. Out-degree analysis result.
As shown in , the elements with greater weight are concentrated in the centre and arranged from the point of view of causality, giving the observer the possibility of understanding the magnitude of each element as an agent that modifies the environment.
A relevant result of this analysis is precisely that it allows an independent assessment of the relationships ‘being cause of’ (in-degree) and ‘being consequence of’ (out-degree). In this sense, the evaluator is able to notice that impacts are not only a consequence, but they may also be potentially harmful when they cause other subsequent impacts. In this case, the preventive measures should be focused on those impacts that are significant from the perspective ‘being cause of’. On the other hand, the impacts presenting a high in-degree are a consequence of multiple causes and in turn, they are harder to prevent.
5.3.3 Comparison with qualitative methodology
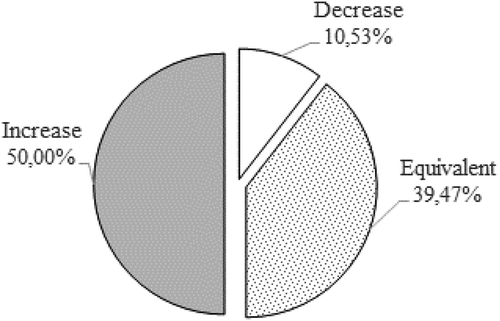
When applying the methodology of network analysis, 39.47% of the impacts remained in the same category, while 50% were included in a higher category, and 10.53% were placed in a category of lower significance. This implies that the EIA based on network analysis is useful to evaluate impacts of greater significance without using qualitative attributes. shows how by using this methodology the percentages of irrelevant and moderate impacts are reduced and the severe and critical impacts increase.
Figure 6. Comparative results.
5.3.4 Advantages and limitations of the EIA methodology based on network analysis
The advantages of the network analysis methodology are the following:
It does not require the qualification of attributes to determine the importance of the impacts, which may contribute to reduce the evaluator’s subjectivity and the possibility of overestimating or underestimating the importance by modifying the categories of attributes. The analysis is focused on the determination of the causality relationships between activities and impacts and not on the qualification of attributes, as proposed by Leopold et al. (Citation1971) and Conesa (Citation2010). Therefore, the evaluator makes decisions based on a more robust set of information regarding the interactions between PWAs and environment, and may attenuate the sources of uncertainty (Lohani et al. Citation1997), so the final result of the evaluation can be more pertinent.
It does not use a fixed range for the definition of impacts (critical, severe, moderate, compatible or irrelevant), but provides a relative importance index that can be interpreted according to the results obtained in each project. The results in terms of the ‘degree’ depend on the number of elements constituting the network, so it is not possible to establish a fixed range of relationships that determine if an impact is significant or not. For example, an impact with a total degree of 20 can be very significant if the network is composed of 50 nodes, but less significant if the network has 500 nodes. This situation is overcome by the definition of the impacts’ categories according to the range obtained for the ‘total degree’ measure. Thus, the impacts can be categorised in the same scales regardless of the number of elements constituting the network.
By relying on the identification of direct causal relationships, it can easily discern whether the relationships do exist or not. This advantage is related to the fact that the relationship between several environmental parameters has been technically documented; for example, the increase in organic matter in the water may lead to the decrease in the dissolved oxygen or to the increase of biological oxygen demand. Defining these causal relationships is less complex in comparison to the qualitative methodologies, in which each attribute has a wide range of options (e.g. the ‘moment’ attribute can be assessed as immediate, short term or long term).
It facilitates the identification of the significant impacts by gathering all the components (activities and/or impacts) of the project in a single graph. This reduces the time required for the analysis of the evaluation results and makes it easier for the environmental authority to make the decisions related to the environmental viability of the project, because the methodology identifies the most significant environmental impacts and their associated activities. This can be positive for the follow-up and control stages because it is possible to prioritize the impacts or elements of the environment that need more attention.
The graphical analysis allows for a higher understanding of the causal relationships of impacts in an extensive way (secondary, tertiary impacts, etc.), pointing out relationships among the components that are not easily detectable through the use of matrices. This graphical analysis can be used for designing preventive measures for the impacts presenting the highest numbers of causality relationships, which would increase the efficiency of the corrective measures.
However, the network methodology presents the following limitations:
The results of the analysis can be manipulated by the omission of causal relationships. The ‘degree’ measure is directly related to the number of relationships that the node establishes with the rest of the network, so omitting a causal relationship leads to lowering its degree, and therefore, the significance of the impact.
It is possible that relevant impacts are not considered significant because they present fewer relationships, or that other impacts are categorised as significant due to a higher number of relationships, even when they do not cause any substantial change in the environment.
The evaluators need to be trained in the methodology, its theoretical framework and the use of software. Although all the EIA methodologies require training, the use of additional computer programs may represent higher costs in terms of time and money.
The evaluations have to be carried out by professionals from different areas, as well as by people belonging to the areas of influence of the project, so that the possible causal relationships are established. This is an important element of this methodology, because the interaction between professionals from several academic backgrounds is required to identify the possible causality relationships between the environmental impacts, since these can be related to several disciplines. An example of this is the relationship between the alteration of air quality due to PM10 and the human health (ERD).
These limitations represent an opportunity to continue researching the applications of complex systems modelling based on network analysis and its application in environmental impact assessment, although the exploration of other instruments that may overcome these limitations would also be necessary.
6. Conclusions
The incorporation of elements of the theory of complex systems and the use of modelling tools may contribute to reduce uncertainty and limit subjectivity in EIS, complementing the systemic analysis with the recognition of the complex relationships between the components of a project (activities, factors and environmental impacts).
Some of the uncertainty factors presented in the process of environmental impact assessment can be avoided by using the EIA methodology based on network analysis, since it is grounded on the determination of causal relationships without using attribute ratings, numerical labels or static interpretation ranges. This overcomes the cause-effect analysis of activities and environmental factors of the qualitative methodologies.
By defining the categorisation ranks of the impacts based on the range amplitude of the results obtained for the total-degree, the EIA based on network analysis allows researchers to identify the relevant impacts and compare them with the results obtained from other conventional methodologies, such as those proposed by Leopold and Conesa.
On the other hand, the use of the in-degree and out-degree facilitates the identification of significant impacts by determining if they are cause or consequence, thus allowing to address the elimination of the impacts’ causes (through preventive actions) or their mitigation (through corrective or mitigation actions) in the EMP.
Disclosure statement
No potential conflict of interest was reported by the authors.
Additional information
Funding
Notes
2. In this paper we employ the Ucinet® program designed by Borgatti et al. (Citation2002, https://sites.google.com/site/ucinetsoftware/home). However, the following options are also useful: Gephi (https://gephi.org/), Graph-tool (https://graph-tool.skewed.de/), Grapviz (http://graphviz.org/), JUNG (http://jung.sourceforge.net/), SocNetV (http://socnetv.org/), polinode (https://www.polinode.com/), NodeXL (https://archive.codeplex.com/?p=nodexl), among others.
References
- Arts J, Runhaar H, Fischer T, Jha-Thakur U, Van LF, Driessen P, Onyango V. 2012. The effectiveness of EIA as an instrument for environmental governance. J Environ Assess Policy Manag. 14:1–40.
- Barabási A. 2012. Network science: luck or reason. Nature. 489:507–508.
- Boccaletti S, Latora V, Moreno Y, Chavez M, Hwang D. 2006. Complex networks: structure and dynamics. Phys Rep. 424:175–308.
- Bojórquez-Tapia L, García O. 1998. An approach for evaluating EIAs-deficiencies of EIA in Mexico. Environ Impact Asses Rev. 18:217–240.
- Bond A. 2015. What is the role of impact assessment in the long term? J Environ Assess Policy Manag. 17:1250025-(1–6).
- Borgatti S, Everett M, Freeman L. 2002. Ucinet for windows: software for social network analysis. Harvard (MA): Analytic Technologies.
- Canter L, Sadler B 1997. A tool kit for effective EIA practice: review of methods and perspectives on their application. IAIA. Norman, OK (USA).
- Cárdenas J. 2016. Network analysis: definition, origins, growth and future. Pensando Psicología. 12:5–10. Available https://revistas.ucc.edu.co/index.php/pe/article/view/1330/1469.
- Ch ST, Zhao L. 2016. Machine learning in complex networks. New York (Dordrecht, London): Springer.
- Chivat I. 2016. Coping with uncertainty in environmental impact assessments. Open Criteria and Techniques. Environ Impact Assess Rev. 60:24–39.
- Conesa V. 2010. Methodological guide for environmental impact assessment. Madrid: Mundi-Prensa.
- Connelly R. 2011. Canadian and international EIA frameworks as they apply to cumulative effects. Environ Impact Asses Rev. 31:453–456.
- De Jongh P. 1988. Uncertainty in EIA. In: Wathern P, editor. Environmental impact assessment theory and practice. 1st ed. London: Routledge; p. 62–84.
- Dee N, Baker J, Drobny N, Duke K, Fahringer D, Whitman I. 1973. An environmental evaluation system for water resource planning. Water Res. 9:523–535.
- Drayson K, Wood G, Thompson S. 2017. An evaluation of ecological impact assessment procedural effectiveness over time. Environ Sci Policy. 70:54–66.
- Franks M, Brereton D, Moran C. 2013. The cumulative dimensions of impact in resource regions. Resour Policy. 38:640–647.
- Funtowicz S, De Marchi B. 2000. Post-normal science, reflective complexity and sustainability. In: Leff E, Funtowicz S, editors. The environmental complexity. Spanish. Buenos Aires: Siglo XXI; p. 54–85.
- Geetha K, Sekar P. 2016. Graph theory matrix approach - A review. Indian J Sci Technol. 9:1–4.
- Glasson J, Therivel R, Chadwik A. 2012. Introduction to environmental impact assessment, built environment, environment and sustainability. London: Routledge.
- Gómez Orea D. 2013. Environmental impact assessment: a preventive instrument for environmental management. Madrid: Ediciones Mundi-Prensa.
- Institute of Medicine. 2013. Environmental decisions in the face of uncertainty. Washington (DC): The National Academies Press.
- International Organization for Standardization. 1993. ISO 3534–1 statistics-vocabulary and symbols, part 1. Probability and general statistical terms. Geneva, Switzerland.
- Jha-Thakur U, Fischer T. 2016. 25 years of the UK EIA system: strengths, weaknesses, opportunities and threats. Environ Impact Assess Rev. 61:19–26.
- Jones R, Fischer T. 2016. EIA follow-up in the UK-A 2015 update. J Environ Assess Policy Manag. 18:1–22.
- Kamal A, Burkell J. 2011. Uncertainty: when Information is Not Enough. Can J Inf Libr Sci. 4:384–396.
- Lawrence D. 2007. Impact significance determination -back to basics. Environ Impact Asses Rev. 27:755–769.
- Leopold L, Clarke F, Hanshaw B, Balsley J. 1971. A procedure for evaluating environmental impact. Washington DC: Geological Survey, United States Department of the Interior, circular 645.
- Leung W, Noble B, Gunn J, Jaeger J. 2015. A review of uncertainty research in impact assessment. Environ Impact Assess Rev. 50:116–123.
- Leung W, Noble JJAG, Gunn JAE. 2016. Disparate perceptions about uncertainty consideration and disclosure practices in environmental assessment and opportunities for improvement. Environ Impact Assess Rev. 57:89–100.
- Liu H, Hu X-B, Yang S, Zhang K, Di Paolo E. 2011. Application of complex network theory and genetic algorithm in airline route networks. Transp Res Rec. 2214:50–58.
- Lohani B, Evans J, Everitt R, Ludwig H, Carpenter R, Tu S. 1997. Environmental impact assessment for developing countries in Asia. Mandaluyong: Asian Development Bank.
- Loomis JJ, Dziedzic M. 2018. Evaluating EIA systems´ effectiveness: A state of the art. Environ Impact Assess Rev. 68:29–37.
- Morgan R. 2012. Environmental impact assessment: the state of the art. Impact Assess Proj Apprais. 30:5–14.
- Morris P, Therivel R.2009.Methods of environmental impact assessment.3rd ed. Peter M, Rik T,editors. London: Routledge.
- Munguía-Rosas M, Montiel S. 2013. Ecology and social sciences: complex networks in human ecology humana. Ecol Austral. 23:135–142.
- Okpara U, Stringer L, Akhtar-Schuster M, Metternicht G, Dallimer M, Requier-Desjardins M. 2018. A social-ecological systems approach is necessary to achieve land degradation neutrality. Environ Sci Policy. 89:59–66.
- Pan W, Li B, Ma Y, Liu J. 2011. Multi-granularity evolution analysis of software using complex network theory. J Syst Sci Complex. 24:1068–1082.
- Papo D, Buldu JM, Boccaletti S, Bullmore ET. 2014. Complex network theory and the brain. Philos Trans R Soc B Biol Sci. 369:20130520.
- Pastakia CMR, Jensen A. 1998. The rapid impact assessment matrix for EIA. Environ Impact Assess Rev. 18:461–482.
- Pavlickova K, Vyskupova M. 2015. A method proposal for cumulative environmental impact assessment based on the landscape vulnerability evaluation. Environ Impact Assess Rev. 50:74–84.
- Perdicoúlis A. 2010. Systems thinking and decision making in urban and environmental planning. Cheltenham (UK): Edward Elgar Publishing.
- Perdicoúlis A, Glasson J. 2006. Causal networks in EIA. Environ Impact Assess Rev. 26:553–569.
- Petrominerales Colombia Ltda. 2012. Perforación exploratoria de hidrocarburos “área de interés llanos 31. Expediente 4751. Disponible en. [accessed 2018 Oct 15]. http://vital.anla.gov.co
- Pezzulo G, Butz M, Castelfranchi C, Falcone R. 2008. The challenge of anticipation. Berlin: Springer Berlin Heidelberg.
- Ren Z, Zeng A, Zhang Y. 2018. Structure-oriented prediction in complex networks. Phys Rep. 750:1–51.
- Sadler B. 1996. Environmental assessment in a changing world: evaluating practice to improve performance. Hull (Quebec): Minister of Supply and Services Canada, CEAA, IAIA.
- Suyono RS, Tamin OZ, Wibowo SS, Heru Purboyo HP. 2016. Application of modified rapid impact assessment matrix (RIAM) for multi actor-sustainability appraisal of public transport. Int J Appl Eng Res. 11:1960–1973.
- Tagliani P, Walter T. 2018. How to assess the significance of environmental impacts. WIT Trans Ecol Environ. 215:47–55.
- Teigland J 2000. Impact assessments as policy and learning instrument. Why effect predictions fail, and how relevance and reliability can be improved. [ dissertation]. Roskilde: Roskilde University.
- Tennoy A, Kværner J, Gjerstad KI. 2006. Uncertainty in environmental impact assessment predictions: the need for better communication and more transparency. Impact Assess Proj Apprais. 24:45–56.
- Therivel R, Wood G. ed. 2018. Methods of environmental and social impact assessment. 4th Ed. New York: Routledge.
- Toro J, Requena I, Duarte O, Zamorano M. 2013. A qualitative method proposal to improve environmental impact assessment. Environ Impact Assess Rev. 43:9–20.
- U.S. Environmental Protection Agency. 1999. Consideration of cumulative impacts in EPA review of NEPA documents. Office of Federal Activities. Washington, USA.
- Wang N, Li D, Wang Q. 2012. Visibility graph analysis on quarterly macroeconomic series of China based on complex network theory. Phys A Stat Mech Its Appl. 391:6543–6555.
- Wilkins H. 2003. The need for subjectivity in EIA: discourse as a tool for sustainable development. Environ Impact Assess Rev. 23:401–414.
- Wood C. 2003. Environmental impact assessment: a comparative review. 2nd ed. Harlow: Prentice Hall.
- Ya-Juan D, Yun-Feng Y, Rong-Guo M. 2010. Highway network structure characteristics based on complex network theory. China J Highw Transp. 23:98–104.
- Zhang J, Kørnøv L, Christensen P. 2018. The discretionary power of the environmental assessment practitioner. Environ Impact Assess Rev. 72:25–32.
- Zhao J, Yu H, Luo J, Cao ZW, Li Y. 2006. Complex networks theory for analyzing metabolic networks. Chinese Sci Bull. 51:1529–1537.