
ABSTRACT
This work presents environmental indicators, based on the pressure-state-response (PSR) model, for the environmental licensing activity of offshore oil and gas production in Brazil. The objective is to consider the feasibility of a set of indicators, supported by existing data, as well as necessary requirements and limitations related to their use. Environmental licensing processes were researched for information from 2012 to 2019 associated with this type of indicators. Due to data limitation, a focus was established on two contiguous areas that concentrate about half of the oil platforms that operate in Brazil and three key indicators: total oil discharge on produced water (pressure); percentage of monitored platforms with significant ecotoxicity in water samples (state); and number of inspections made (response). The indicators show related trends despite some inconsistencies and the challenge of establishing clear causal nexus in this area. Overall, the outcomes show that developing indicators for this system is possible and desirable, but depends on a structured, planned and long-term effort. Moreover, it would be facilitated by robust databases and standardized reporting protocols.
Environmental indicators are increasingly considered a fundamental tool in the pursuit of sustainable development (Da Silva et al. Citation2014), as observed in the context of the Sustainable Development Goals (United Nations Citation2017). Within the spectrum of governance – understood as how decisions are made, problems are tackled and opportunities are created – impact assessment is one of the instruments that seeks to advise decision-makers proactively on the potential advantages and disadvantages of a proposed action (Meuleman Citation2015). The creative function of impact assessment practice involves the formulation of innovative alternatives that are both efficient in terms of means and effective in terms of ends (Hayes Citation2017), and, therefore, might welcome the use of environmental indicators.
Environmental impact assessment (EIA) is a key policy implementation instrument (Ciliers et al. Citation2020) often linked to control legislation which requires its routine use for proposed projects that might have significant environmental impacts (Morgan Citation2012). EIA development has brought new techniques and methodologies, including advances in screening, scoping, impact assessment, monitoring and other aspects of follow-up. Attempts have been made to use environmental indicators in this area, encompassing the design and evaluation of environmental monitoring programs (Ramos et al. Citation2004), cumulative impact assessments (Neri et al. Citation2016) and strategic environmental assessments (Da Silva et al. Citation2014; Kazak et al. Citation2017), but there still is much room for improvements (Gao et al. Citation2013).
This paper explores the development of environmental indicators for the environmental licensing of offshore oil and gas undertakings in Brazil, a process legally linked to EIA practice and regular follow-up efforts. Thus, a case study is used, based on the author’s experience as an analyst in the Brazilian federal EIA office, where he worked from 2013 to 2020, as well as documentation analysis and literature review.
In particular, the aim is to consider the challenges of developing a set of indicators, supported by existing data, as well as necessary requirements and limitations related to their use. The research is based on administrative processes associated with environmental permits issued by the Oil and Gas Production Coordination (COPROD), a unit of the Environmental Licensing Directory of the Brazilian Institute of Environment and Natural Renewable Resources (IBAMA).
Background
This section introduces the Brazilian environmental licensing process, the offshore oil and gas sector and its EIA system, and a brief review of environmental indicators and the Pressure-State-Response framework.
Brazilian environmental licensing process
Following is a brief introduction to the Brazilian environmental licensing process and the role of EIA and Environmental Impact Studies (EIS) in its development:
EIA is required for any project with a potential to ‘cause significant environmental degradation’ and its approval is a condition for issuance of an environmental license. The process is divided into three phases (three-phase licensing): (1) previous license, granted after approval of an EIS; (2) implementation license, after approval of an environmental management plan detailing mitigation, and complying with any conditions resulting from the previous license; (3) operation license, issued when all conditions are complied with. Environmental agencies usually require a brief project descriptive document, and proceed with scoping formulating Terms of Reference (ToR) for the EIS. The EIS is developed by the proponent, which nearly always contract consultancy firms. After public hearings, environmental agencies proceed with the review and a final technical note (review report) is issued. In case of approval, this report usually defines the environmental acceptability of the proposal and establishes terms and conditions for project implementation. (Duarte et al. Citation2017, p.294).
Thus, the Brazilian project-EIA practice is embedded in the environmental licensing process, with the previous license assessing the viability of the proposal, the installation license authorizing the construction or commissioning of the facility and, lastly, the operation license which will have to be kept valid throughout the life of the project (Vilardo and La Rovere Citation2018). It is worth mentioning that this is the standard for large undertakings; nonetheless, there are a plethora of other procedures and authorizations, including streamlined licensing based on simplified environmental studies, for various economic activities.
The environmental licensing process, despite constituting one of the main instruments of the national environmental policy, is subject to a series of shortcomings. Naime (Citation2017), based on interviews with professionals experienced in the routines of the Brazilian environmental licensing process, especially those related to the environmental licensing of oil and gas transmission pipelines, indicates some challenges in this area:
Generalized structural and organizational deficit in the environmental agencies;
Low quality of environmental and risk assessments;
The Ministry of Environment and the environmental agencies rarely contribute to the strategic planning of the country;
The licensing process is often perceived as a ‘legitimization mechanism’ to validate projects and initiatives, which also makes the regulatory process a place for bargains and compensations;
The regulatory environment hampers the implementation of good governance practices in EIA, due to a diversity of interests, political and economic influence of some groups, and the often uneasy relationship between governmental institutions and other stakeholders.
As in other contexts, it also suffers from poor process management and could benefit from practices that capture lessons learned, promote better information sharing among staff and stakeholders and increase inputs for guiding, monitoring, and reviewing the scoping process (Borioni et al. Citation2017).
Brazilian offshore oil and gas EIA`s system
Despite the existence of regulations linking strategic environmental assessments with the bidding rounds of areas for oil exploration (Brazil Citation2012), this practice has not been implemented to the point of influencing offers related to any sedimentary basin. This lack of a basin-wide management contrasts with strict environmental regulations on the industry on a project level (Almada and Bernardino 2017).
Offshore oil and gas projects are licensed at the federal level, by IBAMA. The process usually involves a single development, normally one platform and the associated underwater equipment (lines, wells, pipes, pumps, valves, etc.) (Vilardo and La Rovere Citation2018). As in other countries, environmental management strategies, including those to avoid and minimize the environmental impacts of projects, are set during the EIA process and may become conditions of operation (Cordes et al. Citation2016).
Follow-up – which encompasses monitoring, evaluation and management of a project or plan – is recognized as a highly deficient area in EIA practice, but the Brazilian offshore oil and gas EIA system has been regarded positively for having structured procedures and considerable effort in post-decision follow-up (Vilardo and La Rovere Citation2018). This may be illustrated by the existence of several technical directives, such as Technical Directive CGPEG/DILIC/IBAMA nº03/13 (IBAMA Citation2013), which establishes requirements and standards for emergency response plans submitted in the permitting process in the light of follow-up evidence.
The unit responsible for offshore oil and gas licensing processes (COPROD) has a number of interesting features, such as working groups where technical issues are discussed internally and the use of a regional approach, which enables the integration of environmental management programmes required for projects approval, with an evident reflex on the consideration of cumulative impacts (Cruz et al. Citation2018). The use of regional management programs enables a better assessment and treatment of impacts of several projects, integrating in a same evaluation-related pressures. At the same time, working groups provide a setting to share common challenges and reflect on issues of effectiveness. Nonetheless, Bredariol and d’Avignon (Citation2018) indicated more progress can be made in this unit through the use of improved management systems, indicators and other mechanisms of transparency and accountability.
Environmental indicators and the pressure-state-response (PSR) framework
The search for sustainable development presupposes proactivity, long-term vision, society participation and monitoring of results. In this context, environmental indicators constitute a navigation chart capable of pointing the current situation as well as possible trends, enabling the correction of ongoing activities (Da Silva et al. Citation2014). At the same time, public administrations face increasing amounts of data in EIS and, thus, need to strengthen their capacities to store, retrieve and process information, ensuring learning and knowledge creation (Fonseca and Fernández Citation2020).
The most well-known indicator frameworks in use for sustainability assessments are based on the Pressure-State-Response (PSR) framework developed by the OECD (Laedre et al. Citation2015). There are different varieties of this model, such as Driving Force-Pressure-State-Impact-Response (DPSIR) (Dong and Hauschild Citation2017) or the Pressure-State-Impact-Response (PSIR) ((Niemeijer and Groot Citation2008; Kemerich et al. Citation2014), but all include indicators regarding: activities that create environmental pressures (e.g. discharging wastes); the state of the environment which may be altered by these activities (e.g. concentration of pollutants in the water); and triggered responses from the society (e.g. new policies or corrective actions). This framework has been used in a variety of settings to provide a structured understanding and to inform the management of resources such as fisheries, watersheds and forests, coastal areas, among others (Neri et al. Citation2016). As stated by Ou and Liu (Citation2010), pressure, state and response indicators are linked in several ways and provide only a tool for evaluation and monitoring purposes, requiring further qualitative and quantitative analysis to avoid misinterpretation.
Most indicator frameworks were not developed with the purposes of EIA application, more so for the post-decision phase (Ramos et al. Citation2004). Nevertheless, the use of indicators could constitute a good practice in environmental assessments and related governance systems. It is important that knowledge gained from monitoring and enforcement activities is recorded and transmitted to future assessments (Joseph et al. Citation2015), a function that could be supported by a set of environmental indicators. Furthermore, the literature recognizes learning as an intrinsic but complex feature of EIA systems and a core element of EIA effectiveness (Cruz et al. Citation2018). Better managing information created within the EIA process can improve its efficacy and, particularly, the assessment of cumulative impacts (Duarte et al. Citation2017). As Stoeglehner (Citation2020) indicated when emphasizing the need for strategic databases of environmental information that cover large areas and topics:
(…) we urgently need a co-evolution of the planning system and the accompanying environmental assessments in order to fill the gaps in strategic planning and strategic environmental assessment, to address environmental issues at the level of system alternatives and to allow for double loop learning in integrated strategic planning and assessment processes. (Stoeglehner Citation2020, p. 1)
The design of environmental indicators might constitute a useful tool in supporting these tasks. In the light of the many ways in which an indicator framework can be conceptualized, a challenge rests in selecting which elements and aspects should be taken into account. Due to the nature of most stressor–response relationships, it is impossible to characterize completely all pertinent variables, so indicators should reflect critical components and consider the difficulty in assessing whether observed environmental changes are caused by specific projects or activities or whether other factors may have intervened (Ramos et al. Citation2004).
In this sense, indicator sets should also be reviewed in the light of effectiveness concerns. Cashmore et al. (Citation2009) suggest that the notion of effectiveness as some sort of absolute measure is untenable and that the concept is better conceptualized as a learning paradigm. They further emphasize the importance of reflecting on the ‘big picture’ in effectiveness (i.e. not only procedures and practices, but also institutional capacity, norms and culture). Environmental indicators can assist on many of these fronts, enabling transparency and accountability as well as providing learning opportunities. EIA´s effectiveness can be improved through commitment to methodological innovation (Cashmore et al. Citation2004), one development opportunity rests in proper environmental indicators frameworks.
Methodology
Considering the data available for the oil and gas sector, including periods covered and information consistency, this work uses the PSR framework with a focus on indicators of: pressure from licensed activities; the state of the marine environment; and responses from IBAMA’s licensing unit. However, a few broader indicators related to the topic were also presented to introduce the context of the studied activity in Brazil, such as offshore oil production and frequency of oil spills.
With the exception of these contextual indicators, all the information compiled was retrieved from COPROD’s internal records or environmental licensing processes. A significant portion of it was presented in reports from oil and gas developers, which often hire consulting companies to conduct environmental projects, and may have resulted in partiality in the related technical assessments. There are risks and limitations of the knowledge generation embedded in EIA processes, such as the potential bias that industry funding can impose over studies through various means (e.g. censorship, direct pressure, or due to the potential of obtaining future contracts with the same contractor) (Vilardo and Barbosa Citation2018). Nonetheless, IBAMA does follow up authorized undertakings, conducting on-site inspections and review of reports presented. Non-compliance may result in fines or the suspension of the associated environmental permit. Fines are rather common, in 2019 approximately 100 technical notes (review reports) were sent from COPROD to the unit responsible for issuing fines. Suspension of licenses, on the other hand, occur only in extreme cases, such as in the oil spill that occurred in the Frade field in 2011 due to an underground blowout.
The research effort, including data selection and compilation, started in 2017. Since some reports and information sources regarding 2016 were not yet available and 2012 marked the completion of a major environmental monitoring program’s first campaign, a first step comprised the review of information with respect to the 2012–2015 interval. The intent was that this initial work would serve as a pilot study and support further development comprising a set of indicators covering a broader timeframe.
Participant observation was a relevant resource method at this stage, enabling the identification of available sources of data and its characteristics (e.g. methods used to collect information, temporal range, number of production platforms involved). This qualitative research method is traditionally used in anthropological and sociological studies, being defined by the systematic observation and participation in events and activities in a chosen setting (Kawulich Citation2005). Thus, it enables a holistic understanding of the phenomena under study and may increase research validity when supported by additional strategies, such as interviewing and document analysis. Moreover, participant observation is an interesting technique for exploratory research, providing access to sources of information that cannot otherwise be accessed (Ashworth Citation1995). From the 2012 to 2015 period, several potential indicators were considered and two were selected for each part of the model. This assessment was based on the verification of data available on permitting processes, consultation with environmental analysts which worked closely with the related topic (e.g. water quality monitoring, inspections, fauna management) and examination of internal records. Viable indicators were selected considering the comprehensiveness of the available information and the group of criteria used by Neri et al. (Citation2016):
Relevance with respect to applicable environmental standards;
Relevance to the kind of projects under review;
Easiness of collection and updating;
Reasonable cost of collection and analysis;
Easiness of public understanding;
Solid scientific foundation, acknowledged collection methods, reproducibility.
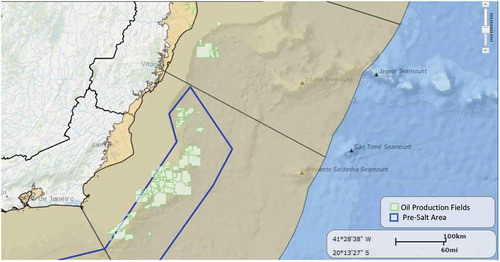
In view of the absence of a structured database, a significant portion of data was compiled from different sources and may include minor aggregation errors. Copying several sets of numbers from PDF files and performing sequential mathematical operations entails risks of typing mistakes. All in all, over 1000 files were consulted – including reports from entrepreneurs, documents issued by IBAMA, datasheets with environmental monitoring information, among others – and the compilation of available information stemmed from dozens of different environmental permitting processes. Initially, all offshore oil and gas production undertakings were considered, but due to data limitation, a further focus was established on two contiguous areas that concentrate 64 of the 144 oil platforms that operate in Brazil (ANP, Citation2018b) – the Campos Basin and the Espirito Santo Basin – shown in . From these platforms, 25 are Floating Production Storage and Offloading (FPSOs) Units, capable of producing large amounts of oil (e.g. FPSO City of Campos dos Goytacazes, a recent unit installed in the Campos Basin, can produce up to 150 thousand barrels of oil per day), of the 41 total in Brazil (ANP, Citation2018b). The Campos Basin is also a mature production area, having produced oil since the 70s (ANP Citation2016). These areas were selected because they had results from consolidated and large-scale environmental monitoring projects for the whole studied interval and represented a significant portion of the offshore oil and gas activity in Brazil.
Figure 1. Oil and Gas Production Fields in Campos Basin and Espírito Santo Basin (Source: ANP, Citation2018a).
Based on this first set of indicators and considering the intent of linking related pressure, state and response information, one indicator of each type was selected and further refined. This second step comprehended the review of data available from 2012 to 2019. Since reports are generally delivered on a yearly basis, this meant that the associated results cover the period of 2012 to 2018. A few adjustments were made to cover gaps in data sequences or relevant changes in monitoring methodology. These procedures covered a small amount of data and are described in the results section. They are also highlighted in the published dataset.
Result interpretation was supported by literature review (peer-reviewed and grey literature), content analysis and participant observation. Along with the problems relating to proof, generalizability, and time commitments, bias is a disadvantage of participant observation, since the understanding of a particular scene may be systematically biased by the researcher’s personal background and set of experiences (Fine Citation2015). Thus, in order to minimize the potential bias of the participant-observation condition, the analysis benefited not only from the author’s experience with the environmental licensing of oil and gas developments but was also grounded on publicly available information from IBAMA’s processes, literature review and other research sources.
Results and discussion
Environmental permitting of offshore oil and gas production projects generally follows the standard three-step procedure already described, resulting in an operation license with a set of conditions. These are the result of the EIA process, administrative issues and society’s demands. Due to the similarity of undertakings, COPROD has consolidated some standard environmental measures which are applicable to most oil production projects with due customization, such as a Pollution Control Project, an Environmental Education Project and an Environmental Monitoring Project (Bredariol and D`Avignon Citation2018). These result in the consolidation of data related to pressures from the permitted activity and the state of the surrounding environment. Nonetheless, most of this information is not intended to support environmental indicators and often is not collected using the same methodology nor necessarily comprehends every oil and gas facility. lists a set of environmental programs, projects and reports that are commonly required in an operation license accompanied by comments with regard to their potential use as sources of information for indicator sets:
Table 1. Environmental programs, projects and reports commonly required in an operation license.
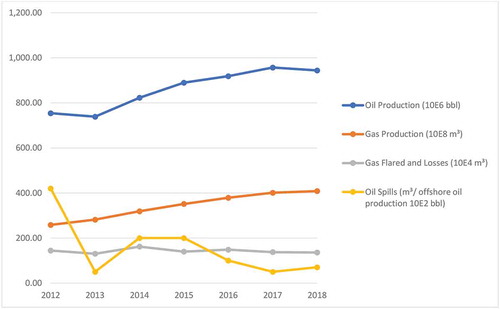
From the total of 10 operation licenses for oil production developments granted in 2019 by IBAMA, the above-mentioned items appear in 70% or more of those, with conditions related to items 2, 3, 5, 6, 7, 10 and 12 being present in all of them. Nonetheless, many of these requirements have only been developed in the last years. Thus, since permits are often valid for more than 4 years, platforms which operate under licenses granted before 2016 frequently only satisfy the first six topics listed. Moreover, there are environmental limits and monitoring requirements defined directly by pertaining legislation, such as the one ruling produced water discharge (Brazil Citation2007). These programs, projects and reports provide a wealth of information that may be used to structure environmental indicators, though standard reporting protocols are not available for all of them. In the present work, results from items 1, 5 and 11 were compiled. Furthermore, the National Oil, Gas and Biofuels Regulatory Agency (ANP) collects data related to oil and gas production, incidents and operational performance which illustrates the context of these activities in the studied years. Graphic 1 shows selected information for offshore oil and gas production in Brazil.
Graphic 1. Selected ANP Indicators for Offshore Oil and Gas Production (Source: Author’s draft, based on ANP Citation2019, Citation2020).
The sets of indicators obtained with data from the environmental licensing processes and specific to the area of interest are presented below according to their PSR classification for the initial period of 2012–2015.
Environmental pressure indicators
Considering pressure indicators, there is a reasonable amount of related information available in environmental permitting processes, ranging from inventories of emitted gases to detailed characteristics of discharged effluents. For this category, two key residues resulting from the oil production activity that fulfils all six criteria referenced by Neri et al. (Citation2016) were chosen. Produced water is the largest waste stream generated in oil and gas industries (Fakhru’l-Razi et al. Citation2009) and is composed of a mixture of different organic and inorganic compounds that are produced by the well together with oil and gas. Generally, produced water is disposed of at sea after treatment. Regarding the waste sent to shore, the largest volume disposed of is composed of oiled residues.
Thus, the information of oil load discharged per year in produced water was compiled for every oil production platform operating in the Campos Basin and Espirito Santo Basin. This data is informed yearly by oil and gas companies following national legislation and standard methodology (Brazil Citation2011).
Graphic 2. Selected Pressure Indicators for Offshore Oil and Gas Production (Source: Author’s draft, based on reports from environmental permitting processes).
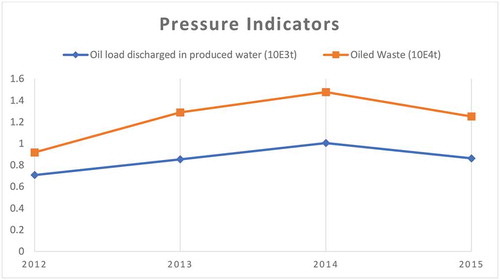
Noteworthy is that both indicators are displayed in tons per year and follow a similar pattern (Pearson ‘s correlation coefficient p = 0.98), increasing steadily until 2014, with a reduction in 2015 leading the totals to the levels registered in 2013. The growth in waste generation and oil load discharged in produced water might be explained by the growth of oil production during this period, though data from the last year are contrary to this hypothesis. The production of oil in the sedimentary basins of Campos and Espirito Santo went from roughly 26 × 106 barrels of oil equivalent (BOE) in 2014 to 29 × 106 BOE in 2015 (ANP Citation2020), an increase of 8.3%, while the oil load discharged in produced water reduced 14.2% and the oiled waste generation decreased by 15.3% in the same period.
Environmental state indicators
Information regarding environmental state is limited, with dispersing efforts related to several monitoring projects required in separate environmental licensing processes. This restriction motivated the selection of Campos and Espirito Santo Basins as focus areas for the present research.
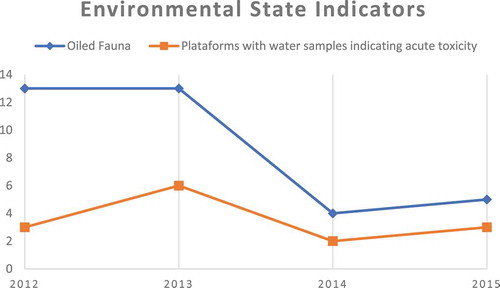
Among the environmental projects with well-established collection methods, the Beach Monitoring Program provides data of stranded fauna found on the coast with further information of possible causes and the presence or absence of oil. Thus, the number of oiled wildlife registered on the coastal region of the Campos and Espirito Santo Basins by this program was chosen as a state indicator, reflecting potential impacts of the offshore oil and gas activity. The data from this program are available online (SIMBA, Citation2020). The distance from oil platforms to the shore varies significantly, from a couple to hundreds of kilometres, and many other sources of pollution could affect the coastal area, such as fishing boats or cargo vessels. Thus, this program foresees oil fingerprint analysis, when conditions allow, in order to identify if the oiled fauna encountered was affected by crude oil and from which production field it originated.
Furthermore, there are several offshore water quality monitoring programs, with yearly campaigns, which provide recurrent measurements obtained through standard methods. On the selected areas, the most comprehensive data from this period were obtained by the Environmental Monitoring Project of Representative Production Platforms in the Campos basin. Among the different variables monitored (e.g. metals, nutrients, hydrocarbons), acute water ecotoxicity was chosen as a parameter of environmental quality since it synthesizes effects from several pollution components and may be associated with produced water discharges as well as oil spills (see, for example, Franco et al. Citation2006; Andrade et al. Citation2011). This was also selected in view of easiness of public understanding and relevance to the kind of projects under review. Thus, the resulting indicator was the number of platforms which had seawater samples identified as toxic in its vicinity (i.e. over 10% lethality rate in reference organisms).
shows the results consolidated for the two selected environmental state indicators.
Graphic 3. Selected Environmental State Indicators for Offshore Oil and Gas Production (Source: Author’s draft, based on reports from environmental permitting processes).
Response indicators
Data related to response efforts are also limited, though some impact mitigation measures, such as the Environmental Education Program, could provide applicable information if reports were required to integrate related information. Currently, results linked to response actions are mostly described in text form and scattered in different media (reports, meetings, recordings), thus making collection costs prohibitive and impairing reproducibility.
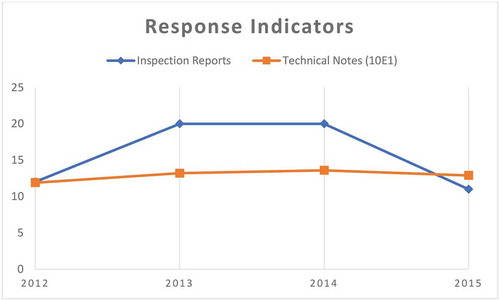
Therefore, analysis turned to internal records. COPROD reviews the results of monitoring activities and conducts on-site inspections on platforms, vessels and affected areas. These actions are means of response and can be measured, albeit imperfectly, by the numbers of technical notes and inspection reports issued specifically concerning ongoing oil production undertakings in the area of interest (Campos and Espirito Santo basins). They also generally address applicable environmental standards and focus on relevant aspects of permitted undertakings.
Some technical notes analyse several years of environmental monitoring and numerous interrelated projects while others may focus on a singular intervention and less complex issues. Nevertheless, considering that these amount to over a hundred per year, the total number indicates to some extent the level of effort dedicated to follow-up activities and responses to impacts of ongoing undertakings in the area. Inspection reports, on the other hand, follow a technical standard (IBAMA, Citation2012) and generally reflect one singular inspection on a specific facility.
Every technical note and inspection report related to already authorized oil and gas production activities in the Campos or Espirito Santo Basin was accounted for. The results from this compilation are displayed in .
Graphic 4. Selected Response Indicators for Offshore Oil and Gas Production (Source: Author’s draft, based COPROD´s internal archives).
Integrated analysis
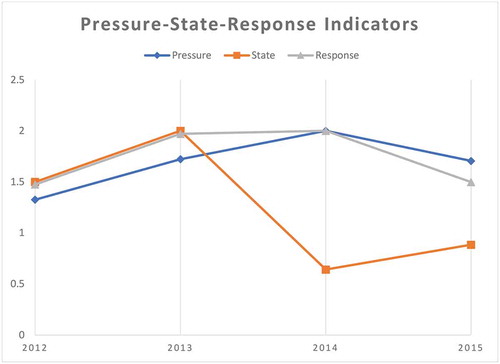
Considering the results obtained, showing similar behaviour among sets of indicators, these were normalized to the 0–1 range and integrated (simple sum) in order to enable joint visualization on . Normalization was accomplished through the division of all values in a set by the highest number encountered in that specific set.
Graphic 5. Integrated Pressure-State-Response Indicators for Offshore Oil and Gas Production (Source: Author’s draft).
Graphic 6. Environmental Indicators for Offshore Oil and Gas Production (Source: Author’s draft).
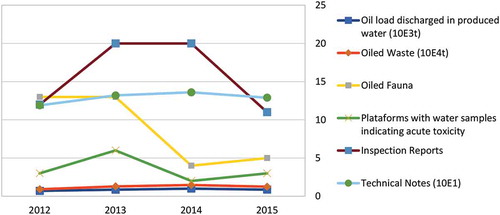
The indicators related to oiled fauna and inspection reports showed the highest standard deviation (both with 4.26) while the others had σ < 1 except for the number of platforms with water samples indicating acute toxicity (σ = 1.5). Though every selected indicator provides meaningful information, a better analysis would require larger samples, a longer time horizon and a more complete set of indicators.
Considering this setting and in accordance with the established methodology, additional data were compiled for the whole timeframe available since the initial selected year (2012–2018).
Reviewed PSR indicators for the 2012-2018 interval
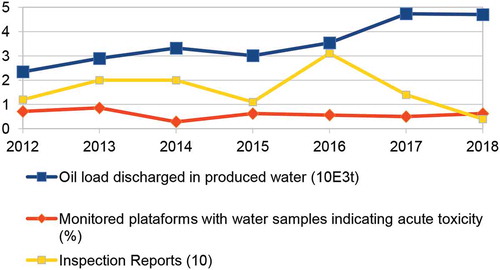
Three related indicators were selected for further development: oil load discharged in produced water; percentage of monitored oil production platforms with water samples indicating acute toxicity; and number of inspection reports of ongoing production undertakings in the interest area.
Graphic 7. Selected Environmental Indicators for Offshore Oil and Gas Production (Source: Author’s draft).
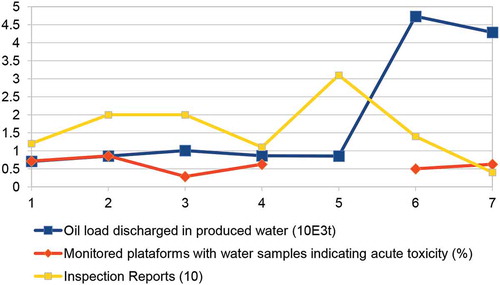
Graphic 8. Selected Environmental Indicators for Offshore Oil and Gas Production Adjusted (Source: Author’s draft).
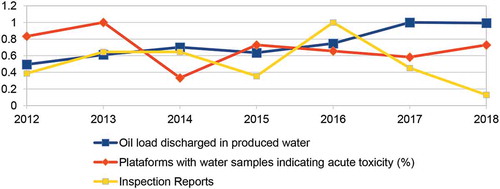
Graphic 9. Selected Environmental Indicators for Offshore Oil and Gas Production Adjusted and Normalized (Source: Author’s draft).
After a series of inspections aboard platforms and onshore laboratories in 2016, the methodology used for measuring oil content in several facilities was corrected to include total oil content, including soluble and insoluble fractions (oil and grease). Thus, the measured values of total oil content raised manifold from 2016 to 2017 in some units, even though the total amount of water discharged did not change significantly, nor is there reason to believe the effluent changed so drastically. The semi-submersible oil platform named Petrobras 51, for example, reported 53,97 tonnes of total oil load in produced water in 2016 and 387,44 tonnes in 2017 (718% increase), despite discharging similar volumes (5,77 x 10⁶ m3 in 2016 and 5,89 x 10⁶ m3 in 2017 – a 2% increase). Considering this issue, an adjustment was made for every installation presenting sizeable change (reported oil load increase above 300% in 2017) through the use of a correction factor based on the difference between average oil load in 2013–2014 and the one reported in 2017. In the case of Petrobras 55 and Petrobras 62, which started producing water after this period, the value reported in 2016 was used as reference. The result is presented in . Also, one notes that in 2016 there was no sampling effort in PMPR-BC. Below, this data gap was filled with the average value obtained between 2015 and 2017.
Despite the use of a correction factor, the increase of the pressure indicator is still noticeable in 2017, followed by a small decrease in 2018, possibly due to platforms improving produced water management to meet existing legislation (IBAMA process nº 02001.000128/2018-26 shows a series of measures in this respect). Meanwhile, inspections peaked markedly in 2016, reaching their lowest level in 2018. Participant observation enabled the identification that, during 2017 and 2018, the follow-up of inspections made in 2016 and requirements of improved produced water management were a focus of the coordination and are not reflected by this indicator, since they comprise the review of reports, the elaboration of technical notes and further support to the establishment of judicial enforcement instruments. Lastly, shows the same indicators, now with the data normalized (0–1 range) for better visualization.
The graphic shows a growing trend in the pressure indicator, reflecting the reality of a mature exploration area with a raising water/oil ratio in production. In the meantime, the state indicator remains relatively constant. Noteworthy is that the number of monitored platforms is relatively small and sampling efforts are limited in view of the costs of offshore activities. Ideally, all companies and projects should follow the same monitoring protocol, enabling proper compilation and comparison of results as well as a more robust dataset. The indicator with the highest standard deviation was the response indicator (σ = 0,8), signalling that monitoring efforts in the area varied expressively between years. It is noteworthy to observe that reported oil load discharged in produced water increased in 2017 after inspections identified inadequate monitoring procedures in 2016, showing that response efforts can also uncover hidden pressures. This attests to the limitations of the indicators set, which should always be considered alongside other information sources and contextual analysis.
Conclusion
Existing information sources are limited, being conditioned by restricted monitoring efforts as well as possible bias. However, the data provide useful evidence and may aid in planning, evaluation and decision-making. Monitoring of such aggregated statistics enables a holistic vision and the identification of trends under development. The sheer amount of oil load discharged in produced water, for example, raises concerns related to possible bioaccumulation and cumulative impacts in unmonitored regions of the ocean. A systematic follow-up of this data might support new regulatory approaches and different mitigation strategies within EIAs.
The results indicate that designing a set of environmental indicators, following the pressure-state-response model, may be valuable for the environmental permitting of offshore oil and gas production in Brazil. However, this constitutes a challenging task due to the number of factors involved and the non-linear nature of cause–effect relationships in this area. These issues, combined with the absence of a structured effort and the existing shortcomings of EIA practice in the country, place such a development still far from reach. Ideally, continuous monitoring efforts would be reported online and supported by robust databases as well as standard monitoring protocols followed by all production facilities. Moreover, a proper set of indicators should be designed not only based on existing data, but also on the search for nexus between pressure-state-response factors and continually evolve to meet established objectives and concerns.
In this sense, since the generation and destination of waste is monitored, it would be reasonable to have information regarding the surrounding environment and, eventually, inspections at the facilities responsible for their final destination. A way forward is the integration of information databases, linking the monitoring of waste destination installations required in their specific environmental licensing processes to information acquired by the oil and gas sector. Furthermore, an overview of existing pressures and environmental quality could assist a more general approach to project management and permitting. The challenge is not only to create more data sources, but to guarantee that they are consistent and appropriately structured in order to facilitate follow-up and learning.
Concluding, the proposed indicators may be considered a first step in the process of developing a larger set of integrated statistics. Such a development would enable, in the long run, a better understanding and monitoring of the offshore oil and gas activities. It would allow, for example, a better evaluation of the expected number of wildlife to be found in any given period and region or requirements for better practices concerning produced water treatment by offshore platforms (e.g. restricting total load of oil discharged annually). This, in turn, may favour proper and timely action on expected impacts, orienting project design and follow-up efforts.
It would also be a step in the direction of overcoming many project-EIA practice shortcomings’, such as the need for using practices that value learning by evaluating past cases (Borioni et al. Citation2017) and mechanisms that facilitate access and preserve knowledge (Cruz et al. Citation2018); increasing transparency and public participation (Vilardo and La Rovere Citation2018); structuring relevant data (Tshibangu and Montaño Citation2019) and revamping electronic repositories (Duarte et al. Citation2017; Fonseca and Rivera Fernández Citation2020); and further connecting strategic-level assessments and project-level assessments (‘tiering’) (Vilardo and La Rovere Citation2018).
All in all, implementing such a set of environmental indicators for an environmental licensing activity linked to systematic EIA practice seems like a dauting task. Many challenges lay ahead, but the potential benefits are substantial, and it is a way forward which might present interesting opportunities in dealing with the pressing issue of effectiveness.
References
- Andrade BG, Andrade VT, Costa BRS, Campos JC, Dezotti M. 2011. Distillation of oil field produced water for reuse on irrigation water: evaluation of pollutants removal and ecotoxicity. J Water Reuse Desal. 1(4):224–236. doi:10.2166/wrd.2011.044.
- ANP, 2016. Agência Nacional do Petróleo, Gás Natural e Biocombustíveis. Dados Estatísticos 2016. Enchova. [accessed 2018 Aug 20]. www.anp.gov.br/wwwanp/?dw=81114
- ANP, 2018a. Agência Nacional do Petróleo, Gás Natural e Biocombustíveis. Banco de Dados de Exploração e Produção (BDEP). [accessed 2018 Apr 8]. http://webmaps.anp.gov.br/mapas/Lists/DSPAppPages/MapasBrasil.aspx
- ANP, 2018b. Agência Nacional do Petróleo, Gás Natural e Biocombustíveis. Dados Estatísticos 2018. [accessed 2018 Aug 20]. http://www.anp.gov.br/exploracao-e-producao-de-oleo-e-gas/gestao-de-contratos-de-e-p/dados-de-e-p
- ANP, 2019. Agência Nacional do Petróleo, Gás Natural e Biocombustíveis. V Workshop de Segurança Operacional e Meio Ambiente (SOMA). [accessed 2020 Feb 17]. http://www.anp.gov.br/arquivos/palestras/vii-soma/desempenho-seguranca.pdf
- ANP, 2020. Agência Nacional do Petróleo, Gás Natural e Biocombustíveis. Dados Estatísticos 2019. [accessed 2020 Feb 17]. http://www.anp.gov.br/wwwanp/dados-estatisticos
- Ashworth PD. 1995. The meaning of “participation” in participant observation. Qual Health Res. 5(3):366–387. doi:10.1177/104973239500500307.
- Borioni R, Gallardo ALCF, Sánchez LE. 2017. Advancing scoping practice in environmental impact assessment: an examination of the Brazilian federal system. Imp Assess Proj Appr. 1–14. doi:10.1080/14615517.2016.1271535
- Brazil. 2007. Ministério do Meio Ambiente, Conselho Nacional do Meio Ambiente. Resolução CONAMA N°393, de 8 de agosto de 2007. [accessed 2018 Apr 8]. http://www.mma.gov.br/port/conama/legiabre.cfm?codlegi=541
- Brazil. 2011. Ministério do Meio Ambiente, Conselho Nacional do Meio Ambiente. Resolução CONAMA 430 de 13 de maio de 2011. [accessed 2018 Apr 16]. http://www.mma.gov.br/port/conama/legiabre.cfm?codlegi=646.
- Brazil. 2012. Ministério do Meio Ambiente e Ministério de Minas e Energia. Portaria Interministerial N° 198, de 5 de abril de 2012. [accessed 2020 May 3]. http://www.anp.gov.br/arquivos/exploracao-producao/sgom/meio/portaria-198-2012-aaas.pdf
- Bredariol TO, d’Avignon AL. 2018. Institutions and environmental governance: the case of environmental permitting for offshore oil and gas projects. Ambiente E Sociedade. 21. doi:10.1590/1809-4422asoc0090r1vu18l1ao.
- Cashmore M, Bond A, Sadler B. 2009. Introduction: the effectiveness of impact assessment instruments. Imp Assess Proj Appr. 27(2):91–93. doi:10.3152/146155109X454285.
- Cashmore M, Gwilliam R, Morgan R, Cobb D, Bond A. 2004. The interminable issue of effectiveness: substantive purposes, outcomes and research challenges in the advancement of environmental impact assessment theory. Imp Assess Proj Appr. 22(4):295–310. doi:10.3152/147154604781765860.
- Cilliers DP, Van Staden I, Roos C, Alberts RC, Retief FP. 2020. The perceived benefits of EIA for government: a regulator perspective. Imp Assess Proj Appr. 1–10. doi:10.1080/14615517.2020.1734403
- Cordes EE, Jones DO, Schlacher TA, Amon DJ, Bernardino AF, Brooke S, Carney R, DeLeo DM, Dunlop KM, Escobar-Briones EG, et al. 2016. Environmental impacts of the deep-water oil and gas industry: a review to guide management strategies. Front Environ Sci. 4. doi:10.3389/fenvs.2016.00058.
- Cruz FB, Veronez FA, Montaño M. 2018. Evidence of learning processes in EIA systems. Imp Assess Proj Appr. 36(3):242–252. doi:10.1080/14615517.2018.1445177.
- Da Silva AWL, Selig PM, Van Bellen HM. 2014. Use of sustainability indicators in strategic environmental assessment processes conducted in Brazil. J Environ Assess Policy Manage. 16(2):1450008. doi:10.1142/S1464333214500082.
- Dong Y, Hauschild MZ. 2017. Indicators for environmental sustainability. Procedia CIRP. 61:697–702. doi:10.1016/j.procir.2016.11.173
- Duarte, C. G., Dibo, Ana Paula Alves.., Siqueira-Gay, J., & Sánchez, L. E. 2017. Practitioners’ perceptions of the Brazilian environmental impact assessment system: results from a survey. Impact Assessment and Project Appraisal. doi:10.1080/14615517.2017.1322813 4 35 48-309
- Fakhru’l-Razi A, Pendashteh A, Abdullah LC, Biak DR, Madaeni ZZ, Abidin SS. 2009. Review of technologies for oil and gas produced water treatment. J Hazard Mater. 170(2–3):530–551. doi:10.1016/j.jhazmat.2009.05.044.
- Fine GA. 2015. Participant observation. In: International encyclopedia of the social & behavioral sciences. 2nd ed. 530-534. Elsevier Ltd. doi:10.1016/B978-0-08-097086-8.44041-9
- Fonseca A, Rivera Fernández GM. 2020. Reviewers’ perceptions of the volume of information provided in environmental impact statements: the case for refocusing attention on what is relevant. J Clean Prod. 251:119757. doi:10.1016/j.jclepro.2019.119757
- Franco MA, Viñas L, Soriano JA, de Armas D, González JJ, Beiras R, Salas N, Bayona JM, Albaigés J. 2006. Spatial distribution and ecotoxicity of petroleum hydrocarbons in sediments from the Galicia continental shelf (NW Spain) after the Prestige oil spill. Mar Pollut Bull. 53(5–7):260–271. doi:10.1016/j.marpolbul.2005.10.004.
- Gao J, Kørnøv L, Christensen P. 2013. The politics of strategic environmental assessment indicators: weak recognition found in Chinese guidelines. Imp Assess Proj Appr. 31(3):232–237. doi:10.1080/14615517.2013.786925.
- Hayes AC. 2017. What is impact assessment? Some personal reflections C. P. Wolf (1933–2015). Imp Assess Proj Appr. 35(3):186–199. edited posthumously by Adrian C. Hayes. doi:10.1080/14615517.2017.1322812.
- IBAMA – Instituto Brasileiro do Meio Ambiente e dos Recursos Naturais Renováveis. 2012. Nota Técnica Cgpeg/Dilic/Ibama Nº 08/12. Brasília:Manual de Procedimentos para Vistorias de Embarcações de Emergência e de Pesquisa Sísmica e de Plataformas de Produção e de Perfuração.
- IBAMA – Instituto Brasileiro do Meio Ambiente e dos Recursos Naturais Renováveis. 2013. Nota Técnica Cgpeg/Dilic/Ibama Nº 03/13. Rio de Janeiro: Diretrizes para aprovação dos Planos de Emergência Individual – PEI, nos processos de licenciamento ambiental dos empreendimentos marítimos de exploração e produção de petróleo e gás natural. 20 de setembro de 2013. http://www.consultaesic.cgu.gov.br/busca/dados/Lists/Pedido/Attachments/436934/RESPOSTA_PEDIDO_nt.pdf
- Joseph C, Gunton T, Rutherford M. 2015. Good practices for environmental assessment. Imp Assess Proj Appr. 33(4):238–254. doi:10.1080/14615517.2015.1063811.
- Kawulich BB 2005. Participant observation as a data collection method. Forum Qualitative Sozialforschung. https://doi.org/10.17169/fqs-6.2.466
- Kazak J, Świąder M, Szewrański S, Żmuda R. 2017. Geo-environmental indicators in strategic environmental assessment. Acta Sci Pol Formatio Circumiectus. 16(2):123–135. doi:10.15576/ASP.FC/2017.16.2.123.
- Kemerich PDDC, Ritter LG, Borba WF 2014 Indicators of environmental sustainability: methods and applications Revista do Centro de Ciências Naturais E Exatas. 13 (5):3723–3736. UFSM, Santa Maria Revista Monografias Ambientais - REMOA e- 2236 1308. Edição Especial LPMA/UFSM. doi:10.5902/2236130814411
- Laedre O, Haavaldsen T, Bohne RA, Kallaos J, Lohne J. 2015. Determining sustainability impact assessment indicators. Imp Assess Proj Appr. 33(2):98–107. doi:10.1080/14615517.2014.981037.
- Meuleman L. 2015. Owl meets beehive: how impact assessment and governance relate. Imp Assess Proj Appr. 33(1):4–15. doi:10.1080/14615517.2014.956436.
- Morgan RK. 2012. Environmental impact assessment: the state of the art. Imp Assess Proj Appr. 30(1):5–14. doi:10.1080/14615517.2012.661557.
- Naime A. 2017. An evaluation of a risk-based environmental regulation in Brazil: limitations to risk management of hazardous installations. Environ Impact Assess Rev. 63:35–43. doi:10.1016/j.eiar.2016.11.005
- Neri, A. C., Dupin, P., & Sánchez, L. E. 2016. A pressure-state-response approach to cumulative impact assessment. Journal of Cleaner Production. doi:10.1016/j.jclepro.2016.02.134 126
- Neri AC, Dupin P, Sánchez LE. 2016. A pressure-state-response approach to cumulative impact assessment. J Clean Prod. 126:288–298. doi:10.1016/j.jclepro.2016.02.134
- Niemeijer D, de Groot RS. 2008. A conceptual framework for selecting environmental indicator sets. Ecol Indic. 8(1):14–25. January. doi:10.1016/j.ecolind.2006.11.012
- Ou, C-H.., & Liu, W-H.. 2010. Developing a sustainable indicator system based on the pressure–state–response framework for local fisheries: A case study of Gungliau, Taiwan. Ocean & Coastal Management. doi:10.1016/j.ocecoaman.2010.03.001 5–6 53 289-300
- Ramos TB, Caeiro S, de Melo JJ. 2004. Environmental indicator frameworks to design and assess environmental monitoring programs. Imp Assess Proj Appr. 22(1):47–62. doi:10.3152/147154604781766111.
- SIMBA – Sistema de Informação de Monitoramento da Biota Aquática. 2020. Sistema de Informação de Monitoramento da Biota Aquática. [accessed 2020 May 10]. https://segurogis.petrobras.com.br/simba/web/
- Stoeglehner G. 2020. Strategicness – the core issue of environmental planning and assessment of the 21 st century. Imp Assess Proj Appr. 38(2):141–145. doi:10.1080/14615517.2019.1678969.
- Tshibangu GM, Montaño M. 2019. Outcomes and contextual aspects of strategic environmental assessment in a non-mandatory context: the case of Brazil. Imp Assess Proj Appr. 37(3–4):334–343. doi:10.1080/14615517.2019.1603715.
- United Nations. 2017. Resolution adopted by the General Assembly on 6 July 2017, 71/313. Work of the Statistical Commission pertaining to the 2030 Agenda for Sustainable Development. [accessed 2018 Mar 14]. https://undocs.org/A/RES/71/313
- Vilardo C, Barbosa AF. 2018. Can you hear the noise? Environmental licensing of seismic surveys in Brazil faces uncertain future after 18 years protecting biodiversity. Perspect Ecol Conserv. 16(1):54–59. doi:10.1016/j.pecon.2017.11.005.
- Vilardo C, La Rovere EL. 2018. Multi-project environmental impact assessment: insights from offshore oil and gas development in Brazil. Imp Assess Proj Appr. 36(4):358–370. doi:10.1080/14615517.2018.1475615.