
 ?Mathematical formulae have been encoded as MathML and are displayed in this HTML version using MathJax in order to improve their display. Uncheck the box to turn MathJax off. This feature requires Javascript. Click on a formula to zoom.
ABSTRACT
In this paper, a comparative review is provided of the quality of EIA systems in 65 countries participating in the Belt and Road Initiative (BRI). Furthermore, whether the quality of EIA systems is correlated with national GDP per capita in each country is explored. The review is carried out by means of an integrated EIA index (EIA Quality index – EQI). In developing the EQI, views and perceptions of experts were considered, based on Multi-Criteria-Decision-Analysis (MCDA). Results of the comparative evaluation indicate that there is great disparity between EIA systems in the 65 countries. Countries with existing challenges, such as poverty, civil war and institutional instability tend to achieve lower EQI scores. Finally, a positive (albeit weak) correlation is found between EQI scores and GDP per capita.
Introduction
The Belt and Road Initiative is an ambitious Chinese foreign policy, potentially including 70 countries and representing two-thirds of the global population. With a total value of over US$8 trillion by 2049, this initiative aims at unprecedented levels of infrastructure development, extending across borders of countries and being located within and between world regions (Hughes Citation2019). Associated projects (e.g. roads, railway lines, pipelines and ports) are aimed at enhancing intercontinental trade, economic growth and energy security (Ascensão et al. Citation2018). They are typically of a large-scale trans-boundary nature and have socio-economic and environmental consequences (Lechner et al. Citation2018), going beyond local, regional and national borders (Tracy et al. Citation2017). In particular, there are significant risks for the environment and Hughes (Citation2019) categorized potential environmental impacts of BRI as follows:
direct environmental resource destruction;
raw material extraction;
increased access to natural resources;
habitat fragmentation; as well as
increased wildlife trafficking.
Policymakers face considerable challenges when aiming at achieving resource-efficient, environmentally sustainable and economically viable Belt and Road investments (Wong and Jia Citation2017). These challenges have led to calls for strengthening environmental legislation and associated policy instruments in countries participating in the BRI initiative (Ascensão et al. Citation2018). Environmental Impact Assessment (EIA) as well as Strategic Environmental Assessment (SEA) are potentially key tools for China and partner countries for integrating environmental information into decision-making (Aung et al. Citation2020). However, countries and funding agencies involved in the BRI initiative have different environmental and EIA policies, making the application of consistent EIA standards across projects challenging. Also, in some countries, authorities might decide to relax EIA requirements in order to attract BRI related investment, and institutional, political and financial constraints may limit the effectiveness of EIA to reduce and mitigate environmental impacts.
To date, understanding of how EIA systems in countries participating in the BRI initiative compare has remained poor (Aung et al. Citation2020). Past research in evaluating EIA mainly relied on checklist-based qualitative reviews, with a few notable exceptions (see e.g. Arts et al. Citation2012). Whilst Aung et al. (Citation2020) provided an overview of some EIA systems and their compatibility with the Chinese system, there is currently no comprehensive and complete data set of EIA systems of all BRI countries. Having a good understanding of different EIA systems is vital, though, in order to be able to support delivery of good environmental – and social – outcomes, next to achieving economic development. It is in this context that this paper aims at addressing the existing knowledge gap by providing for a systematic review and comparative evaluation of EIA in 65 BRI countries. Evaluation is conducted by applying an EIA quality index (EQI). This is based on a range of important criteria that allow for an appraisal of the quality of EIA systems. The 65 countries were chosen, based on the availability and comprehensiveness of EIA information (further explained below).
The potential relationship between the EQI and GDP per capita is also explored, using statistical analysis. Various authors have suggested that there is a positive relationship between the level of economic development and environmental performance of countries (Corrigan et al. 2014; Fakher and Abedi Citation2017). However, there is currently no clear evidence on this relationship. In this context, reference has been made to air pollution reduction, formulation of environmental policy and indices such as the Environmental Performance Index and Environmental Sustainability Index (ESI) (Cracolici et al. Citation2010; Tektüfekçi and Kutay Citation2016; Chowdhury and Islam Citation2017; Fakher and Abedi Citation2017; Dkhili Citation2019; Le et al. Citation2019). As indicated by the results of 2020 Environmental Performance Index (EPI), good environmental governance and policy can be associated with GDP per capita, because economic prosperity allows countries to invest in systematic environmental regulation procedures that lead to better outcomes. On the other hand, the pursuit of higher GDP can result in more environmental problems, such as air and water pollution. It has also been suggested that good environmental governance can offset these negative impacts (Wendling et al. Citation2020).
What we are looking for in this paper are indications for whether there is a correlation between EQI scores and GDP per capita. It is not our attention to develop comprehensive analyses or models (e.g. Environmental Kuznets Curve (EKC) or Pollution Heaven Hypothesis (PHH)).
Review of EIA in BRI
There is a well-developed literature on the influence of EIA on decision-making processes of project development (see e.g. Arts et al. Citation2012; Loomis and Dziedzic Citation2018). A widely used method in evaluating EIA is the comparative review of different legal systems and other features, including policy principles, implementation provisions and documentation processes (Fischer 2015; Retief et al. Citation2016; Bond Citation2018). EIA is known to promote sustainability and has been adopted in literally all countries worldwide (Morgan Citation2012). EIA is now also widely recognized as a globally accepted norm (Yang Citation2019). However, the quality of EIA systems differs substantially with regards to institutional and governance qualities (Abaza et al. 2004; Arts et al. Citation2012).
EIA systems in a range of BRI countries have been reviewed in the past, however without referring to the BRI initiative (with most pre-dating it). provides an overview of those studies.
Table 1. Literature on EIA reviews in countries involved in BRI. For more detailed information about the literature, see (Aung et al. Citation2020)
Consideration of EIA in belt and road project approval processes
In 2016, China’s National Development and Reform Commission (NRDC) promulgated new measures to restrain undesirable investments (Sheng Citation2018). Regulatory changes were made for outbound investments, including investments along the Belt and Road countries to obtain clearance from the NRDC. The key regulators involved in the process are the state-owned Assets Supervision and Administration Commission of the State Council (SASAC), acting as shareholder of Central Government state-owned Enterprises and the Ministry of Finance and Commerce (MOFCOM), the Ministry of Finance and Commerce (MOFCOM) and the State Administration of Foreign Exchange (SAFE). summarizes the approval process of Chinese outbound investments. Typical projects under the Belt and Road involve; 1. Strategic foresight, 2. Preliminary preparation, 3. Project bid, 4. Operation management and 5. Project completion and exit (PWCCN Citation2015).
China developed environmental regulations for foreign outbound investments, such as guidelines for environmental preservation in foreign investment and enterprise, guidance on promoting a Green Belt and Road and the AIIB directive on environmental and social protection (AIIB Citation2016). Likewise, project approval processes restrict investments that fail to meet basic environmental, energy efficiency and safety standards (Sheng Citation2018). However, guidelines do not specify how these measures will be evaluated and administered. The screening of sensitive and non-sensitive projects in current approval regulation is primarily based on political and security, but not environmental concerns. For instance, prohibited transactions include the export of core military technologies, gambling and sex industries, and media operations.
Figure 1. BRI project approval process
Methodology
The research methodology of the project underlying this paper consists of five main stages: (1) collection of relevant information on EIA systems, (2) review checklist development, (3) weighting and normalization of selected criteria, (4) comparative evaluation of EIA systems against selected criteria, and (5) aggregation of final scores and correlation analysis. At the first stage, we gathered primary legal sources of EIA systems and also consulted the literature on any other relevant information. Starting point for this exercise was the official database of the national Belt and Road Portal of China (https://www.yidaiyilu.gov.cn; https://www.ydylcn.com) where each BRI participating country is represented. The Portal provides for some comprehensive information on economic data, political context, as well as on environmental and other policy-related documents. The database currently covers 49 countries’ EIA systems. Information for the 16 countries not included in the Portal (and additional data for the other 49 countries) were obtained from official sources, including those provided by government departments, NGOs, universities as well as books and journal articles. Supplementary summarizes the materials used.
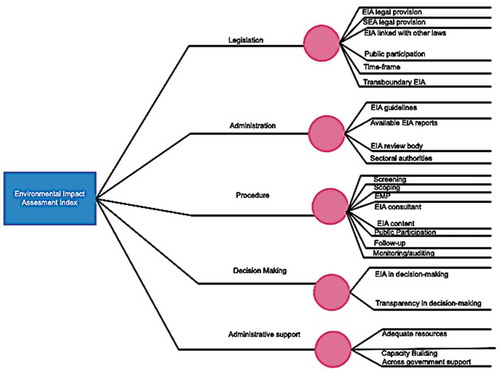
A checklist-based criteria tree was designed, based on the EIA comparative review criteria developed by Ahmad & Wood (Citation2002), based on Wood (Citation1995), Ortolano et al. (Citation1987) and Leu et al. (Citation1996; see ). This is based on a hierarchical framework, grouping 23 attributes within five criteria. Criteria reflect different important aspects of EIA, including (a) legislation, (b) administrative arrangements, (c) procedure (d) decision-making, and (e) support provided to administrations. The framework was used to evaluate each Belt and Road participating country’s EIA legal requirements. Each attribute is subdivided and expressed through a range of aspects (86 in total). These aspects were subdivided for analytical consistency in line with the checklist evaluation framework developed by USEPA (Citation1998) and triangulated with principles of EIA best practice developed by IAIA (Goldsmith et al. Citation1999).
Figure 2. EIA index criteria tree
At the third stage, we used Multi-Criteria-Decision-Analysis (MCDA) to weigh and normalize selected criteria and to construct an EIA quality index (EQI). MCDA allows to construct indices, based on the quantitative assessment of different variables and component metrics (Brombal et al. Citation2017). MCDA is considered an adequate approach for dealing with multidimensional concepts such as operationalization of sustainability policies (Munda 2005). It also allows to incorporate perceptions of experts by attributing weights and indicators. The specific approach used in the analysis underlying this paper is a Multi-Attribute-Value-Theory (MAVT) approach. The advantages of MAVT include a capability to support the structuring of problems, applying different criteria and attributes and to use both, qualitative and quantitative approaches (Brombal et al. Citation2017). Parameters pertinent to each attribute were normalized by converting them into weights on a scale of 0 to 1 (0.00, 0.10, 0.33, 0.66, 1.00). For three attributes, L6. D1 and D2, only 2 to 3 aspects were used. This does not affect evaluation results, though, as the highest score is still 1.00 and the lowest is 0.00.
Normalization is based on weighting of criteria. Weights were allocated by a panel of four EIA experts who participated in the 3rd Digital Belt and Road Conference held in Tengchong, China on 5–7 December 2018. Although the number of experts is small, they were closely involved with the formulation of the environmental framework for BRI. summarizes affiliation and expertise of the panel experts. During the meeting, which was moderated by the authors, experts discussed and allocated importance scores, using a five-point scale, ranging from ‘1 (not important)’ to ‘5 (extremely important)’. In case of disagreement among panel members, diverging opinions were discussed with the aim of creating consensus on an importance score. Importance scores were then converted into weights using the equation below:
Table 2. Criteria, attributes and normalized measurements
Table 3. Experts background information
Where: is the important scores.
At the fourth stage, a comparative review of EIA requirements based on EQIs was conducted. Based on the EIA materials collected, authors assigned a score to each attribute of the EQI. Scores were then aggregated using following equation:
Where: Xi refers to the score of each attribute; Wx refers to the weight of each criterion; Wxi refers to the weights of each attribute.
Whilst comparative evaluation is the primary goal of analysis, the authors also explored possible associations between the quality of EIA systems and a country’s GDP per capita. For this purpose, Pearson Correlation was used. For simple correlation purposes, this technique measures the strength and direction of the linear relationship between two quantitative, continuous variables. Pearson correlation is appropriate to use when the two variables of interest are scored, using interval measures (Schober and Schwarte Citation2018). Despite its widespread application, it is important to interpret Pearson correlation results with caution due to some limitations. For instance, r tests only the linear relationship between variables (Armstrong Citation2019).
Results and discussion
EIA systems of the 65 BRI countries are ranked, based on their EQI scores. shows rankings for each of the five EIA criteria. There are considerable differences between countries with regards to aspects, attributes and criteria. Overall, the EIA system of Lithuania obtains the highest score of 0.87, followed by the systems from Moldova (0.85), Hungary (0.85) and Latvia (0.80). shows EQI results for China as an example. shows final scores.
Table 4. EQI result for China
Table 5. Country ranking with regards to EIA scores
Table
Overall, EIA systems of European countries mostly achieve high scores, occupying thirteen out of the top twenty places. Asian countries’ EIA scores are spread more widely. EIA systems from China and Bhutan emerge with the highest scores, while those from the Maldives, Kyrgyzstan and Bangladesh are among the lowest scoring. China’s EIA system comes sixth withinBRI countries and came out on top in Asia with an overall score of 0.77, followed by Bhutan (0.76). EIA systems from Middle Eastern countries on average obtained middle ranking scores. Here, Israel’s EIA system obtained the highest score (13th overall). Iraq’s EIA system obtained the lowest score in the region (58th position). Low scores are also obtained by EIA systems of Turkmenistan (0.11), the Maldives (0.12), Kyrgyzstan (0.12), Bangladesh (0.16), Bosnia (0.16), Uzbekistan (0.17), Tajikistan (0.17), Iraq (0.19), Azerbaijan (0.19) and Afghanistan (0.24). Belarus, as a non-democratic state, is the only European country with a relatively low overall score (0.24) for its EIA system, ranking 56th.
We suggest that the lower the score the more urgent the need to critically review an EIA system – and to improve it, if BRI investment is sought. In this context, the authors suggest that any investment be connected with acceptable EIA standards. Some of the lowest-ranking nations face several other challenges, such as civil instability, border security issues and poverty (Cederman and Pengl Citation2019). Generally speaking, lowest scores can be attributed to an overall weak institutional governance (see also Yale University Citation2018). The Chinese EIA system scores strongly on criteria such as EIA administration, procedure and government support. Of the lower income developing countries in Asia, Bhutan’s EIA system ranks seventh for the overall score, reflecting well-developed environmental regulations. There is a strong commitment here to integrate EIA into decision-making processes and there is a comprehensive EIA implementation procedure (Donelley and H. 1998; National Environmental Commission Citation2012).
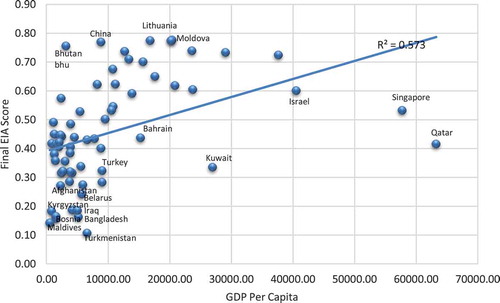
Correlation analysis between EQI and GDP per capita scores shows that there is some correlation of an EIA system’s comprehensiveness and a country’s GDP per capita. However, relationships are complex. Generally speaking, results are somewhat hampered by a lack of time-series data. We observed a significant positive correlation between income, measured by GDP per capita, and the overall EQI scores (p < 0.001) ().Countries with higher GDP achieve higher scores, with a few notable exceptions, including e.g. Kuwait, Turkey and Bahrain. Also, China and Bhutan obtain higher EQI scores than expected, given their GDP per capita figures. Taken together, the findings from the correlation analysis are consistent with suggestions that environmental regulation stringency is enhanced with higher levels of economic development, even though the situation is complex and there are many outliers, meaning that explanatory power of GDP per capita is not very strong. This is in line with what Esty and Porter (Citation2002) reported on the relationships of environmental quality and economic development. They established that there were significant differences in environmental performance among countries with similar levels of economic development. Samimi et al. (Citation2010) argued that EPI and economic growth is positive. Similar suggestions were made by Tektüfekçi and Kutay (Citation2016) with regards to the relationship between EPI and GDP. Le et al. (Citation2019) also observed a substantial difference in environmental performance in low, middle – and high-income countries, and higher income countries generally perform better.
Figure 3. The result of Pearson-correlation between GDP per capita and final EQI score
ranks five criteria for each country. The countries are listed in ascending order based on the first criterion, legislation. Results are briefly described below.
Table 6. Country ranking of EIA criteria
Legislation
Literally, all countries around the world have some statutory requirements for EIA. EIA is also increasingly recognized as a universally accepted principle of law (Yang Citation2019). However, the extent and quality of assessment practice vary substantially between different countries. Estonia, Hungary and Lithuania stand out with the highest scores. China out-ranks countries in all regions except Europe. This has been said to be associated with China’s early implementation of EIA and its now firmly established EIA system (Khadka and Shrestha Citation2011).
SEA has also been institutionalized in several countries across the BRI. The European Union SEA Directive has been the main driver of SEA in Europe. Some of the countries that were part of the Soviet Union and that became independent post 1990 (i.e. the countries referred to as newly independent states – or NIS, including Armenia, Azerbaijan, Belarus, Georgia, Ukraine) do not have SEA requirements and therefore obtain lower scores. In East and South-East Asia, many countries have some SEA requirements (Annandale et al. Citationforthcoming). While China, Indonesia and Vietnam conduct SEA to comply with legal frameworks, other countries’ SEAs have mostly been driven by donor requirements (Loayza Citation2012). Furthermore, the Mediterranean Environmental Technical Assistance Program (METAP) is very important in initiating national EIA and SEA in the Middle-East (El-Fadl and El-Fadel Citation2004). In the South Asian Region (SAR), only Bhutan has comprehensive requirements for SEA under its Environmental Assessment Act (Annandale Citation2012). 58% of the SEAs for the 43 identified World Bank-supported SEAs undertaken in SAR between 1993 and 2012 were conducted in India, followed by Pakistan and Nepal (Jha Thakur and Rajvanshi Citationforthcoming; Lima ; Loayza Citation2012). There are only a few countries with transboundary requirements. These include a few European countries where national legislation asks for transboundary impacts of large-scale projects to be considered in line with the UNECE Espoo Convention. In most of Asia and the Middle East, there are only declarations of intent of following the provision of the Espoo Convention (if the country has ratified it). However, there is no evidence of compliance (Heaton and Burns Citation2014). Formal provisions for public participation are also highly variable in BRI countries, although some legal requirements exist in most countries. Even in high-scoring countries, public participation only starts when EIA has already been progressing for some time, rather than at the start of it (Brombal et al. Citation2017).
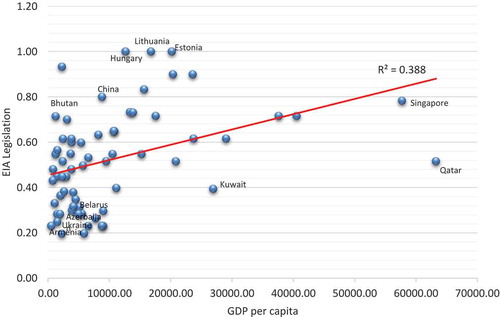
Correlation between a country’s GDP per capita and EIA legal requirements is positive and significant (p < 0.001), but weak (). This result suggests that political commitment and donor organizations’ support play an important role and GDP is only one of many factors affecting EIA legislation.
Figure 4. The relationship between GDP per capita and strength of EIA legislation
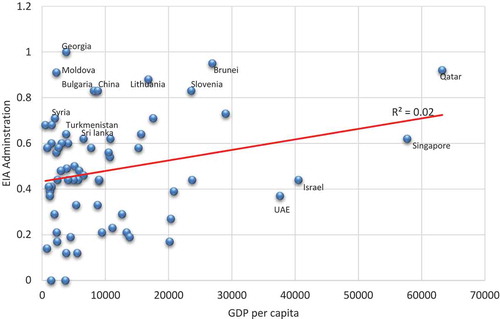
Administration
Georgia achieved the top score for EIA administration, followed by Qatar, Brunei, Moldova and Lithuania. Georgia’s high score can be explained in particular by public access to EISs being mandatory (The Legislative Herald of Georgia Citation2013). Bulgaria, China and Slovenia hold joint sixth place (). A total of eleven European countries are in the top twenty group with regards to EIA administration. Somewhat surprisingly, some lower-income countries with lower overall scores (such as Turkmenistan, Syria, and Sri Lanka) also obtain scores within the top twenty. This result is associated with the involvement of international donor organizations, including the World Bank and the Asian Development Bank in the drafting of EIA legislation and guidance in developing countries (Brew and Lee Citation1996). The EU also contributes to the development of administrative structures and capacity building and the establishment of environmental policies in the Middle-East, especially in Egypt, Israel, Jordan, Lebanon, Syria and Palestine (Brew and Lee Citation1996).
China and Bhutan have comprehensive EIA guidelines. This is not surprising, as these two nations have made considerable efforts in recent years in enhancing their environmental governance regimes (Castillo 2015). Most of the European and South-East Asian countries also have comprehensive guidance for EIA in place (Swangjang Citation2018). Middle-Eastern and Central Asian countries perform comparatively poorly in this regard. EIA statements are publicly available only in some countries, such as Estonia, Lithuania and Bhutan, although they are archived to some extent in practically all BRI countries. shows the correlation between EIA administration and GDP per capita. The relationship between the two variables is statistically insignificant (at p = 0.869).
Figure 5. The relationship between GDP per capita and EIA Administration
Implementation procedure
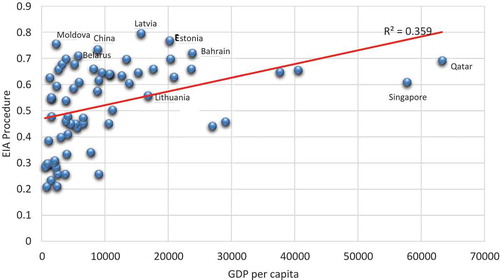
With regards to ‘EIA implementation procedure’ (i.e. completeness of the EIA process), Latvia, Moldova, China and Estonia obtained highest scores, followed by Bahrain and Belarus (). Whilst for Lithuania, the EIA implementation procedure score was lower than those for other criteria, some essential steps were covered, including screening, scoping, EMP, public participation and follow-up.
Screening differs widely among countries. In most of Central Asia, South-East Asia and Europe, screening is mainly conducted based on lists of different types of projects. In the Middle-East, screening is mainly based on very broadly defined categories of activities. A common shortcoming is the absence of screening in many countries altogether, including Latvia, Belarus, Georgia, Russia, Kazakhstan, Kyrgyzstan, Turkmenistan, Ukraine and Albania. In many NIS countries, EIA implementation is deficient. Also, legislation is said to not always be followed (The World Bank Citation2002). While most European and East and South-East Asian countries legally require scoping to involve stakeholders, several countries have no scoping procedure in place at all, including Bosnia, Albania, Belarus, Tajikistan, Turkmenistan and Uzbekistan (Cherp 2001a). Another discrepancy is the lack of requirements for EMP.
Correlation analysis shows that there is a positive and significant, yet weak correlation between EIA procedure and GDP per capita (; at p = 0.0032). Many lower-income countries have higher scores than could have been expected when considering their GDP per capita. Distinct differences also occur amongst countries with similar GDP per capita.
Figure 6. The relationship between GDP per capita and EIA Procedure
Decision-making
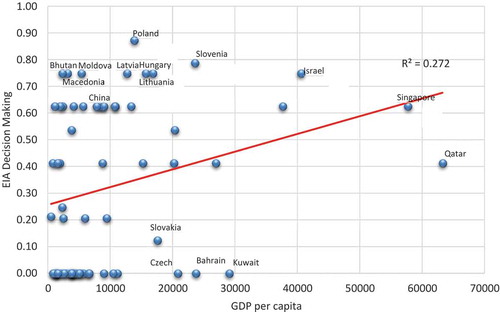
Poland and Slovenia receive the top two scores with regards to integration of EIA results in decision-making. Bhutan, Hungary, Israel, Latvia, Lithuania, Macedonia and Moldova all share the third highest score. In these countries, project decision-making is said to be fairly transparent, with regulatory requirements for the incorporation of EIA results into decision-making in place. China scores within the top ten countries, making it one of the two Asian countries with higher scores (the other being Singapore). Implementation of both, EIA and SEA in most NIS countries within Europe and Central Asia should be closely looked at in order to improve decision-making effectiveness. Lack of transparency is observed in many South-East Asian, South-Asian and Middle Eastern countries.
Whilst decision-making has a positive and significant correlation with GDP per capita (at p = 0.000), this relationship is weak. This is not surprising, though, looking at the scores in . Hence, stringency and transparency of environmental regulation and overall economic development do not progress in parallel. In practice, the comparison of results suggests that having robust EIA legislation, administration and procedural aspects in place does not directly translate into implementation of EIA results in decision making.
Figure 7. The relationship between GDP per capita and EIA decision-making
Administrative support
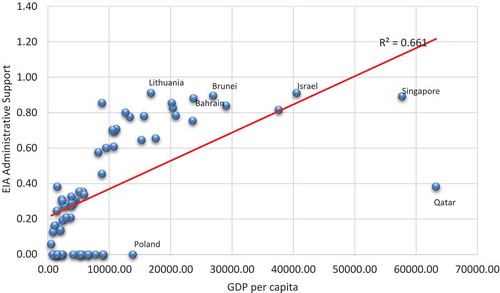
Israel and Lithuania top the list with regards to administrative support for EIA. The governments of these countries are said to provide adequate financial and technical resources and regular capacity building activities for the execution of EIA (Gabbay Citation2002; Kruopiene et al. Citation2009). There is also a formal mechanism for cross-government coordination of the EIA process. Brunei, Singapore and Bahrain have third, fourth and fifth highest scores, respectively. In general, high-income European countries exhibit stronger legislation, administration, procedures and long-standing governmental commitments to EIA. Lower income-countries suffer from insufficient technical and human capacity and are easily overstretched with regards to financial resources when conducting EIA (Kolhoff et al. Citation2013; Aung et al. Citation2020). Those countries also need support for increasing awareness and capacity.
Administrative support is strongly correlated with GDP per capita (R2 = 0.661 at p < 0.001) (). Consistent with environmental-economic theories (Hanna and Hanna), our results suggest that effective administrative support requires resources necessary to effectively implement legislation that are more readily available in higher income countries.
Figure 8. The relationship between GDP per capita and EIA administrative support
Conclusions
In order to be able to improve environmental regulation, awareness and performance for BRI countries, good environmental data are required at local, national, regional and global levels. In this paper, we made the first ever attempt to build an index-based EIA repository (based on an EIA Quality Index – EQI – score) for BRI countries. Data generated in this context offer important clues as to where there is a need for improvement. Financial support should be connected with a requirement to create EIA systems that perform well. The comparative review presented in this paper shows that there is a considerable degree of variance among countries with regards to aspects, attributes and criteria. EIA systems of European countries overall obtain high scores. However, incorporation of the results of EIA in decision making appears weak even in the most developed countries. There is also a lack of transparency in decision-making processes. On the other hand, amongst lower income country, Bhutan scored strongly with regards to integrating EIA into the decision-making process. The EIA system in China is sixth within all BRI countries and is ranked top in Asia.
Results reveal that there is a great disparity among BRI countries with regard to EIA. It is therefore crucial to prioritize environmental cooperation and take environmental issues into account at the early stage of project implementation. The findings provided in the study might help to support better decision-making at the project approval level. These findings can be useful when attempting to determine whether or not the investment is environmentally safe.
In the paper, we tested how GDP per capita of a country is associated with EQI scores, providing preliminary empirical evidence for cross-country differences. Whilst there is some correlation of EQI and GDP per capita, the significance of this relationship is not uniform across the different criteria. While the correlations between GDP per capita and overall EQI scores as well as for the criterion administrative support for EIA are statistically significant and clear, underlying legislation, completeness of EIA procedure and influence on decision-making are not and the quality of the existing environmental regime as well as requirements by international donor agencies play important roles. The rigor and structure of environmental regulations as well as the ability to enforce compliance appear to play a particular important role (similarly to what was observed by Fischer and Gazzola (Citation2006)). EIA systems improve with regards to stronger administrative support as GDP grows. This includes the development of skills of those involved in EIA as well as and more rigorous capacity-building.
The findings introduced in this paper carry important policy implications. While economic advancement can be a key mechanism for effective EIA, a weak correlation between GDP and various EIA criteria implies that a nation’s bro-ader legal and other institutional underpinnings, and international support are crucial for achieving EIA effectiveness. BRI projects can help developing countries to modernize their economies. In this context, they should also aim at improving regulatory systems and environmental performance. EIA can play an important role in achieving this. Future research should further explore this relationship between EQI and GDP, using systematic econometric techniques when national level environmental data for these countries become available.
Supplemental Material
Download MS Word (368.8 KB)Supplementary materials
Supplemental data for this article can be accessed here.
References
- Ahmad, B., & Wood, C. (2002). A comparative evaluation of the EIA systems in Egypt, Turkey and Tunisia. Environmental Impact Assessment Review, 22, 213–234.
- AIIB. 2016. AIIB env and social framework.
- Annandale D. 2012. Developing and evaluating environmental impact assessment systems for small developing countries. Impact Assess and Project Appraisal. 5517. doi:10.3152/147154601781766998.
- Annandale D, Montaño M, Fischer TB, Purcell C, Coles J, Aung T. forthcoming. Guidelines for SEA in developing countries – examples from Asia. Fischer TB, González A. editors. International handbook of strategic environmental assessment. Cheltenham:Edward Elgar; chapter 9
- Armstrong RA. 2019. Should Pearson’s correlation coefficient be avoided? Ophthalmic and Physiol Opt. 39(5):316–327. doi:10.1111/opo.12636.
- Arts J, Runhaar HAC, Fischer TB, Jha-Thakur U, Van Laerhoven F, Driessen PPJ, Onyango V. 2012. The effectiveness of EIA as an instrument for environmental governance: Reflecting on 25 years of EIA practice in the Netherlands and the UK. In J of Environ Assess Policy and Manage. Vol. 14(4):1250025. Issue. doi:10.1142/S1464333212500251.
- Ascensão F, Fahrig L, Clevenger AP, Corlett RT, Jaeger JAG, Laurance WF, Pereira HM. 2018. Environmental challenges for the belt and road initiative. Nat Sustainability. 1(5):206–209. doi:10.1038/s41893-018-0059-3.
- Aung TS, Fischer TB, Shengji L. 2020. Evaluating environmental impact assessment (EIA) in the countries along the belt and road initiatives: system effectiveness and the compatibility with the Chinese EIA. Environ Impact Assess Rev. 81(January):106361. doi:10.1016/j.eiar.2019.106361.
- Balsam Ahmad CW. 2002. A comparative evaluation of the EIA systems in Egypt, Turkey and Tunisia. Environ Impact Assess Rev. 22(3):213–234. doi:10.1016/S0195-9255(02)00004-5.
- Bond A. 2018. The never ending conundrum of the application of science in EIA. Impact Assess and Project Appraisal. 1–2. doi:10.1080/14615517.2018.1552443
- Bond A, Pope J, Fundingsland M, Morrison-Saunders A, Retief F, Hauptfleisch M. 2020. Explaining the political nature of environmental impact assessment (EIA): A neo-Gramscian perspective. J Clean Prod. 244:118694. doi:10.1016/j.jclepro.2019.118694
- Brew D, Lee N. 1996. Reviewing the quality of donor agency environmental assessment guidelines. Project Appraisal. 11(2):79–84. doi:10.1080/02688867.1996.9727022.
- Brombal D, Moriggi A, Marcomini A. 2017. Evaluating public participation in Chinese EIA. an integrated public participation index and its application to the case of the new Beijing Airport. Environ Impact Assess Rev. 62:49–60. doi:10.1016/j.eiar.2016.07.001
- Cederman L, Pengl Y 2019. Global Conflict Trends and their Consequences *.
- Chen Q, Zhang Y, Ekroos A. 2007. Comparison of China ’ s environmental impact assessment (EIA) law with the European Union (EU) EIA directive. Environ Monit Assess (2007). 132(1–3):53–65. doi:10.1007/s10661-006-9502-4.
- Chowdhury T, Islam S. 2017. Environmental performance Index and GDP growth rate: evidence from BRICS countries. Environ Econ. 8(4):31–36. doi:10.21511/ee.08(4).2017.04.
- Cracolici MF, Cuffaro M, Nijkamp P. 2010. The measurement of economic, social and environmental performance of countries: A novel approach. Soc Indic Res. 95(2):339–356. doi:10.1007/s11205-009-9464-3.
- Dkhili H. 2019. Environmental performance and economic growth in middle east and north Africa countries. J of Health and Pollut. 9(24):24. doi:10.5696/2156-9614-9.24.191208.
- El-Fadl K, El-Fadel M. 2004. Comparative assessment of EIA systems in MENA countries: Challenges and prospects. Environ Impact Assess Rev. 24(6):553–593. doi:10.1016/j.eiar.2004.01.004.
- Esty DC, Porter ME. 2002. Ranking national environmental regulation and performance: A leading indicator of future competitiveness? The Global Compet Rep. 78–100. doi:10.1017/S1355770X05002275
- Fakher H, Abedi Z. 2017. Relationship between environmental quality and economic growth in developing countries (based on environmental performance index). Environl Energy and Econ Res. 1(3):299–310. doi:10.22097/eeer.2017.86464.1001.
- Fischer TB, Gazzola P. 2006. SEA effectiveness criteria-equally valid in all countries? The case of Italy. Environ Impact Assess Rev. 26(4):396–409. doi:10.1016/j.eiar.2005.11.006.
- Frankel MB, R D 2015. Mekong Partnership for the Environment MEKONG EIA BRIEFING : Environmental Impact Assessment Comparative Analysis In Lower Mekong Countries.
- Gabbay S 2002. The environment in Israel. State of Isreal Ministry of the Environment.
- Gałaś S, Gałaś A, Zeleňáková M, Zvijáková L, Fialová J, Kubíčková H. 2015. Environmental impact assessment in the visegrad group countries. Environ Impact Assess Rev. 55:11–20. doi:10.1016/j.eiar.2015.06.006
- Goldsmith B, Conover S, Brown K 1999. Principles of environmental impact assessment.
- Gomes Lima AL, Ernesto S-T, De Silva D, Afza J, Paul T, Enriquez S, Ferdausi S, Raj Ghimire D, A. R. M, H. R. B (2015). south asia review.pdf. 35th Annual Conference of the International Association of Impact Assessment, Florance, Italy, 1–6.
- Heaton C, Burns S. 2014. An evaluation of environmental impact assessment in Abu Dhabi, United Arab Emirates. Impact Assess and Project Appraisal. 5517. doi:10.1080/14615517.2014.908004.
- Hughes AC. 2019. Understanding and minimizing environmental impacts of the belt and road initiative. Conserv Biol April. 33(4):883–894. doi:10.1111/cobi.13317.
- Ivanov V. 2009. Establishment of the strategic environmental assessment (sea) system in the republic of Moldova. In: Bahadir A, editor. The role of ecological chemistry in pollution research and sustainable development. 1st ed. Springer, Netherlands; p. 263–267.
- Jha-Thakur U, Rajvanshi A. forthcoming. strategic environmental assessment in India: Trends and prospects. Fischer TB, González A. editors. International handbook of strategic environmental assessment. Cheltenham:Edward Elgar; chapter 25.
- Khadka RB, Shrestha US. 2011. Process and procedure of environmental impact assessment application in some countries of South Asia: A review study. J of Environ Sci and Technol. 4(3):215–233. doi:10.3923/jest.2011.215.233.
- Kolhoff AJ, Driessen PPJ, Runhaar HAC. 2013. An analysis framework for characterizing and explaining development of EIA legislation in developing countries — illustrated for Georgia, Ghana and Yemen. Environ Impact Assess Rev. 38:1–15. doi:10.1016/j.eiar.2012.04.004
- Kolhoff AJ, R. HAC, D PPJ. 2009. The contribution of capacities and context to EIA system performance and effectiveness in developing countries: towards a better understanding. Impact Assess and Project Appraisal . 27(4):271–282. doi:10.3152/146155109X479459.
- Kruopiene J, Židoniene S, Dvarioniene J. 2009. Current practice and shortcomings of EIA in Lithuania. Environ Impact Assess Rev. 29(5):305–309. doi:10.1016/j.eiar.2009.02.003.
- Laevskaya E 2013. Review of legislation of the Republic of Moldova with regard to implementation of the UNECE Protocol on Strategic Environmental Assessment.
- Le TH, Chang Y, Park D. 2019. Economic development and environmental sustainability: evidence from Asia. Empir Econ. 57(4):1129–1156. doi:10.1007/s00181-018-1494-8.
- Lechner AM, Chan FKS, Campos-Arceiz A. 2018. Biodiversity conservation should be a core value of China’s belt and road initiative. Nat Ecol and Evol. 2(3):408–409. doi:10.1038/s41559-017-0452-8.
- Leu WS, Williams WP, Bark AW. 1996. Development of an environmental impact assessment evaluation model and its application: taiwan case study. Environ Impact Assess Rev. 16(2):115–133. doi:10.1016/0195-9255(95)00107-7.
- Loayza F. 2012. Strategic environmental assessment in the world bank: Learning from the recent experience and challenges, Washington, DC.
- Loomis JJ, Dziedzic M. 2018. Evaluating EIA systems’ effectiveness: A state of the art. Environ Impact Assess Rev. September 2017, 68:29–37. doi:10.1016/j.eiar.2017.10.005.
- Lotman S, Avramov S, Anna I (2013). Implementation of environmental impact assessments in Central and Eastern Europe. [accessed 2020 May 10]. http://www.ceeweb.org/wp-content/uploads/2012/01/Implementation-of-Environmental-Impact-Assessments-in-Central-and-Eastern-Europe.pdf
- Morgan RK. 2012. Environmental impact assessment: The state of the art. Impact Assess and Project Appraisal. 30(1):5–14. doi:10.1080/14615517.2012.661557.
- Morgan RK. 2017. Conceptualising best practice in impact assessment. Environ Impact Assess Rev. 66(February):78–85. doi:10.1016/j.eiar.2017.06.009.
- National Environmental Commission. 2012. Environmental Assessment General Guidelines Bhutan. Issue May.
- Ortolano L, Jenkins B, Abracosa RP. 1987. Speculations on when and why EIA is effective. Environ Impact Assess Rev. 7(4):285–292. doi:10.1016/0195-9255(87)90002-3.
- Põder T, Lukki T. 2011. A critical review of checklist-based evaluation of environmental impact statements. Impact Assess and Project Appraisal. 29(1):27–36. doi:10.3152/146155111X12913679730511.
- PWCCN. 2015).海外工程项目 一站式解决方案.
- Retief F, Bond A, Pope J, Morrison-Saunders A, King N. 2016. Global megatrends and their implications for environmental assessment practice. Environ Impact Assess Rev. 61:52–60. doi:10.1016/j.eiar.2016.07.002
- Samimi AJ, Erami NE, Mehnatfar Y. 2010. Environmental performance index and economic growth: Evidence from some developing countries. Aust Jl of Basic and Appl Sci. 4(8):3098–3102.
- Schober P, Schwarte LA. 2018. Correlation coefficients: Appropriate use and interpretation. Anesth Analg. 126(5):1763–1768. doi:10.1213/ANE.0000000000002864.
- Sheng M 2018. Chinese outbound investment regulations for a new year. [accessed 2020 May 10]. https://www.ashurst.com/en/news-and-insights/legal-updates/chinese-outbound-investment-regulations-for-a-new-year/
- Swangjang K. 2018. Comparative review of EIA in the association of southeast Asian Nations. Environ Impact Assess Rev. 72(March):33–42. doi:10.1016/j.eiar.2018.04.011.
- Tektüfekçi F, Kutay N. 2016. The relationship between EPI and GDP growth: An examination on developed and emerging Countries. Jl of Mod Accounting and Auditing. 12(5):268–276. doi:10.17265/1548-6583/2016.05.003.
- The Legislative Herald of Georgia. 2013. Law of Georgia on environmental impact permits. Issue 4400. [accessed 2020 May 10]. https://matsne.gov.ge/en/document/download/20206/13/en/pdf
- The World Bank. 2002. Environmental impact assessment systems in Europe and central Asia countries Europe and central Asia environmentally and socially sustainable development department website: www.worldbank.org/eca/environment. Issue May. [accessed 2020 May 10]. www.worldbank.org/eca/environment
- Tracy EF, Shvarts E, Simonov E, Babenko M. 2017. China’s new Eurasian ambitions: the environmental risks of the silk road economic belt. Eurasian Geogrand Econ. 58(1):1938–2863. doi:10.1080/15387216.2017.1295876.
- USEPA. (1998). Principles of Environmental Impact Assessment Review: Appendix A: Environmental Impact Assessment Checklist.
- Wendling, Z. A., Emerson, J. W., de Sherbinin, A., Esty, D. C. (2020). 2020 Environmental Performance Index. New Haven, CT: Yale Center for Environmental Law & Policy. [accessed 2020 May 10]. https://epi.yale.edu/epi.yale.edu
- Wong AA, Jia S (2017). Belt & road: Opportunity & risk the prospects and perils of building China’s new silk road. [accessed 2020 May 10]. https://www.bakermckenzie.com/-/media/files/insight/publications/2017/10/belt-road/baker_mckenzie_belt_road_report_2017.pdf?la=en
- Wood C (1995). Catalog search results | hathiTrust digital library. University of Michigan. [accessed 2020 May 10]. https://catalog.hathitrust.org/Search/Home?type%5B%5D=oclc&lookfor%5B%5D=49525839&page=1&pagesize=20&ft=
- Yale University. (2018). Introduction | environmental performance Index. Environmental Performance Index. [accessed 2020 May 10]. https://epi.envirocenter.yale.edu/2018-epi-report/introduction
- Yang T. 2019. The emergence of the environmental impact assessment duty as a global legal norm and general principle of law. Hastings Law J. 70(2):525.