
ABSTRACT
Impact assessment (IA) follow-up is necessary to determine the environmental effects of a project or plan to inform ongoing management. No previous research confirms if visitor surveys may be used to this extent for developments within a protected. This paper explores if and how visitor surveys may be used as a tool for supporting EIA follow-up within protected areas. Relevant EIA documentation was appraised to determine EIA performance expectations for management of the Nombolo Mdhluli Conference Centre development in the Kruger National Park. Forty-four expectations were identified, translated into questions, and included in a survey scale. Eighty-nine conference delegates completed the survey whereafter an Importance Performance Analysis (IPA) method was used to map the responses in four IPA map quadrants: 1. Possible overkill, 2. Low priority, 3. Q3 Keep up the good work, and 4. Concentrate here. The IPA map displays 29 items of statistical significance in the four IPA map quadrants with 12 items in the ‘Concentrate here’ quadrant. The IPA results mapped the need for management to concentrate on responsible building, waste, water, energy, compliance, awareness, cumulative impact management. The paper shows that visitor surveys may be used as a simple but effective tool for supporting EIA follow-up monitoring.
1. Introduction
Impact assessment (IA) follow-up refers to any type of venture aiming to ‘understand the outcomes of projects or plans subject to impact assessment’ (Arts and Morrison-Saunders Citation2022, p. 1). Environmental impact assessment (EIA) follow-up specifically is viewed as an essential operating principle and component of an EIA process (International Association for Impact Assessment IAIA Citation1999; Pinto et al. Citation2019) and essentially aims to answer the question: ‘Was the project and the impacted environment managed in an acceptable way?’ (Morrison-Saunders and Arts Citation2004). However, many sources emphasize the historical neglect and poor development of EIA follow-up globally (Sadler Citation1996; Dipper et al. Citation1998; Wood Citation1999, Citation2003; Hill Citation2000; Runhaar et al. Citation2013; Wessels Citation2015; Pinto et al. Citation2019) related to the elements of follow-up [monitoring, evaluation, management, communication, and governance] (Arts et al. Citation2001; Pinto et al. Citation2019; Arts and Morrison-Saunders Citation2022).
Perhaps, a reason for the poor track record of doing follow-up is the effort and/or related resources required to design and implement formal monitoring programs by the primary EIA actors [proponent and EIA authority]. This notion is supported by the findings of Kolhoff et al. (Citation2016) in low- and middle-income countries about actor’s capacities [the abilities of people, organizations, and society to achieve their objectives] that leads to weak substantive EIA performance [the extent to which the EIA process contributes to the EIA objectives (Sadler Citation1996)]. Kolhoff et al. (Citation2016, p. 172) argue that ‘ownership for EIA and EIA follow-up is the result of the capacity of the primary actors’ ‘motivation’ [the will to achieve the EIA goal] and ‘means’ [the ability to achieve the EIA goal] and the interaction between these two capacities is complex’. Moreover, and relevant to capacity ‘means’, International Network for Environmental Compliance and Enforcement (INECE) (Citation2009) (cited in Kolhoff et al. Citation2016, p. 169) observe ‘human-technical and resource capacities during EIA follow-up are always limited and therefore it depends on the organizational sub-capacities of leadership and strategy as to how they are used most effectively’.
Resource constraints and effective use of resources for EIA follow-up are particularly relevant to the iconic Kruger National Park (KNP) in South Africa where Strategic and/or Environmental Managers, other KNP Managers, and Rangers are often immersed in urgent conservation matters such as anti-poaching activities (SANParks South African National Parks Citation2013a). This calls for smart and effective use of alternative resources to support EIA follow-up such as tapping into existing communication and participation efforts with third party EIA follow-up community representatives (Morrison-Saunders et al. Citation2003) to meet best practice principles specific to public participation in IA follow-up (Morrison-Saunders et al. Citation2023). Moreover, effective communication and participation with third parties are viewed lately as a key element of EIA follow-up (Morrison-Saunders et al. Citation2021) which may be due to increased concern about and call for impact assessment practitioners to assist project proponents to measure and monitor their ‘social license to operate’ (SLO) (Bice and Moffat Citation2014; Dare et al. Citation2014; Boutilier Citation2014).
SLO is commonly understood as ‘the ongoing acceptance and approval of a project by local community members and other stakeholders that can affect its profitability’ (Moffat and Zhang Citation2014). There are numerous interesting studies providing reasons for and innovative ways of engaging with the local community and other stakeholders to support SLO monitoring of projects which has undergone formal EIA in various sectors such as minerals mining, other extractive industries [e.g. gas], and forestry (Ruckstuhl et al. Citation2014; Martinez and Franks Citation2014; Parsons and Moffat Citation2014; Dare et al. Citation2014). In protected areas specifically, visitor surveys are a popular method used to engage with stakeholders that can affect its profitability. In fact, in identifying the main components of visitor research in protected area management, Slabbert and Du Preez (Citation2021) found that survey methodology was the most prevalent data collection technique, in the 407 studies that they analysed. Even so, to our knowledge no cross-disciplinary research has been done to explore the use of visitor surveys as a tool for supporting EIA follow-up within protected areas such as the KNP.
The aim of the paper is, therefore, to explore if and how visitor surveys may be used as a tool for supporting EIA follow-up within protected areas. The remainder of the paper is structured as follows: first, an overview of the methodology [context, target population, and methods] is provided in section 2, where after the results are presented in section 4 [demographic data; importance and performance means, performance gap, and t-tests; and the IPA map results with implications for management]. A discussion follows in section 5 on the use of visitor surveys and IPA as a tool to support EIA follow-up, and final conclusions are drawn in section 5.
2. Methodology
To meet the research objective, that is to determine if and how visitor surveys may be used as a tool for supporting EIA follow-up at a conference centre in the iconic KNP, quantitative and exploratory research methods were used (Tong Citation2001; Cooper and Schindler Citation2011; Aggarwal and Agarwala Citation2022) based on a survey and an importance performance analysis. The next sections briefly explore the position of this research in the context of EIA for protected areas in South Africa (2.1), the rationale for the target population (2.2), and a description of steps of the method that was adopted (2.3).
2.1. Context
The Nombolo Mdhluli Conference Centre [hereafter ‘the Conference Centre’] is situated in Skukuza Rest Camp, the largest rest camp, and administrative headquarters of the KNP; a protected area in the northeastern corner of South Africa the size of ‘the whole of Israel, a little smaller than Belgium’ (Homes of Africa, Citationn.d.). EIA [and subsequent follow-up] is a formally required decision support instrument in South Africa under Section 24 of the National Environmental Management Act (NEMA) and is compulsory for all listed development activities in specific areas such as protected geographical areas (RSA Republic of South Africa Citation2014, Citation2017). In the KNP, oversight on environmental decisions and conditions is provided by the Strategic Environmental Manager, with consultation by other KNP Managers from various other departments for new and/or extension projects. Development for the Conference Centre was approved in 2008 [construction was completed in 2011] and required a mandatory Basic Assessment (BA) process [a scaled-down EIA process] approval in terms of Chapter 5 [section 24(2)] of the NEMA (RSA Republic of South Africa Citation1998).
2.2. Target population
We recognise that to conduct a detailed EIA follow-up and/or SLO to understand the outcomes and ongoing acceptance of the Conference Centre project, sufficient communication, and participation with representatives of all local communities and other stakeholders are needed that can affect its profitability (Moffat and Zhang Citation2014; Arts and Morrison-Saunders Citation2022). There are numerous local communities and other stakeholders that can affect the Conference Centre’s profitability. These include, for example, the community residing in Skukuza [e.g. Park management and employees], the periphery community [‘many diverse cultural groupings that make their homes on the periphery of the KNP’ (Wessels and Douglas Citation2022, p. 6)], and the visiting community [e.g. authorities, recreational and business tourists]. The objective of this research is, however, limited to determine if and how visitor surveys may be used as a tool for supporting EIA follow-up at a conference centre, and we therefore targeted business tourists visiting the Conference Centre as a key stakeholder that can affect its profitability.
2.3. Methods
The following topics describe the steps of the method that was adopted.
Survey development: Surveys have been used frequently in EIA inquiries (e.g. Morrison-Saunders and Sadler Citation2010; Duarte et al. Citation2017; Liu et al. Citation2022) and are commonly used in studies where a large pool of respondents is required (Goodwin Citation2004). Therefore, in this study, we made use of surveys, since it allowed us to make inferences from a wider population, as we were able to collect information from a large number of subjects (Silverman Citation2005). An important step towards meeting the research objective relied on the identification of EIA expectations. Such expectations were then subject to an exploratory investigation. The documentation generated during the EIA [or BA] process for the conference centre development was sourced from KNP and analysed. Thereafter, EIA performance expectations were determined from the EIA documentation. In total, 44 expectations were identified. These EIA expectations were then converted into an importance-performance scale (see ). To improve the readability of this scale, similar items were grouped together into seven categories based on categories of criteria of the South African National Responsible Tourism Standard SANS1162: 2016 for the performance of organizations in the tourism sector in relation to sustainability. These are as follows: visual and aesthetic; water and waste; energy and air; biodiversity and geology [Environmental criteria]; compliance, enforcement, and awareness; access and traffic [Sustainable operations and management criteria]; and local community [Social and cultural criteria, and Economic criteria] (South African Bureau of Standards Citation2016).
Table 1. 1Importance and performance means, performance gap, and t-tests2 results.
Respondents [business tourists visiting the Conference Centre as per Target population discussion] were first asked to provide some demographic data [including gender, qualifications, job title, and industry], and thereafter to rate the importance of each of the 44 items for any conference venue in a natural setting on a Likert scale with 1 being of no importance, and 5 of extreme importance. Then, they were asked to rate the performance of the conference centre on a scale from 1 = extremely poor to 5 = excellent. While drafting the scale items, care was taken to use accessible and non-technical language to increase the response rate, since using technical language could have excluded many respondents (Macintosh Citation2010). Moreover, part of the rationale for targeting business tourists attending conferences is that survey participation is more likely to increase with high occupational class or high level of education (Reinikainen et al. Citation2018; Spitzer Citation2020). Before distributing the survey, a pilot test was done, by sending it to five academics in the environmental assessment field.
Data collection: Convenience sampling was used to distribute a paper-based survey to delegates attending conferences hosted at Nombolo Mdhluli Conference Centre during September 2018 (67 completed responses), October 2018 (6 completed responses) and March 2019 (16 completed responses). Surveys were included in the delegates’ conference packs and once completed returned to the conference organisers. In total, 89 responses were obtained and used in the data analysis.
Data analysis: SPSS was used to calculate the frequency of responses, and t-tests were conducted to assess whether the differences between importance and performance ratings were statistically significant. Statistical significance was defined as a p-value ≤0.10 (Zvijáková et al. Citation2014). Differences were plotted on an Importance Performance Analysis (IPA) map (); one of the most abundant methodological tools utilised in tourism research (Lee et al. Citation2008; Boley et al. Citation2017) to ‘distinguish between what stakeholders think is an important component of a specific issue and their actual perceptions on how well the issue is being managed’ (Boley et al. Citation2017, p. 66). In the tourism context, this is important as EIA follow-up essentially aims to answer, ‘was the project and the impacted environment managed in an acceptable way?’ (Morrison-Saunders and Arts Citation2004).
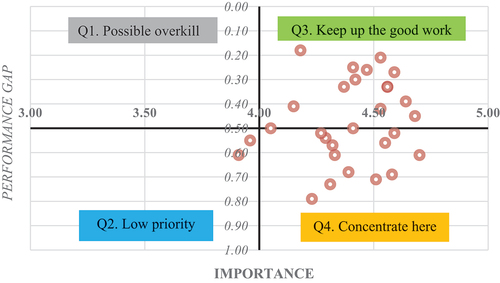
Figure 1. IPA map for environmental impact assessment items.
The following section presents Demographic data; Importance and performance means, performance gap, and t-tests; and the IPA map results and implications for management.
3. Results
A brief overview of the demographic characteristics of the respondents is provided in this section before the survey results are presented in Section 2.3 with providing the importance and performance means, performance gaps, and t-tests results, followed by a brief interpretation. Section 3.1 provides a visual representation of statistically significant differences between respondents’ importance and performance ratings. The IPA map () is used to translate the survey results into meaningful EIA follow-up information.
Of the 89 respondents, 53% were male (n = 47) and 47% female (n = 42). In terms of level of education, almost 90% of respondents (n = 80) held postgraduate degrees. Interestingly, of the 89 respondents, 56% (n = 50) indicated that they are employed in the tertiary education sector with job titles for these 50 respondents ranging from student to professor in environmental fields. Moreover, the other respondents specialised in related environmental fields such as Agriculture, Hydrology and Engineering, Water Resources, Nature Conservation, Biochemistry, and associated Government Departments such as the Council for Scientific and Industrial Research.
3.1. Importance and performance results
As explained previously, the survey scale consisted of 44 EIA expectation items, grouped into seven categories (as depicted in ). Respondents were first asked to rate the importance of the EIA expectation items for any conference venue in a natural setting, where after they were requested to rate their performance perceptions of the Conference Centre on these aspects. shows the calculated frequency of responses, and t-test analysis results on whether the differences between importance and performance ratings were statistically significant. The colour keys used in represent the placement of items with lower performance than importance ratings [see Performance gap (I-P)] and statistically significant differences (between importance and performance ratings) within the IPA map quadrants () are discussed further in section 3.1. The keys are:
Grey colour representing Quadrant 1 (Q1) ‘Possible overkill’ [no items in this quadrant]; Blue colour representing Quadrant 2 (Q2) ‘Low priority’ [two items highlighted in blue], Green colour representing Quadrant 3 (Q3) ‘Keep up the good work’ [15 items highlighted in green]; and Orange colour representing Quadrant 4 (Q4) ‘Concentrate here’ [12 items highlighted in orange]. No colour represents items with higher performance than importance ratings [see Performance gap (I-P)] and no significant differences between Importance and Performance ratings.
Respondents rated the importance of the following items as the highest: 41. Carrying capacity of the park should not be exceeded (M = 4,7); followed by 34. Quality of water available for human consumption (M = 4,68); and 23. Protection of biodiversity (M = 4,64). Respondents had the lowest importance expectations for 5. Use of natural building material (M = 3,71); followed by 8. Architecture considers local culture (M = 3,80); and 1. Aesthetic appeal (M = 3,84).
Respondents rated the performance of all the items above average, either between neutral and good, or between good and excellent for the Conference Centre. They had the highest performance perceptions on items: 17. Availability of electricity (M = 4,64); followed by 33. Sufficient game viewing routes (M = 4,51); and 38. Sufficient parking (M = 4,36). However, performance perceptions were rated the lowest for items: 43. Opportunities are provided for tourists to interact with local people (M = 3,30); 37. Limiting the use of private transport to minimise environmental impact (M = 3,41); and 14. Water recycling (M = 3,44).
A performance gap was measured by subtracting the performance mean from the importance mean for each of the items (see , Performance gap = I-P). When measuring the difference between importance and performance ratings, respondents rated the performance of the Conference Centre higher than their expectations for 11 of the 44 items. Interestingly, seven of the 11 items are from the category Visual and aesthetic, which shows a high-performance perception in general by respondents for the Conference Centre in this category. Three of the 11 items are from the category Access and Traffic and the remaining item from the Energy and air category.
Next, t-tests were conducted to establish whether the differences between respondents’ importance and performance ratings were statistically significant [* Statistically significant: p ≤ 0.10; ** Statistically significant: p ≤ 0.05; *** Statistically significant: p ≤ 0.01]. The t-test results show that 30 of the 44 differences were statistically significant at the 10% level. The items reflecting statistically significant differences were used for generating the IPA map () presented and discussed further in Section 3.1.
3.2. Importance Performance Analysis (IPA) results and implications for management
To display ‘how visitor surveys may be used as a tool for supporting EIA follow-up at a conference centre in the iconic KNP’, we translated the results above into meaningful EIA follow-up information ‘to inform ongoing management’ and ‘to enhance efficacy and legitimacy of decision-making and impact assessment’ (Arts and Morrison-Saunders Citation2022, p. 1). As explained in more detail in the materials and methods section, this was done by plotting the importance means and performance gap for relevant items on an IPA map (). We included only the items where the t-tests were statistically significant, and where the performance ratings were lower than the importance ratings. Therefore, 29 items are displayed on the IPA map and colour coded accordingly.
As explained before, the IPA map consists of four quadrants: Quadrant 1 (Q1) ‘Possible overkill’; Quadrant 2 (Q2) ‘Low priority’; Quadrant 3 (Q3) ‘Keep up the good work’; and Quadrant 4 (Q4) ‘Concentrate here’. Being able to visually graph the mean importance and performance gap results within these quadrants enable managers [or persons undertaking EIA follow-up] to prioritise the allocation of resources accordingly (Boley et al. Citation2017). The sections below provide a detailed discussion of the IPA map results and the potential implications of the EIA follow-up information for the Conference Centre project’s ongoing management.
The results from the IPA in [being the translated perceptions of the visiting business tourist as a key stakeholder that can affect the Conference Centre’s profitability] shows that none of the EIA items fell in the ‘Possible overkill’ (Q1) quadrant. Quadrant 1 refers to items that were rated as neutral to important, but with a small gap between the importance and performance. Therefore, resources spent to address the performance gap would be wasted, i.e. a possible overkill. However, the perception by the respondents that no impact assessment item is a possible overkill corresponds to the finding of Sandham et al. (Citation2020, p. 7) who noted in their evaluation of selected EIA reports of SANParks ‘In the context of national parks, all impacts are potentially significant, making the identification and implementation of effective mitigation measures particularly important’.
Quadrant 2 included items that were rated as neutral to important, but with a large gap between the importance and performance ratings. Therefore, items that fell in this quadrant can be regarded as low priority in terms of resource allocation. Only two items fell in the ‘Low priority’ (Q2) quadrant, highlighted blue in , and are as follows: 37. Limiting the use of private transport to minimise environmental impact (M = 3,96 & I-P = 0,55); and 43. Opportunities are provided for tourists to interact with local people (M = 3,91 & I-P = 0,61). The findings on the targeted business tourists’ views correspond to the findings of Wessels and Douglas (Citation2022, p. 1490) who note ‘the motivation for visiting a national park would be to engage with nature and not necessarily with the local community’ [e.g. delegates are visiting to attend the conference] and that of Morrison-Saunders et al. (Citation2019, p. 289) who note ‘limiting the use of private transport may be perceived as limiting game viewing opportunities’.
Quadrant 3 includes items that were rated as important to very important but with a small gap between the importance and performance. Therefore, no management intervention is needed, and the organization should ‘keep up the good work’. The ‘keep up the good work’ (Q3) quadrant included 15 items highlighted in green in and discussed briefly in relation to the seven categories. One of the 10 items from the Visual and aesthetic category displayed in Q3: 4. Buildings respect the natural or cultural heritage surroundings (M = 4,18 & I-P = 0,18). Considering the results of respondents’ performance ratings also being higher than importance ratings for eight other items in this category (see items 1, 2, and 5–10), indicate that the visual and aesthetic impacts of the Conference Centre were effectively considered during design and are being managed effectively. Item 3 of this category [Design to promote energy efficiency and water conservation] is the anomaly and is discussed below under the ‘Concentrate here’ (Q4) quadrant results. Moreover, one of the six items from the Water and waste category: 16. Quality of water available for human consumption (M = 4,68 & I-P = 0,45) and three of the five items from Energy and air category: 19. Managing light pollution (M = 4,37 & I-P = 0,33); 20. Managing objectionable odours (M = 4,59 & I-P = 0,27); and 21. Managing noise levels (M = 4,53 & I-P = 0,21) displayed in Q3. Five of the seven items from Biodiversity and geology category: 23. Protection of biodiversity (M = 4,64 & I-P = 0,39); 24. Landscaped areas include only local indigenous species (M = 4,47 & I-P = 0,26); 26. Planting of indigenous vegetation and trees, rather than extensive lawns (M = 4,56 & I-P = 0,33); 27. Exotic plant management programme to regularly control the encroachment of alien invasive species (M = 4,41 & I-P = 0,25); and 28. Responsible use of chemical herbicides, pesticides, and fertilisers for grounds maintenance (M = 4,53 & I-P = 0,42). Three of the 10 items for the Access and traffic category: 32. Managing traffic volumes and congestion (M = 4,42 & I-P = 0,30); 39. Universal accessibility (M = 4,41 & I-P = 0,50); and 40. Promotional materials that are accurate and complete (M = 4,15 & I-P = 0,41). Two of the three items for the Local community category: 42. Employing the local community (M = 4,56 & I-P = 0,33); and 44. Access to products and services produced by local community (M = 4,05 & I-P = 0,50).
Lastly, and most importantly from an EIA follow-up and management point of view ‘to determine, and learn about the outcomes of IA of projects in order to inform ongoing management of that development’ (Arts and Morrison-Saunders Citation2022, p. 1), the IPA results of show that 12 items fell in the ‘Concentrate here’ (Q4) quadrant with an importance rating >4,00 and a performance gap >0,5. Therefore, the Conference Centre management should consider concentrating their resources here to address the perceived performance gaps within a future EIA follow-up program. These items are highlighted in orange in and discussed further in relation to the seven categories.
One of the 10 items from the Visual and aesthetic category: 3. Buildings have an ecologically responsible design to promote energy efficiency, water conservation, and climate control (M = 4,29 & I-P = 0,54). As this item closely relates to water and energy, the significance of the findings is discussed in the following two categories.
Five of the six items from the Water and waste category: 11. Effective waste management (M = 4,55 & I-P = 0,56); 12. Water conservation management (M = 4,51 & I-P = 0,71); 13. Effective rain and storm water management (M = 4,27 & I-P = 0,52); 14. Water recycling (M = 4,23 & I-P = 0,79); and 15. Waste recycling (M = 4,33 & I-P = 0,61). Interestingly, the results correspond with the findings of Sandham et al. (Citation2020) who highlighted weaknesses in terms of the description of waste and water-related aspects in EIAs for South African national parks and, importantly, the mitigation of these to align with international trends of promoting best practice in protected areas. Pope et al. (Citation2019) also found that water management [monitoring, consumption, and related goals] was not addressed adequately in the environmental management programmes of KNP projects they assessed. Moreover, the finding anomaly of item 3. Design to promote energy efficiency, water conservation, and climate control in the Visual and aesthetic category further indicates the need for management to concentrate on water and waste management. This corresponds to the findings of Morrison-Saunders et al. (Citation2019, p. 292) who found high expectations from KNP visitors in terms of waste and water management and recommended ‘greater leadership in terms of designing and managing infrastructure and services to enhance energy and water conservation and waste management and recycling measures to deliver more responsible outcomes’.
One of the five items from Energy and air category: 18. Using energy efficiently (M = 4,31 & I-P = 0,73). Efficient energy use through management mechanisms and maintenance of buildings to promote energy efficiency (see item 3 discussed above in the Visual and aesthetic category), is therefore, in the view of the respondents, an issue that management needs to concentrate on. These results correspond to the finding of Pope et al. (Citation2019) who found management measures for energy consumption lacking in EIAs conducted in the KNP. This also aligns with the recommendation of Morrison-Saunders et al. (Citation2019, p. 292) discussed above for ‘greater leadership in terms of designing and managing infrastructure and services to enhance energy and water conservation … ’.
One of the seven items from Biodiversity and geology category: 22. Erosion control (correct drainage; plant protection; restricting pedestrian traffic) (M = 4,58 & I-P = 0,69). This item is related to item 13. Effective rain and storm water management discussed above in the Water and waste category, and further highlights the need for improved water-related mitigation measures at the Conference Centre.
All three items from the Compliance, enforcement, and awareness category: 29. Sustainability education/awareness programmes for visitors (M = 4,32 & I-P = 0,57); 30. Interpretive information (M = 4,39 & I-P = 0,68), and 31. Enforcement of Park rules and regulations (M = 4,59 & I-P = 0,52). According to Craigie et al. (Citation2009), three of the five critical components of the ‘regulatory cycle’ are as follows: Compliance promotion [education and awareness]; Compliance monitoring; and Enforcement and are used by governments and others to encourage and compel the behavioural changes needed to achieve compliance on a regional and specific context (International Network for Environmental Compliance and Enforcement INECE Citation2009). The fact that all three items within this category fall within the ‘Concentrate here’ quadrant highlights the EIA follow-up challenge of capacity, resources, and allocation of responsibility for ensuring compliance to conditions within South Africa (Hill Citation2000; Feris Citation2006, Craigie et al., Citation2009; Wessels Citation2015).
One of the 10 items for the Access and traffic category: 41. Carrying capacity of Park should not be exceeded (M = 4,70 & I-P = 0,61). As mentioned before, respondents had the highest importance rating of all items for this item and considering the statistically significant performance gap explicitly asks for management to concentrate resources on this issue. Balancing socio-economic developments and environmental protection is a growing concern in PAs (Alberts et al. Citation2021) and KNP ‘had its rocky patches’ due to pressure on infrastructure developments since 1927 (SANParks South African National Parks Citation2013b, p. 4). Moreover, the concern of increased cumulative impacts on the natural systems of KNP as a result of the Conference Centre development [e.g. increase in visitors, traffic, demand for accommodation, increased use of natural resources such as water, energy, and waste management] was identified during the BA process in 2008 by the environmental assessment practitioners. Sandham et al. (Citation2020, p. 8) also note ‘Strategic context for national parks is critical to set cumulative limits and thresholds for consideration of significance in relation to, for example, expanding the number of beds, day visitors, vehicles and services infrastructure’. The IPA results from respondents, calls from practitioners, public, and researchers, re-iterate the need for management to concentrate on the cumulative impact of not exceeding the carrying capacity of the park.
4. Discussion on the use of visitor surveys and IPA as a tool to support EIA follow-up
Following the detailed results discussion, this section provides a discussion of the key learning on whether and how visitor surveys and the IPA method may be used as a tool to support EIA follow-up.
EIA follow-up, an essential component of an EIA process (International Association for Impact Assessment IAIA Citation1999), has evidently a poor track record (Sadler Citation1996; Dipper et al. Citation1998; Hill Citation2000; Wood Citation2003; Runhaar et al. Citation2013; Pinto et al. Citation2019) due to factors such as human-technical and resource capacity limitations of primary actors (Kolhoff et al. Citation2016) to design and implement formal monitoring programmes for ‘understanding the outcomes of projects of plans subject to impact assessment’ (Arts and Morrison-Saunders Citation2022). The strength of visitor surveys is that it is the most prevalent data collection technique used to engage with visitors (Slabbert and du Preez Citation2021) within protected and may ‘dovetail with existing planning, decision-making and project management activities’ (Morrison-Saunders and Arts Citation2012) of the KNP. Therefore, surveys might be used creatively to engage with any other communities and stakeholder ‘that has an interest in any given IA follow-up program’ (Morrison-Saunders et al. Citation2024, p. iv) as a first follow-up monitoring step for ‘collection of activity and environmental data relevant to project or plan performance determination’ (Arts and Morrison-Saunders Citation2022, p. 1). Relevant to the Conference Centre project in KNP, the visitor surveys aided in providing an inventory for management to concentrate their ongoing management efforts on ecologically responsible building; managing waste and water; using energy efficiently; ensuring compliance, enforcement, and awareness; and managing the increased cumulative impact of not exceeding the carrying capacity of the KNP.
Visitor survey data may also be used further to aid the other EIA follow-up key elements [Evaluation, Management, Engagement, Communication, and Governance (Pinto et al. Citation2019; Arts and Morrison-Saunders Citation2022)] if weaknesses are recognised, addressed, and basic methodological rules are applied. Considering weaknesses, visitor surveys alone are certainly not sufficient for conducting follow-up that meets all relevant international IA follow-up principles (Arts and Morrison-Saunders Citation2022; Morrison-Saunders et al. Citation2024). Moreover, visitor surveys are limited to the micro level (individual project activities) scale of EIA follow-up (Morrison-Saunders and Arts Citation2012), may only be targeting a selected group of stakeholders interested in an individual project, and may thus be excluding views of other local community members and stakeholders that can affect the project’s profitability (Moffat and Zhang Citation2014). Appropriate definition of the targeted population [or stakeholder] with a robust analysis method such as the IPA is needed to translate the targeted stakeholder’s views into meaningful EIA follow-up information.
Using visitor surveys and the IPA method as a tool for supporting EIA follow-up provides many opportunities such as further research and exploration of the method in other contexts and/or with other stakeholder groups.
5. Conclusions
The paper explored if and how visitor surveys may be used as a tool for supporting EIA follow-up within protected areas at a conference centre in the iconic KNP and used quantitative and exploratory research methods. We close the paper with key learning and conclusions.
First, EIA follow-up is an essential component of an EIA process of a project or plan but has a poor international track record due to factors such as capacity limitations of primary actors, with recent calls for more effective communication and participation with interested stakeholders. Visitor surveys, a commonly used method to engage with stakeholders in protected areas, may dovetail with existing decision-making and project management activities to support EIA follow-up monitoring in protected areas such as the KNP.
Second, if visitor surveys are to be used as a tool to aid EIA follow-up, then the tool’s weaknesses should be recognised, addressed, and basic methodological rules be applied. Importantly, an appropriate definition of the targeted population is needed to indicate which stakeholders are included in the survey. Moreover, questions for measuring importance expectations and performance perceptions must be derived from valid sources of the EIA process of the project or plan. Thus, the EIA process’ documentation should ideally be freely available for appraising the IA outcome expectations. Sourcing EIA documentation for developments within KNP proved to be a challenge and significant resources were allocated to source the hard-copy documentation. Furthermore, tangible items and related questions should be developed for the survey from EIA documentation of suitably perceptible projects. Therefore, the performance expectations created in the EIA process and used in the survey should be tangible enough for respondents to rate in terms of importance expectations and performance perceptions. Care should also be taken to use accessible and non-technical EIA language to increase the response rate.
Third, a robust data analysis method should be used to translate visitor survey results into meaningful EIA follow-up information for concentrating ongoing management practices on important performance outcomes for effective follow-up. We found the IPA method, commonly used in tourism research, particularly useful within the protected areas context to reveal perceived performance gaps. The IPA method applied for this research highlighted, for example, that within a protected areas context, all impacts should be treated as potentially significant, and no effective mitigation measure should be viewed as a possible overkill. Moreover, weaknesses in terms of the description of waste, water, and energy use related aspects in EIAs, and greater leadership related to these items were highlighted by the IPA method, which correspond to previous research. The IPA results from the visitor survey importantly restated the calls from EIA practitioners, the public, and researchers interested in the development, for management to concentrate on the cumulative impact of not exceeding the carrying capacity of the park.
In essence, the key message of this paper is that visitor surveys may be used as a simple but effective tool for supporting EIA follow-up, if basic methodological rules are applied in the definition of the targeted population and survey development, and if a robust analysis method, such as the IPA, is used to translate survey results into meaningful EIA follow-up information.
Ethics declarations
Ethical approval for undertaking the research was obtained from the University of Pretoria, Faculty of Economic and Management Sciences Ethics Committee (protocol no. EMS014/17) and the University of South Africa, College of Agricultural and Environmental Sciences’ Health Research Ethics committee (approval no. 2019/CAES/024). The research was also conducted under the consent and approval of Tourism Development and Marketing Division of South African National Parks. All the
participants in the study took part voluntarily after they were informed of the objectives of the study and the completion of an informed consent agreement. All participants were entitled to withdraw from the study at any point. The completed surveys were also completed anonymously and confidentially.
Acknowledgments
The authors would like to thank the Tourism Development and Marketing Division of South African National Parks for their support of the project. We would particularly like to thank Angus Morrison-Saunders, Jenny Pope, and Mike Hughes for their efforts in the initial development and piloting of the survey scale as part of the larger project aimed at understanding sustainable tourism development and responsible tourism practices in SANParks.
Disclosure statement
No potential conflict of interest was reported by the author(s).
Additional information
Funding
References
- Aggarwal P, Agarwala T. 2022. Relationship of green human resource management with environmental performance: mediating effect of green organizational culture. Benchmarking: Int J. 30(7):2351–2376. doi: 10.1108/BIJ-08-2021-0474.
- Alberts RC, Retief FP, Roos C, Cilliers DC, Hauptfleisch M. 2021. Environmental Impact Assessment (EIA) effectiveness in protected areas. Impact Assess Proj Apprais. 38(5):358–367. doi: 10.1080/14615517.2020.1734403.
- Arts J, Caldwell P, Morrison-Saunders A. 2001. Environmental impact assessment follow-up: good practice and future directions — findings from a workshop at the IAIA 2000 conference. Impact Assess Proj Apprais. 19(3):175–185. doi: 10.3152/147154601781767014.
- Arts J, Morrison-Saunders A. 2022. Impact assessment follow-up: international best practice principles. Special Publication Series No. 6. Fargo (USA): International Association of Impact Assessment; [accessed 14 Nov 2023]. https://www.iaia.org/uploads/pdf/SP6_22%20Follow%20up_converted.pdf.
- Bice S, Moffat K. 2014. Social licence to operate and impact assessment. Impact Assess Proj Apprais. 32(4):257–262. doi: 10.1080/14615517.2014.950122.
- Boley BB, McGehee NG, Hammett ALT. 2017. Importance-performance analysis (IPA) of sustainable tourism initiatives: The resident perspective. Tourism Manage. 58(2017):66–77. doi: 10.1016/j.tourman.2016.10.002.
- Boutilier RG. 2014. Frequently asked questions about the social licence to operate. Impact Assess Proj Apprais. 32(4):263–272. doi: 10.1080/14615517.2014.941141.
- Cooper D, Schindler P. 2011. Business research methods. 11th ed. Boston: McGraw-Hill.
- Craigie F, Snijman P, Fourie M. 2009. Dissecting environmental compliance and enforcement. In: Paterson A Kotzé L, eds. Environmental compliance and enforcement in South Africa – legal perspectives. Cape Town: JUTA Law; p. 65–102.
- Dare ML, Schirmer J, Vanclay F. 2014. Community engagement and social licence to operate. Impact Assess Proj Apprais. 32(3):188–197. doi: 10.1080/14615517.2014.927108.
- Dipper B, Jones C, Wood C. 1998. Monitoring and post-auditing in Environmental Impact Assessment: A Review. J Environ Plann Manage. 41(6):731–747. doi: 10.1080/09640569811399.
- Duarte CG, Dibo APA, Siqueira-Gay J, Sánchez LE. 2017. Practitioners’ perceptions of the Brazilian environmental impact assessment system: results from a survey. Impact Assess Proj Apprais. 35(4):293–309. doi: 10.1080/14615517.2017.1322813.
- Feris L. 2006. Compliance notices – a new tool in environmental enforcement. Potch Electronic Journal. 9(3):53–70. doi: 10.17159/1727-3781/2006/v9i3a2824.
- Goodwin M. 2004. Constructing and interpreting qualitative data. In: Bond A, editor. Writing your master’s thesis: how to plan, draft, develop and publish your thesis. Somerset: Studymates Ltd; p. 21–34.
- Hill RC. 2000. Integrated environmental management systems in the implementation of projects. S Afr J Sci. 96:50–54.
- Homes of Africa. n.d. Some interesting facts of the Kruger Park. [accessed 9 Apr 2024]. https://homesofafrica.com/krugerpark/facts/.
- International Association for Impact Assessment [IAIA]. 1999. Principles of environmental impact assessment best practise. [accessed 20 Febr 2022]. https://www.iaia.org/uploads/pdf/principlesEA_1.pdf.
- International Network for Environmental Compliance and Enforcement [INECE]. 2009. Principles of environmental enforcement handbook. National Service Centre for Environmental Publications (NSCEP); [accessed 8 Dec 2021]. https://nepis.epa.gov/Exe/ZyPDF.cgi/P1005AO9.PDF?Dockey=P1005AO9.PDF, 2.
- Kolhoff AJ, Runhaar HAC, Gugushvili T, Sonderegger G, Van der Leest B, Driessen PPJ. 2016. The influence of actor capacities on EIA system performance in low and middle income countries – cases from Georgia and Ghana. Environmental Impact Assessment Review. 57:167–177. doi: 10.1016/j.eiar.2015.11.011.
- Lee YC, Yen TM, Tsai C-H. 2008. Modify IPA for quality improvement: Taguchi’s signal-to-noise ration approach. Tqm J. 20(5):488–501. doi: 10.1108/17542730810898458.
- Liu Y, Luo X, Fu W. 2022. Does China’s real-name system improve or reduce residents’ willingness to participate in environmental impact assessments? Impact Assess Proj Apprais. 40(5):411–422. doi: 10.1080/14615517.2022.2102881.
- Macintosh A. 2010. The Australian Government’s Environmental Impact Assessment (EIA) regime: using surveys to identify proponent views on cost- effectiveness. Impact Assess Proj Apprais. 28(3):175–188. doi: 10.3152/146155110X12772982841168.
- Martinez C, Franks DM. 2014. Does mining company-sponsored community development influence social licence to operate? Evidence from private and state-owned companies in Chile. Impact Assess Proj Apprais. 32(4):294–303. doi: 10.1080/14615517.2014.929783.
- Moffat K, Zhang A. 2014. The paths to social licence to operate: an integrative model explaining community acceptance of mining. Resour Policy. 39:61–70. doi: 10.1016/j.resourpol.2013.11.003.
- Morrison-Saunders and Arts. 2012. Assessing impact: handbook of EIA and SEA follow-up. London and New York: Routledge.
- Morrison-Saunders A, Arts J. 2004. Assessing impact: handbook of EIA and SEA follow-up. London [(UK)]: Earthscan.
- Morrison-Saunders A, Arts J, et al. 2024. Guidance for implementing the impact assessment follow-up international best practice principles. Reference and guidance documents. Fargo (USA): International Association for Impact Assessment; [accessed 15 Apr 2024]. https://www.iaia.org/uploads/pdf/Guidance%20for%20Followup%20Best%20Practice%20Principles.pdf.
- Morrison-Saunders A, Arts J, Bond A, Pope J, Retief F. 2021. Reflecting on, and revising, international best practice principles for EIA follow-up. Environmental Impact Assessment Review. 89(2021):106596. doi: 10.1016/j.eiar.2021.106596.
- Morrison-Saunders A, Arts J, Pope J, Bond A, Retief F. 2023. Distilling best practice principles for public participation in impact assessment follow-up. Impact Assess Proj Apprais. 41(1):48–58. doi: 10.1080/14615517.2022.2119527.
- Morrison-Saunders A, Baker J, Arts J. 2003. Lessons from practice: towards successful follow-up. Impact Assess Proj Apprais. 20(1):43–56. doi: 10.3152/147154603781766527.
- Morrison-Saunders A, Hughes M, Pope J, Douglas A, Wessels JA. 2019. Understanding visitor expectations for responsible tourism in an iconic national park: differences between local and international visitors. J Ecotourism. 18(3):284–294. doi: 10.1080/14724049.2019.1567740.
- Morrison-Saunders A, Sadler B. 2010. The art and science of impact assessment: results of a survey of IAIA members. Impact Assess Proj Apprais. 28(1):77–82. doi: 10.3152/146155110X488835.
- Parsons R, Moffat K. 2014. Integrating impact and relational dimensions of social licence and social impact assessment. Impact Assess Proj Apprais. 32(4):273–282. doi: 10.1080/14615517.2014.936107.
- Pinto E, Morrison-Saunders A, Bond A, Pope J, Retief F. 2019. Distilling and applying criteria for best practice EIA follow-up. J Environ Assess Policy Manage. 21(2):1950008–1–32. doi: 10.1142/S146433321950008X.
- Pope J, Wessels JA, Douglas A, Hughes M, Morrison-Saunders A. 2019. The potential contribution of environmental impact assessment (EIA) to responsible tourism: The case of the Kruger National Park. Tour Manag Perspect. 32:100557. doi: 10.1016/j.tmp.2019.100557.
- Reinikainen J, Tolonen H, Borodulin K, Härkänen T, Jousilahti P, Karvanen J, Koskinen S, Kuulasmaa K, Männistö S, Rissanen H, et al. 2018. Participation rates by educational levels have diverged during 25 years in Finnish health examination surveys. Eur J Public Health. 28(2):237–243. doi: 10.1093/eurpub/ckx151.
- Republic of South Africa [RSA]. 1998 Nov 27. National environmental management act, 1998 (Act 107 of 1998). (Government Notice 1540). Government Gazette 19519.
- Republic of South Africa [RSA]. 2014 Dec 4. Environmental impact assessment regulations, 2014. (Government Notice 982). Government Gazette 38282.
- RSA (Republic of South Africa). 2017. Amendment to environmental impact assessment regulations, 2014 and listing notices 1, 2 and 3 of 2014. (Proclamation no. R1030.) Government Gazette, 40772. 7 Apr 2017.
- Ruckstuhl K, Thompson-Fawcett M, Rae H. 2014. Māori and mining: Indigenous perspectives on reconceptualising and contextualising the social licence to operate. Impact Assess Proj Apprais. 32(4):304–314. doi: 10.1080/14615517.2014.929782.
- Runhaar H, van Laerhoven F, Driessen P, Arts J. 2013. Environmental assessment in the Netherlands: effectively governing environmental protection? A discourse analysis. Environmental Impact Assessment Review. 39:13–25. doi: 10.1016/j.eiar.2012.05.003.
- Sadler B. 1996. International study on effectiveness of environmental assessment: final report —environmental assessment in a changing world: Evaluating practice to improve performance. [accessed 19 Febr 2022]. https://unece.org/DAM/env/eia/documents/StudyEffectivenessEA.pdf.
- Sandham L, Huysamen C, Retief FP, Morrison-Saunders A, Bond AJ, Pope J, Alberts RC. 2020. Evaluating environmental impact assessment report quality in South African national parks. KOEDOE - African Protected Area Conserv Sci. 62(1):1–9. doi: 10.4102/koedoe.v62i1.1631.
- Silverman D. 2005. Doing qualitative research. London: Sage.
- Slabbert L, du Preez EA. 2021. Where did all the visitor research go? A systematic review of application areas in national parks. J Hosp Tour Manag. 49:12–24. doi: 10.1016/j.jhtm.2021.08.015.
- South African Bureau of Standards [SABS]. 2016. SANS 1162: 2016. South African national standard: responsible tourism — requirements. Edition 1.1. ISBN 978-0-626-33759-9.
- South African National Parks [SANParks. 2013a. Media release: kNP rangers get pampered for their hard work. Archived News; [12 12 2013. [accessed 20 Febr 2022]. https://www.sanparks.org/parks/kruger/news.php?id=55964%3FPHPSESSID=k3firacp64d7d4t07i11taghi1.
- South African National Parks [SANParks]. 2013b. Responsible tourism in SANParks – the journey to 2022. Pretoria: South African National Parks; [accessed 18 Aug 2021]. http://cdn.bdlive.co.za/images/pdf/SanParks_tourism.pdf.
- Spitzer S. 2020. Biases in health expectancies due to educational differences in survey participation of older Europeans: It’s worth weighting for. Eur J Health Econ. 21(4):573–605. doi: 10.1007/s10198-019-01152-0.
- Tong S. 2001. An integrated exploratory approach to examining the relationships of environmental stressors and fish responses. J Aquat Ecosyst Stress Recovery. 9(1):1–19. doi: 10.1023/A:1013184311165.
- Wessels JA. 2015. Understanding independent environmental control officers: learning from major South African construction projects [ thesis—PhD]. Potchefstroom: North-West University.
- Wessels JA, Douglas A. 2022. Exploring creative tourism potential in protected areas: The Kruger National Park case. J Hosp Tour Res. 46(8):1482–1499. doi: 10.1177/1096348020983532.
- Wood C. 1999. Pastiche or Postiche? Environmental Impact Assessment in South Africa. S Afr Geogr J. 81(1):52–59. doi: 10.1080/03736245.1999.9713661.
- Wood C. 2003. Environmental impact assessment: a comparative review. 2nd ed. Harlow: Pearsons Education.
- Zvijáková L, Zeleňáková M, Purcz P. 2014. Evaluation of environmental impact assessment effectiveness in Slovakia. Impact Assess Proj Apprais. 32(2):150–161. doi: 10.1080/14615517.2014.893124.