
ABSTRACT
Second-home tourism is a very popular form of tourism in many countries, particularly in the Nordic countries. More than half of the Swedish population have access to second homes. Previous studies have revealed that there is great variation between different second homes. Examples range from rustic Australian shacks, lonely cabins in the Norwegian mountains, spacious Swedish archipelago villas and palatial Russian dachas. Still, second homes are often seen and analysed as a unitary category – a perspective that obscures the considerable heterogeneity within the category as well as spatial differences in the impact of second-home tourism. Using a second-home typology from previous research and data on about 660,000 second homes, we analyse the heterogeneity of second homes by mapping the composition of the Swedish second-home stock. Results show the uneven geography of second-home tourism, revealing significant and sometimes steep differences between peripheral areas and urban hinterlands, tourism hot-spots, and areas in decline. Based on these results, we assert that there is good cause to move away from using second homes as a unitary category. Instead, we argue for viewing second homes as an umbrella concept with dwelling use in focus. This enables a greater sensibility to place and more accurate analyses of the uneven impacts of second-home tourism. The results also give greater insights into the impact of the ‘invisible population’ of second-home owners from a public planning perspective.
摘要
第二住宅旅游是很多国家尤其北欧国家非常时尚的旅游方式。瑞典有超过一半的人使用第二住宅。以往研究显示不同第二住宅有很大的差异, 从澳大利亚乡村棚屋、挪威山区孤独的小房子到瑞典宽敞的岛屿别墅和俄罗斯富丽堂,皇的别墅。但是, 第二住宅仍旧经常按照单一的类别看待与分析, 这个视角模糊了这一种类内部巨大的多样性和第二住宅旅游影响的空间差异。我们运用穆勒、霍尔和金 (Müller, Hall, and Keen (2004)) 提出的第二住宅分类方法和660000份第二住宅数据, 把瑞典第二住宅的结构绘制在地图上, 分析了其多样性。结果显示出第二住宅不平衡的地理分布, 揭示出边缘地区、城市腹地、旅游景区和衰落地区明显甚至是尖锐的差异。基于这些结果, 我们断言这是一个放弃对第二住宅单一分类的好理由。相反, 我们主张应该从居住用途上把第二住宅看作一个涵盖不同种类住宅的“伞”。这使得我们可以更敏感更精确地分析第二住宅旅游的不平衡的影响。本结果也提出从公共规划的角度注意第二住宅户主中“非可见人口”的影响。
Introduction
In a mobile world of work, flight, leisure and tourism, second-home tourism is located at the intersection of temporary mobility and migration (Bell & Ward, Citation2000; Müller & Hall, Citation2003). Although engaging in a form of temporary mobility, second-home tourists can spend days, weeks or even months at their cottages every year. For example, a survey among Swedish second-home owners showed them spending an average of 71 nights at, and making 22 one-day visits to, their second homes per year (Müller, Nordin, & Marjavaara, Citation2010). But administrative systems such as census records regularly fail to acknowledge this mobility. Instead people are seen as immobile, living at the place where they are registered as residents.
Taxes and funds for the provision of public services, such as sewerage, infrastructure or social services, are often based on censuses that record people as living in one place only (Paris, Citation2011). This creates a situation of a potential public planning mismatch, wherein an – in the administrative sense – invisible population of second-home owners demands public services that have been dimensioned in accordance with census records instead of the actual number of people using them (Adamiak, Pitkänen, & Lehtonen, Citation2016; Müller & Hall, Citation2003; Paris, Citation2011). Of course, the effect of this mismatch may vary. In some places, the consequences of this invisible population might be marginal or balanced by other forms of temporary mobility (such as labour migrants), but in other places the effects can potentially be quite significant. Studies in Finland and Sweden show that the population distribution can deviate considerably from official records if the temporary population of second-home tourists is taken into account (Adamiak et al., Citation2016; Müller, Citation2005).
Although this article focuses on Sweden, second homes are rather common in many countries, other Nordic countries, the United Kingdom, France, Germany, the Czech Republic, South Africa, Canada, the United States, and Australia (Adamiak et al., Citation2015; Blondy, Plumejeaud, Vacher, & Didier, Citation2014; Dijst, Lanzendorf, Barendregt, & Smit, Citation2005; Gallent, Citation2013; Haldrup, Citation2004; Hall & Mu¨ller, Citation2004b; Müller & Hoogendoorn, Citation2013; Pitkänen, Citation2008; Rinne, Paloniemi, Tuulentie, & Kietäväinen, Citation2014; Vagner, Mu¨ller, & Fialová, Citation2011; Visser, Citation2003). In the case of Sweden, with about 660,000 second homes, a full 54.2% of the population own or have access to a second home through relatives and friends, making it a widespread phenomenon (ASTRID, Citation2015; Statistics Sweden, Citation2014a, Citation2014b). If considered in conjunction with the data above on the number of nights spent each year at second homes, the invisible population of second-home owners in Sweden is rather sizeable. Since the lion's share of public planning is handled at the municipal level in Sweden, this also means that the impact of second-home tourism is managed locally.
How then to investigate the impact of the invisible population of second-home owners? One way of doing this is to study the second homes themselves. Second homes can vary wildly in size, style and setting between different localities (Hall & Mu¨ller, Citation2004b; Roca, Citation2013). This variation is also connected to such factors as for example the social class, human capital and use patterns of the second-home owners (Hall & Müller, Citation2004a; Halseth, Citation2004; Müller, Citation2005; Paris, Citation2011; Robertsson & Marjavaara, Citation2014; Svenson, Citation2004). Understanding this heterogeneity is therefore key for studying the impacts from second-home tourism and the invisible population of second home owners. However, according to Müller et al. (Citation2004), the variation among second homes has not been sufficiently explored in previous research, where second homes are generally treated as a category of more or less similar units. Müller et al. (Citation2004, p. 16) state that a ‘major factor influencing the impact on rural change that has not been sufficiently discussed in previous studies of second homes is the composition of the second home stock’, and present a theoretical model of different second-home types.
In the following, we will pick up their thrown gauntlet and engage with the model. The aim is to analyse the heterogeneous geography of second homes by mapping the composition of the Swedish second-home stock in accordance with the model's typology. By doing this, we aim to empirically investigate the applicability of the model. At this point two questions arise, the first being ‘why Sweden?’ and the second simply ‘why?’. The answer to the first question is short and straightforward: in the case of Sweden, comprehensive public data containing all second homes and their owners can be accessed, making it possible to analyse the complete recorded second-home stock of an entire country. Since many studies of second homes suffer from lack of reliable or broad data, this puts Sweden in a unique position. Here, we will use data on roughly 660,000 second homes and their owners.
The second question takes a bit more elaboration in order arrive at a satisfactory answer. To begin with, this is – to our knowledge – the first attempt to apply the model by Müller et al. (Citation2004) and describe the geography of its classification of second homes. If the composition of the second-home stock is indeed a ‘major factor influencing the impact on rural change’, an exploration of this matter would contribute to a fuller understanding of said rural change and the geography of impacts connected to second-home tourism that local planning authorities have to deal with (Müller et al., Citation2004, p. 16). By mapping and acknowledging the distribution of Sweden's second-home landscapes, we aspire to make a contribution to the planning process concerning second-home tourism in general.
Theoretical framework
The focus here is to analyse the heterogeneous geography of second homes. However, what is the scale of heterogeneity in this category? What exactly are second homes? Examinations of second homes show that the variation can be huge, both within and between countries. Examples in Hall and Müller's Tourism, Mobility and Second Homes (Citation2004b) range from rustic Australian shacks to the cottages of Canada's privileged, from second homes situated within bicycle distance from their owners’ homes, to Spanish and South African holiday homes owned by people in neighbouring countries or continents. The chapters in Roca's Second Home Tourism in Europe (Citation2013) speak of cabins in the Norwegian mountains, small second-home complexes in the Greek isles, spacious Swedish archipelago villas, and Russian palace dachas. Indeed, second-home tourism is not even a phenomenon restricted to rural areas, but also includes caravanning or places that could qualify as the spitting image of the urban, such as central London or New York (Hall, Citation2014; Paris, Citation2011).
In the introduction to Coppock's Second Homes: Curse or Blessing? (Citation1977), a second home is defined as a ‘property owned or rented on a long lease as the occasional residence of a household that usually lives elsewhere’ (Coppock, Citation1977, p. 3). Others use the same definition or similar ones (Barnett, Citation2014; Dijst et al., Citation2005; Shucksmith, Citation1983; Visser, Citation2003; Winkler, Deller, & Marcouiller, Citation2015). Acknowledging that such an inclusive definition can hold quite a wide range of different types of second homes and second-home landscapes, Coppock briefly discusses characteristics of second homes (purpose-built and converted), their shifting style, and their uneven distribution.
Paris (Citation2014, p. 6) offers a similar argument in his critical commentary on second homes, stating that they are ‘a form of dwelling use’, ‘not a class of dwellings’. What makes them second homes is therefore not a trait connected to the building type, but rather their use as second homes. Expanding on this line of argument, if a second home is not a building category but rather a type of dwelling use, then it is necessary to consider that the dwelling is situated in a place and that its use is the result of a user. Places and users differ, and will affect the particulars of any single second home (Hiltunen, Pitkänen, Väpsäläinen, & Hall, Citation2013). Seen this way, second homes do not comprise a homogenous building category but rather an assemblage of dwellings with the common denominator of being used as second homes. Hence, second homes can and do differ. Depending on the circumstances, they will entail different possibilities and difficulties for local communities and authorities (Gallent, Citation2013; Halfacree, Citation2012; Hall & Mu¨ller, Citation2004a). Still, they are often grouped together and handled under the unitary category of second homes.
As mentioned above, the paper draws upon the theoretical model presented by Müller et al. (Citation2004), in which the category of second homes is broken up into four different types along two axes (). The first axis distinguishes between weekend and vacation second homes, depending on frequency of usage as a function of distance to the user's primary home. Hence, ‘weekend’ and ‘vacation’ are not labels that denote whether people actually visit their second homes during weekends or vacations, but rather labels for two different theoretical frequencies of usage; in the model, ‘weekend’ should be read as ‘often’, while ‘vacation’ signifies ‘seldom’. Simply put, are located close to their owners’ primary residences and can therefore be used often, while vacation homes are located far away and can be used more seldom. The second axis distinguishes between converted and purpose-built second homes, depending on whether the house was converted from a previous primary residence or built from scratch with the purpose of being a second home. This axis is based on the assumption that purpose-built second homes are more likely to be located in attractive areas for second-home tourism, presumably because anyone investing in building a second home would most likely be looking to get as much out of this investment as possible. The model therefore assumes that areas with a high number of purpose-built second homes are more attractive than those dominated by converted second homes.
Figure 1. Model of second-home types, adapted and modified with quotations from Müller, Hall, and Keen (Citation2004, p. 16).
The result of this division is four different second-home types: (1) converted second homes at weekend distance from their owner; (2) converted second homes at vacation distance; (3) purpose-built second homes at weekend distance and finally (4) purpose-built second homes at vacation distance. In the following text, these types will be called converted weekend, converted vacation, purpose-built weekend and purpose-built vacation. These types will be used to map second-home landscapes, meaning geographical areas dominated by one of the four different second-home types. To clarify, this is not to say that each second-home landscape contain only one type of second home, but rather that the conditions in each landscape are such that one of the second-home types prevails.
Method
Selection of data
The paper is based on statistical data from the database ASTRID at Umeå University, containing information from the national statistical agency Statistics Sweden (SCB) on all properties in Sweden and their owners. We use the same definition of second homes as Statistics Sweden, meaning that four different types of properties without registered permanent inhabitants are grouped together as second homes: (1) properties registered with the tax authorities as second homes; (2) properties with simple farm houses; (3) properties with small detached houses and (4) properties with small detached houses and an assessed property value of less than SEK 50,000 (roughly €5500). These four types have been derived from the Swedish Tax Agency's classification of properties. The reason for using this definition is twofold: first, to enable easier comparison to other studies and official records; and second, to reduce the likelihood of including properties not used as second homes. In total, this gives us a stock of about 660,000 second homes. The vast majority of cases are of the first category, namely properties registered with the tax authorities as second homes by their owners.
It should be noted that the 660,000 buildings analysed in this article are not all second homes in Sweden. In addition, there are also roughly 50,000 second homes in Sweden owned by people living elsewhere. Most of these are Swedes living abroad, but many are also Danes, Norwegians, Germans or Dutch (Statistics Sweden, Citation2014b). Their share of the total second-home stock is largest in the three southern counties of Jönköping, Värmland and Kronoberg, with 15%, 23.6% and 40.3%, respectively. But although foreign-owned second homes are common in many parts of Sweden – in some municipalities they even outnumber those that are domestically owned – these second homes are disregarded in the paper. This is simply because the same amount of comprehensive data for foreign-owned second homes is not available, for example on the exact location of the owners’ permanent residences.
A further problem with defining second homes as detached houses is that this ignores the fact that flats and caravans can also be used as second homes (Hall, Citation2014; Paris, Citation2011). Although it would be interesting to include these in the study, they cannot be singled out in public data in the same way as detached houses can. In the case of flats, this means that second homes in dense urban areas are excluded from the article, as well as flats used as second homes in tourist resorts. However, flat development in tourist resorts is to be considered as a marginal phenomenon in Sweden, most likely dwarfed by the magnitude of detached second homes. However, due to lack of comprehensive data this remains to be proven. As for caravans, their movability makes them hard to place in a landscape and context in the same way as a building.
As in other cases involving the people's mobility, it is difficult to be completely certain of the facts on the ground. A common problem when dealing with data on second homes is tax policies that offer people incentives to register themselves as inhabitants at a certain place while living permanently at another, for example as a way to pay lower property or income taxes (Paris, Citation2011). This problem could potentially exist in our data, since most of properties in the data-set are houses that the owners themselves have reported to the tax authorities as second homes. However, it is very probable that the properties in the vast majority of these cases are in fact used as second homes and not as primary residences under the radar of the tax authorities.
How can we be sure of this? First, in 2008 property taxes paid to the state were replaced with an annual property fee, which is paid to the municipality where the property is located. This fee is 0.75% of the property value, up to a maximum amount. In 2012, the maximum property fee was about €720 (Swedish Tax Agency, Citation2015). Since the fee is relatively low even for people with highly valued properties, it is deemed an unlikely ground for causing people to report false information to the tax authorities. The data used here include information on assessed property values from 1997 and 2012. In 1997, the property tax still existed, but the number of second homes was very similar to that in 2012 (ASTRID, Citation2015). Any difference in taxation between these two years does not seem to have caused any major changes with regard to whether properties have been registered with the tax authorities as second homes.
Second, income taxes are paid primarily to the municipality where the taxpayers are registered residents, meaning that this could be a potential source of data error if taxes varied enough between different municipalities to cause incentives for tax evasion. Such situations are known to cause tax evasion connected to second homes (Paris, Citation2011). This risk is deemed to be marginal, since municipal income taxes do not vary much in Sweden; most are around 31%–33% (Statistics Sweden, Citation2015). Rural areas typically have higher taxes than urban areas, meaning that the taxes would usually incentivise second-home owners away from registering themselves at their rural second homes while living at their urban primary residences. Furthermore, people in higher income brackets, who could stand to gain the most from registering in a municipality with lower taxes, would still have to pay their state income tax (paid for yearly earnings above roughly €45,000) no matter where they were registered residents (Swedish Tax Agency, Citation2016). In this case, the tax policies therefore generally work in favour of our data.
Connecting the selection of data back to Coppock (Citation1977), Hall and Müller (Citation2004a) and especially Paris's (Citation2014) definition of second homes resting on dwelling use, it is unfortunate that urban flats or caravans that may be used as second homes are not included in the data. In the same vein, properties with simple farm houses, properties with small detached houses, and properties with small detached houses and a property value of less than SEK 50,000 – all without registered inhabitants – are here assumed to be second homes. This form of categorisation goes against definitions focusing on dwelling use rather than certain types of buildings. On the other hand, the vast majority of cases in the data are buildings that the owners themselves have reported to the tax authorities as second homes, meaning that these houses can indeed be said to be second homes based on their use. Summing up, our definition and selection of data form a compromise based on dwelling use, but within constraints.
Transforming the model into workable variables
The model of Müller et al. (Citation2004) has two axes that need to be operationalised: (1) frequency of usage as a function of distance, and (2) the attractiveness of the areas where the second homes are located. Beginning with the first axis, it is here represented by the straight-line distance between the owners’ primary residences and their second homes. These data are readily available in ASTRID, with the exact coordinates of both the second homes and the owners’ permanent residences down to within 100 metres. Due to pure distance decay, second homes close to their owners are assumed to be weekend homes, while those located farther away are assumed to be vacation homes (Jansson & Müller, Citation2003; Marjavaara & Müller, Citation2007; Müller et al., Citation2004).
The second axis concerns the attractiveness of the areas where the second homes are located. Obviously, there is no direct measurement that can be applied here concerning how attractive the landscape of Sweden is for second-home tourism. Therefore, a combination of five variables that can be related to attractiveness are used as proxy variables. These variables are: the age of the buildings; the density of second homes; the change in property values during the 15-year period 1997–2012; second homes’ share of the total number of detached houses and the change in number of second homes during 1997–2012.
Newer second homes are more likely to have been built for this purpose, so it is reasonable to assume that there is a link between building age and whether the second homes have been converted or purpose-built (Persson, Citation2011). As for the density of second homes, attractive areas for second-home tourism are assumed to have denser concentrations of second homes than the opposite areas (Marjavaara & Müller, Citation2007). Changes in property values can also be said to reflect an area's desirability. Urban areas can certainly be expected to show a more substantial increase in assessed property values than rural areas because of greater demand, but it is also presumed that tourism hot-spots and amenity-rich areas in the countryside will show a greater increase than surrounding areas. Therefore, increases in assessed property values are used to indicate high attractiveness, whereas stagnation or decreasing values point to low attractiveness (Marjavaara, Citation2007; Marjavaara & Müller, Citation2007). The years 1997 and 2012 have been chosen in order to get a sufficiently long period for comparison and reasonably recent data.
The last two variables measure similar things, but together provide more fine-tuned information. Measurements of second homes’ share of the total number of detached houses can be used to find hot-spots, but also to find rural areas where second homes are more common than primary residences (Marjavaara & Müller, Citation2007). By also looking at the change in the number of second homes during the period of 1997–2012, we can find areas that are growing as second-home tourism destinations. At the same time, however, the variable accounts for urban hinterlands, where the number of second homes is shrinking because they are being converted into primary residences (Marjavaara & Müller, Citation2007; Müller et al., Citation2004).
To summarise, the distance axis in the model (weekend – vacation) is operationalised using information on the straight-line distance between these points. Short distances means higher likelihood of weekend second homes, while long distances implies vacation second homes. The attractiveness axis (converted – purpose-built) is operationalised using a combination of five proxy variables (see below). Less attractive areas are assumed to have mainly converted second homes, whereas more attractive areas are dominated by purpose-built second homes (Marjavaara, Citation2007; Marjavaara & Müller, Citation2007; Müller et al., Citation2004; Persson, Citation2011).
Table 1. Summary of variables, values and groups.
Using and combining the variables
lists all six variables along with the minimum, maximum and median values for each variable. All variables were dichotomised into two groups, and the values for each variable in the groups are also presented in the table. The variables were operationalised using GIS raster analysis and neighbourhood statistics. This analysis tool creates a cell-based raster whereby every cell is given a value according to, for example, the mean value of all points within a given radius of a point on the map. In this case, the points were individual second homes. The mean value for each variable was checked within a radius of 5 km for every second home in the data-set. Sweden was then divided into cells of 1 km2 and each cell given a value corresponding to the mean values from the previous operation. Since the model () operates on simple dichotomies we chose to use the same reasoning when working with the variables, thus using median values to divide all 1 km2 cells of each variable into ‘more’ and ‘less’ dichotomies. So, for example, using the median value all second homes would be divided into a ‘new’ or ‘old’ group in the case of the age of the buildings. All 1 km2 cells would then be placed into the ‘new’ or ‘old’ group depending on the value of each cell.
The obvious advantage of this method of operationalisation is its consistency and coherence to the simple axis layout of the model by Müller et al. (Citation2004). This is also a drawback, however, since the median values used might run counter to what we know about the Swedish second-home stock from previous research - for example, that many were purpose-built during the 20-year period between 1960 and 1980 (Persson, Citation2011). Another way of using the variables could, then, have been to create categories using values based on previous research instead of median values. For example, instead of using a median, all second homes built in or after 1960 could have been labelled ‘new’ (purpose-built), while those built in 1959 or before as ‘old’ (converted). On the other hand, such categorisations would risk becoming unreliable and arbitrary. Sticking to median values lets the data speak for itself, while the possible drawbacks of using dichotomised categories are outweighed by using a combination of several variables.
The first variable is the age of the second homes. The median age is 32 years, meaning that half of all second homes in the sample were built in 1980 or later. For the purpose of this study, all second homes aged up to 32 years were categorised as ‘new’ while the others, aged 33 to 252 years, were labelled ‘old’.
The remaining five variables were categorised and labelled in the same way, using median values as divider. All variables, values and labels can be seen above (). Variables depicting change were made by subtracting the raster cells of 2012 with 1997, giving values for increase or decrease during the time-period in each raster cell. As for the variable for change in assessed property values, it should be noted that most areas of Sweden experienced some sort of increase in assessed property values during the time-period. This means that even though areas with a lower increase than the median value have been labelled as having ‘decreasing’ property values, this is rather a question of labelling than something that should be taken literally.
The created raster values were then merged in order to enable a categorisation according to the four theoretical landscape types. Areas without data for second homes on all six variables were excluded. The merged layer contained 64 different areas, each with a unique combination of dichotomised values (‘high’, ‘far away’, etc.). In order to determine which of the four second-home landscapes each of these 64 areas adhered to, an ideal combination of values was created for each second home landscape (). These ideal combinations were made based on the assumptions about each landscape in Müller et al. (Citation2004), but also Jansson and Müller (Citation2003); Marjavaara (Citation2007); Marjavaara and Müller (Citation2007) and Persson (Citation2011). The ideal combinations for each landscape are elaborated further below.
Table 2. Composition of variables in each second-home landscape.
First of all, the converted weekend second-home type is determined by Müller et al. (Citation2004, p. 16) as being most common in ‘ordinary rural landscape in urban hinterlands’. The ideal combination of values for each variable makes this a landscape with predominately old second homes, since older second homes are more likely to have been converted from primary residences. They are also more likely to be located close to the owner's primary residence. Urban proximity cause a decreasing number of second homes, increasing assessed property values and a low share of second homes in relation to the total stock of residential houses. Since these second homes are not located in particularly amenity-rich areas, we assume a low density of second homes in the area.
The converted vacation landscape is described as ‘extensively-used peripheral landscapes’ (Müller et al., Citation2004, p. 16). As in the previous case above, we assume that old second homes are more likely to have been converted. They are located far away from the owner's primary residence. We assume that peripheral areas are likely to experience increasing number of second homes due to such factors as depopulation. These landscapes are also characterised by decreasing assessed property values and a high share of second homes in relation to the total stock of residential houses. Since rural Sweden is generally sparsely populated, this landscape has a low density of second homes.
Müller et al. (Citation2004, p. 16) describe the purpose-built weekend type as being located in ‘amenity-rich hinterlands, coast and mountain landscapes’. The purpose-built weekend landscape is assumed to have new second homes. These second homes are located close to the owner's primary residence, which should generally entail some sort of urban proximity. This also makes it more likely that the number of second homes in the vicinity are decreasing (due to conversion into primary residences) and assessed property values increasing. Since they are located close to more populated urban areas, we have assumed a low share of second homes in relation to regular residential houses. At the same time, however, since the model rests on the assumption that purpose-built second homes are located in areas attractive for second home tourism, we have assumed a high density of second homes.
Last but not least, purpose-built vacation is described by Müller et al. (Citation2004, p. 16) as a second-home type in ‘major vacation areas, coast or mountain landscapes’. We assume that most second homes in the purpose-built vacation landscape are new and located far away from their owners. The location is assumed to be attractive for second home tourism and not in direct overlap with urban property markets, meaning that the number of second homes and assessed property values should be increasing. Since these areas are attractive for second-home tourism, we assume a high share and high density of second homes in the area. It should be noted that each second-home landscape entail certain variations in the invisible population of second-home owners. The distance between second-home owners’ permanent residence and second home affects the frequency of visits and dwelling use. Whether the number of second homes are increasing or decreasing influence the size of the invisible population. Changes in assessed property values can for example impact the social class of second-home owners. The share and density of second homes signals whether the invisible population is concentrated or dispersed and to what degree it is mixed with permanent residents. These effects can all be assumed to have effects for local planning authorities.
All 64 areas were then sorted under one of the four ideal types depending on how closely they resembled the ideal types in the combination of dichotomised values. For example, an area with the combination of values ‘new’, ‘close’, ‘decrease’, ‘decrease’, ‘low’ and ‘high’, would be deemed most similar to the combination for purpose-built weekend (see ) and therefore categorised as part of that landscape. A few of the 64 areas had combinations of values matching more than one of the second-home landscapes in . In these cases, the first and second variables, age and distance, were used as rulers to determine which second-home landscape these areas belonged to. The reason for using these two variables was that they were the ones most closely connected to the two axes in the theoretical model.
Swedish second-home landscapes
The final map () shows very fine-grained details, but the four different second-home landscapes can be identified and related quite distinctly to certain areas. Much can be said about different individual locations and patterns, but the focus here is on three main points: the north-south split, the rural-urban relation and the tourism hot-spots.
Figure 2. Swedish second-home landscapes.
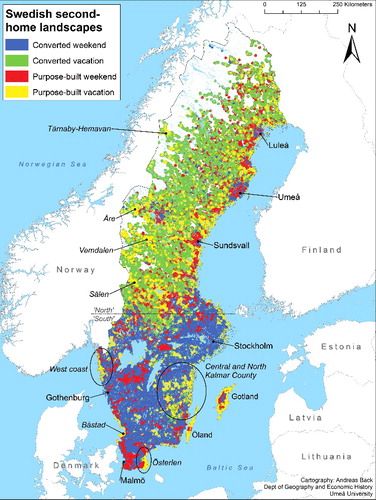
To begin with, Sweden is divided into a northern and a southern part administratively, demographically and economically (Borgegård, Håkansson, & Malmberg, Citation1995; Fritz, Alvstam, & Korhonen, Citation1995; Hansson, Citation1992; Lundmark & Malmberg, Citation1995; Öberg & Springfeldt, Citation1991). This divide has been marked on the map with a line just north of Stockholm. About 15% of the population live north of this line, with a population density of about five individuals per km2 (Statistics Sweden, Citation2016). Economic restructuring in the past decades has resulted in depopulation in many parts of the country, especially in already sparsely populated areas such as the inland north (Borgegård et al., Citation1995; Lundholm, Citation2007; Lundmark, Citation2006). A north-south split can clearly be seen in converted weekend and converted vacation second-home landscapes. This difference results primarily from underlying migration processes, whereby people have moved and the buildings left behind have been converted into second homes (Lagerqvist, Citation2011; Persson, Citation2011). Migration from northern rural areas has been absorbed by cities in the south or along the northern coast (such as Umeå or Luleå), while migration from southern rural areas has been directed at southern cities. This underlying migration pattern clarifies why owners of northern inland second homes are more likely to live farther from their cottages than owners of converted second homes in the south, as is visible on the map ().
About 85% of the Swedish population live in urban areas, and 50% live within 10 km of the coast (Statistics Sweden, Citation2013). The largest urban areas are the metropolitan regions of Stockholm, Gothenburg and Malmö. Barring the outermost islands of the Stockholm archipelago, this urban trio have no immediate landscapes of second homes at vacation distance, which seems to indicate that these cities’ inhabitants are more likely to frequent attractive neighbouring areas for second-home tourism (Müller, Citation2005). But this rural-urban relation is perhaps most apparent in northern Sweden, where cities such as Sundsvall, Umeå and Luleå are surrounded by a radius of second homes at weekend distance. As such, these northern cities deviate from the surrounding area, where second homes are more likely to be located at vacation distance from their owner. Another interesting deviation is the area in central and north Kalmar County in the southeast of Sweden. This area has a similar history of economic restructuring and out-migration to that of northern Sweden, which seems to have also resulted in a situation with owners living at vacation distance from their second homes.
Popular spots for (second-home) tourism are the coastal areas, the western mountain range along the Norwegian border, and around inland lakes. These hot-spots include inland ski resorts such as Sälen, Vemdalen, Åre and Tärnaby-Hemavan, coastal regions such as the Stockholm archipelago, and the large southeastern islands of Öland and Gotland. Other popular and exclusive locations include the West Coast, Båstad, Österlen, and the coastal area of the Tjust archipelago in north Kalmar County. These areas are all included in the purpose-built vacation landscape. The most plausible explanation for this pattern is that people are prepared to both travel farther and pay more for their second homes in these areas than in others, meaning that the owners are more likely to be more affluent and more infrequent visitors than in other second-home landscapes. Öland and Gotland are very interesting examples. In the case of Öland, the entire island is covered by the purpose-built vacation landscape, except for a small area of purpose-built weekend next to the bridgehead of the bridge connecting the island to the mainland and the city of Kalmar. As for Gotland, the entire coastline is occupied by second homes at vacation distance, while second homes in the interior of the island are owned by people living close by. Coastal areas are attractive enough for second-home owners living far away, while inland Gotland seems to be only of local concern.
Conclusions
Our aim was to analyse the heterogeneous geography of second homes by mapping the Swedish second-home stock in line with the theoretical model Müller et al. (Citation2004) and investigate the empirical applicability of the model. By doing so, we wanted to analyse what is often handled under a unitary category of ‘second homes’. The results can be seen as a way of catching the diversity known previously through numerous case studies, and giving it a spatial expression. Since this study focuses on Sweden, it can of course be labelled a case study as well. On the other hand, it captures the vast majority of second homes in an entire country, with considerable variation within its borders. This study shows the applicability of the theoretical model by Müller et al. (Citation2004) in an empirical setting, highlighting the impact of population dynamics, amenity landscapes, property markets and geographical distance on second-home tourism.
Although being a rough categorisation of four second-home landscapes, our results show second homes to be a very diverse category. However, this is not to say that second homes are so diverse that they cannot be grouped together; because no matter whether a second home is used frequently or infrequently, is located in the woods or on the beach, is a shack or chateau, its dwelling use is what makes it a second home (Paris, Citation2014). Instead of viewing second homes as a unitary category, our results rather point towards the use of second homes as an umbrella concept with the common factor of dwelling use. Treating second homes as an umbrella concept would enable analyses with more sensitivity to place and local contexts, taking into account factors such as attractiveness, accessibility, historical and economic processes, owners’ social class, etc.
But apart from providing a more detailed picture of the current compositions of second homes in Sweden, what kind of information can the second-home landscapes offer? Second-home tourism and the ‘invisible population‘ of second home tourists can be linked to a diverse range of issues impacting destinations, such as the demand for and supply of local and public services, the conversion of second homes into primary residences or vice versa, retirees living in their second homes, networking and the transfer of ideas between second-home tourists and locals, involvement in local planning processes, etc. (see for example Barnett, Citation2014; Gallent, Citation2013; Hall & Mu¨ller, Citation2004a; Marjavaara, Citation2007, Citation2008; Paris, Citation2011; Persson, Citation2011; Robertsson & Marjavaara, Citation2014). Here, we demonstrate that there are differences within the category of second homes and that these differences show geographical patterns. When considering these results along with the impacts of second-home tourism, it is reasonable to assume that these impacts vary spatially in conjunction with the second-home landscapes. In other words, breaking up and mapping the differences of second homes makes it possible to pose the fundamental geographical question of where different impacts of second-home tourism might come into play.
So, for example, where might the invisible population's demand for public services be great? Where is this population large enough to provide local businesses with a crucial extra boon to sales? In what places are buildings more likely to be converted to or from second homes in the future? Where might we expect surging or stagnating property values? Where are the second-home owners likely to be frequent or infrequent visitors? Where will local growth management be required to handle effects of thriving second-home resorts? Where might second homes be part of a process of decline? We come closer to resolving such questions connected to the invisible population by considering second-home landscapes as elaborated here. These impacts give rise to diverse geographies that planning authorities have to deal with on a regular basis, but we have little information about the actual facts on the ground.
There seems, then, to be ample opportunity to continue with further studies on this subject. First of all, it should be entirely possible to carry out similar mappings of second-home landscapes in other countries than Sweden, provided that there is sufficient data. Where such data might be lacking, the findings from this paper could be used as a template to define similar second-home landscapes in other geographical settings. Second, it would be very interesting to study socio-economic differences between second-home owners using second-home landscapes. For example, does income inequality transfer over to the second-home landscapes, and if so, how does this affect the destinations for second-home tourism? Third, further in-depth studies of planning issues at the local level could help illustrate how different second-home landscapes affect the authorities responsible for public planning and services. We aim to return to the last of these proposals in a future study.
Since Coppock (Citation1977), the pervasive question in second-home research has been whether second homes are a curse or a blessing. Our modest answer would be both and neither, simultaneously. What the second-home landscapes show is that ‘curse’ or ‘blessing’ is a question of context. A question of geography.
Acknowledgements
The research for this paper was financed by the Swedish Research Council Formas. We would like to acknowledge this support, as well as the comments of the three anonymous referees. Furthermore, we would like to thank Professor Dieter K. Müller from the Department of Geography and Economic History at Umeå University for his valuable input and support.
Disclosure statement
No potential conflict of interest was reported by the authors.
Additional information
Funding
Notes on contributors
Andreas Back
Andreas Back is currently working toward the PhD degree in social and economic geography at Umeå University. His research concerns public planning and second-home tourism. The project is funded by the Swedish Research Council Formas.
Roger Marjavaara
Roger Marjavaara is an associate professor in social and economic geography at Umeå University. The focus of his research is second-home tourism, retailing and post-mortal mobility.
References
- Adamiak, C., Pitkänen, K., & Lehtonen, O. (2016). Seasonal residence and counterurbanization: The role of second homes in population redistribution in Finland. GeoJournal. Advance online publication. doi:10.1007/s10708-016-9727-x
- Adamiak, C., Vepsäläinen, M., Strandell, A., Hiltunen, M. J., Pitkänen, K., Hall, C. M., … Åkerlund, U. (2015). Second home tourism in Finland. Helsinki: Finnish Environment Institute (SYKE).
- ASTRID. (2015). Data on Swedish second homes and second home owners, for the years 1997 and 2012.
- Barnett, J. (2014). Host community perceptions of the contributions of second homes. Annals of Leisure Research, 17(1), 10–26. doi:10.1080/11745398.2014.886156
- Bell, M., & Ward, G. (2000). Comparing temporary mobility with permanent migration. Tourism Geographies, 2(1), 87–107. doi:10.1080/146166800363466
- Blondy, C., Plumejeaud, C., Vacher, L., & Didier, V. (2014). Do second home owners only play a secondary role in coastal territories? A case study in Charente-Maritime (France). Tourism, Leisure and Global Change, 1(2014), 1–14.
- Borgegård, L.-E., Håkansson, J., & Malmberg, G. (1995). Population redistribution in Sweden: Long term trends and contemporary tendencies. Geografiska Annaler. Series B, Human Geography, 77(1), 31–45.
- Coppock, J. T. (1977). Second homes: Curse or blessing? (1st ed.). Oxford: Pergamon Press.
- Dijst, M., Lanzendorf, M., Barendregt, A., & Smit, L. (2005). Second homes in Germany and the Netherlands: Ownership and travel impact explained. Tijdschrift voor Economische en Sociale Geografie, 96(2), 139–152.
- Fritz, M., Alvstam, C. G., & Korhonen, J. (1995). Svenskt näringsliv i historiskt perspektiv. In C. G. Alvstam (Ed.), Industri och service (vol. 15, pp. 10–23). Höganäs: Bokförlaget Bra Böcker.
- Gallent, N. (2013). The social value of second homes in rural communities. Housing, Theory and Society, 31(2), 174–191. doi:10.1080/14036096.2013.830986
- Haldrup, M. (2004). Laid-back mobilities: Second-home holidays in time and space. Tourism Geographies, 6(4), 434–454. doi:10.1080/1461668042000280228
- Halfacree, K. (2012). Heterolocal identities? Counter-urbanisation, second homes, and rural consumption in the era of mobilities. Population, Space and Place, 18(2), 209–224. doi:10.1002/psp.665
- Hall, C. M. (2014). Second home tourism: An international review. Tourism Review International, 18(3), 115–135.
- Hall, C. M., & Müller, D. K. (2004 a). Introduction: Second homes, curse of blessing? Revisited. In C. M. Hall & D. K. Müller (Eds.), Tourism, mobility and second homes: Between elite landscape and common ground (pp. 3–14). Clevedon: Channel View Publications.
- Hall, C. M., & Mu¨ller, D. K. (Eds.). (2004b). Tourism, mobility, and second homes: Between elite landscape and common ground. Clevedon: Channel View Publications.
- Halseth, G. (2004). The ‘cottage’ privilege: increasingly elite landscapes of second homes in Canada. In C. M. Hall & D. K. Müller (Eds.), Tourism, mobility and second homes: Between elite landscape and common ground. Channel View Publications.
- Hansson, B. (1992). Hur används marken? In Å. Clason & B. Granström (Eds.), Jordbruket (Vol. 5, pp. 26–39). Höganäs: Bokförlaget Bra Böcker.
- Hiltunen, M. J., Pitkänen, K., Väpsäläinen, M., & Hall, C. M. (2013). Second home tourism in Finland: Current trends and eco-social impacts. In Z. Roca (Ed.), Second home tourism in Europe: Lifestyle issues and policy responses (pp. 165–198). Farnham: Ashgate.
- Jansson, B., & Müller, D. K. (2003). Fritidsboende i kvarken. Umeå: Kvarkenrådet Umeå.
- Lagerqvist, M. (2011). Torpets transformationer. materialitet, representationer och praktik från år 1850 till 2010 . (Unpublished doctoral dissertation). Stockholm University, Stockholm.
- Lundholm, E. (2007). New motives for migration? Interregional mobility in the Nordic Context. (Unpublished doctoral dissertation). Umeå University, Umeå.
- Lundmark, L. (2006). Restructuring and employment change in sparsely populated areas. (Unpublished doctoral dissertation). Umeå University, Umeå.
- Lundmark, M., & Malmberg, A. (1995). Näringslivsomvandling och lokaliseringsförändring. In C. G. Alvstam (Ed.), Industri och service (Vol. 15, pp. 24–33). Höganäs: Bokförlaget Bra Böcker.
- Marjavaara, R. (2007). The displacement myth: Second home tourism in the Stockholm Archipelago. Tourism Geographies, 9(3), 296–317. doi:10.1080/14616680701422848
- Marjavaara, R. (2008). Second home tourism. The root to displacement in Sweden? (Unpublished doctoral dissertation). Umeå University, Umeå.
- Marjavaara, R., & Müller, D. K. (2007). The development of second homes' assessed property values in Sweden 1991–2001. Scandinavian Journal of Hospitality and Tourism, 7(3), 202–222. doi:10.1080/15022250601160305
- Müller, D. K. (2005). Second home tourism in the Swedish Mountain Range. In C. M. Hall & S. W. Boyd (Eds.), Nature-based tourism in peripheral areas: Development or disaster? (pp. 133–148). Clevedon: Channel View Publications.
- Müller, D. K., & Hall, C. M. (2003). Second homes and regional population distribution: On administrative practices and failures in Sweden. Espace, populations, sociétés, 21(2), 251–261.
- Müller, D. K., Hall, C. M., & Keen, D. (2004). Second home tourism impact, planning and management. In C. M. Hall & D. K. Müller (Eds.), Tourism, mobility and second homes: between elite landscape and common ground (pp. 15–32). Clevedon: Channel View Publications.
- Müller, D. K., & Hoogendoorn, G. (2013). Second homes: Curse or blessing? A review 36 years later. Scandinavian Journal of Hospitality and Tourism, 13(4), 353–369. doi:10.1080/15022250.2013.860306
- Müller, D. K., Nordin, U., & Marjavaara, R. (2010). Fritidsboendes relationer till den svenska landsbygden. Umeå University, Umeå. Retrieved from GERUM Kulturgeografisk arbetsrapport.
- Paris, C. (2011). Affluence, mobility and second home ownership. Abingdon: Routledge.
- Paris, C. (2014). Critical commentary: Second homes. Annals of Leisure Research, 17(1), 4–9. doi:10.1080/11745398.2014.890511
- Persson, I. (2011). Fritidshuset som planeringsdilemma. Karlskrona: Blekinge Institute of Technology.
- Pitkänen, K. (2008). Second-home landscape: The meaning(s) of landscape for second-home tourism in Finnish Lakeland. Tourism Geographies, 10(2), 169–192. doi:10.1080/14616680802000014
- Rinne, J., Paloniemi, R., Tuulentie, S., & Kietäväinen, A. (2014). Participation of second-home users in local planning and decision-making – A study of three cottage-rich locations in Finland. Journal of Policy Research in Tourism, Leisure and Events, 7(1), 98–114. doi:10.1080/19407963.2014.909818
- Robertsson, L., & Marjavaara, R. (2014). The seasonal buzz: knowledge transfer in a temporary setting. Tourism Planning & Development, 12(3), 251–265. doi:10.1080/21568316.2014.947437
- Roca, Z. (Ed.). (2013). Second home tourism in Europe: Lifestyle issues and policy responses. Farnham: Ashgate.
- Shucksmith, D. M. (1983). Second homes: A framework for policy. The Town Planning Review, 54(2), 174–193.
- Statistics Sweden. (2013). Varannan svensk bor nära havet. Stockholm: Statistics Sweden (SBC). Retrieved from http://www.scb.se/sv_/Hitta-statistik/Artiklar/Varannan-svensk-bor-nara-havet/
- Statistics Sweden. (2014a). Undersökningarna av levnadsförhållanden, semesterresande och fritidshus. Andel personer i procent efter indikator, ålder, kön och årsintervall. Stockholm: Statistics Sweden (SBC). Retrieved from http://www.statistikdatabasen.scb.se/pxweb/sv/ssd/START_LE_LE0101_LE0101F/LE0101F01/?rxid=8e3464cf-d8c9-4774-8235-69a5d292176c
- Statistics Sweden. (2014b). Utländskt ägande och utlandssvenskars ägande av fritidshus i Sverige 2013. Stockholm: Statistics Sweden (SBC). Retrieved from http://www.scb.se/sv_/Hitta-statistik/Statistik-efter-amne/Boende-byggande-och-bebyggelse/Fastighetstaxeringar/Fastighetstaxeringar/30229/30236/Behallare-for-Press/371188/
- Statistics Sweden. (2015). Skattesatser 2016 i kommuner, län och hela riket. Stockholm: Statistics Sweden (SBC). Retrieved from http://www.scb.se/sv_/Hitta-statistik/Statistik-efter-amne/Offentlig-ekonomi/Finanser-for-den-kommunala-sektorn/Kommunalskatterna/11849/11856/67873/
- Statistics Sweden. (2016). Folkmängd i landskapen den 31 december 2015. Stockholm: Statistics Sweden (SBC). Retrieved from http://www.scb.se/sv_/Hitta-statistik/Statistik-efter-amne/Befolkning/Befolkningens-sammansattning/Befolkningsstatistik/25788/25795/Helarsstatistik_Forsamling-landskap-och-stad/403147/
- Swedish Tax Agency. (2015). Kommunal fastighetsavgift kalenderåren 2008-2016. Stockholm: Swedish Tax Agency (Skatteverket). Retrieved from https://www.skatteverket.se/download/18.5a85666214dbad743ff17283/1443419155035/Kommunal+fastighetsavgift+kalender%C3%A5ren+2008-2016_Version+1.0_2015-09-28.pdf
- Swedish Tax Agency. (2016). När ska man betala statlig inkomstskatt och hur hög är den? Stockholm: Swedish Tax Agency (Skatteverket) . Retrieved from https://www.skatteverket.se/privat/sjalvservice/svarpavanligafragor/beloppprocentsatser/privatbeloppfaq/narskamanbetalastatliginkomstskattochhurhogarden.5.10010ec103545f243e8000166.html
- Svenson, S. (2004). The cottage and the city: An interpretation of the Canadian second home experience. In C. M. Hall & D. K. Müller (Eds.), Tourism, mobility and second homes (pp. 55–74). Clevedon: Channel View.
- Vagner, J., Müller, D. K., & Fialová, D. (2011). Second home tourism in light of the historical-political and socio-geographical development of Czechia and Sweden. Geografie, 116(2), 191–210.
- Winkler, R., Deller, S., & Marcouiller, D. (2015). Recreational housing and community development: A triple bottom line approach. Growth and Change, 46(3), 481–500. doi:10.1111/grow.12100
- Visser, G. (2003). Visible, yet unknown: Reflections on second-home development in South Africa. Urban Forum, 14(4), 379–407.
- Öberg, S., & Springfeldt, P. (Eds.). (1991). Befolkningen (Vol. 3). Höganäs: Bokförlaget Bra Böcker.