
 ?Mathematical formulae have been encoded as MathML and are displayed in this HTML version using MathJax in order to improve their display. Uncheck the box to turn MathJax off. This feature requires Javascript. Click on a formula to zoom.
Abstract
Technological developments over the last two decades have allowed researchers to employ advanced tracking technologies to collect high-resolution spatial and temporal data. Despite the extensive use of these technologies in tourism research, they have not yet been applied to the existing indicators of tourism demand. The current paper aims to fill this lacuna, proposing the use of tracking technologies to measure tourist activity in destinations and, in particular, extreme conditions such as tourist saturation and overtourism. It introduces a new index for tourism demand, the Intensity-Density Index (IDI), based on high-resolution data in time and space. After presenting an overview of the common indicators for measuring tourism demand, the most common indicators, the Tourism Intensity Rate (TIR) and the Tourism Density Rate (TDR), are calculated twice, using traditional methods and advanced tracking technologies. The second calculation is based on a unique survey conducted in Israel between 2015 and 2017, which included some 3,000 tourists whose activity in the destination was documented entirely on a national level and at high resolution. Finally, the methodology for calculating high-resolution (HR) indicators using GPS data is presented, resulting in the IDI. Advanced tracking technologies’ use in calculating the IDI not only helps present tourism activity more accurately in terms of time and space but can also be applied in tourism management to serve as a tool for effective planning.
1. Introduction
Over the past two decades, the proliferation of advanced tracking technologies has facilitated the digital tracking of tourists in time and space. GPS (Global Positioning System), RFID (Radio Frequency Identification), Wi-Fi tracking, Bluetooth tracking, NFC (Near Field Communication), and Social Media Monitoring are some of the central tracking technologies being applied in tourism studies. These provide a better understanding of a visitor’s activity and its impact on the destination (Shoval and Ahas, Citation2016; Hardy, Citation2020). Each tracking technology has strengths and weaknesses concerning data accuracy, accessibility, reception range, operating and analysis costs, energy consumption, and visitor involvement (Hardy, Citation2020). Nonetheless, digital tracking technologies are more accurate and objective and yield higher-resolution data than do the subjective self-report methods traditionally employed in tourism studies (Shoval and Isaacson, Citation2009).
During the first decade in which tourism studies employed advanced tracking technologies, the discourse focused on the technical aspects and challenges of implementing these methods for research. Only during the second decade did studies start applying advanced tracking technologies on a larger scale, aiming to answer more specific research questions (Shoval & Ahas, Citation2016). These included: Is there a difference in visitors’ spatial activity patterns regarding the times they visit the destination (McKercher et al., Citation2012)? How do the group composition and time of visit affect the visitors’ spatial activity (East et al., Citation2017)? How do characteristics of spatial activity explain visitor expenditure in a destination (Sciortino et al., Citation2022)?
This study proposes the use of advanced tracking technologies to measure the intensity and density of tourist activity, particularly in the context of growing concerns regarding excessive tourism and overtourism. Though the term overtourism is a relatively new one (Rafat, Citation2018) in academic research, it describes a phenomenon with a long history: the negative impact of abundant tourism on tourist destinations. Reference to tourism carrying capacity in natural environments can be found as early as the early 1960s in nature reserves in North America (Wagar, Citation1964) and in the early 1970s in urban environments in historic European cities (Young, Citation1973).
Many researchers, then, agree with the claim that the rise of overtourism is much like ‘old wine in a new bottle’ (Dredge, Citation2017). A heightened focus on urban carrying capacity’s struggles with congestion and overcrowding was noted in the 1970s and 1980s within Jafari’s cautionary platform (Citation2005). Pioneering models such as Doxey’s (Citation1975) Irridex and Butler’s (Citation1980) Tourism Area Life Cycle fit well into this platform. The two models assume that each location has a maximal threshold of visitors; crossing the carrying capacity has negative implications for the local population, the tourist experience, and, ultimately, the tourist destination’s function. Many heritage cities have suffered from this phenomenon in its first wave, with Venice as one ‘textbook’ example (Van der Borg et al., Citation1996). However, in most ‘regular’ tourist cities, tourism has been perceived as a tool for urban revitalization and has even been adopted more broadly as a strategy for economic rehabilitation and development (Grodach & Loukaitou-Sideris, Citation2007; Law, Citation2000).
Alongside the clear economic benefits of tourist growth in the pre-COVID-19 era (WTTC, 2021), the success of urban tourism led to a renewed discourse about the negative impacts of tourism, both physically and socially. Overcrowding in tourist destinations, congestion in urban infrastructure, rise in cost of living, retail gentrification, pollution, and damage to heritage sites due to inappropriate tourist behavior are some of the negative impacts attributed to intensive tourist activity (Dodds & Butler, Citation2019; Nilsson, Citation2020). The second wave of extreme congestion at destinations was named ‘overtourism.’ The term relates, for the most part, to urban destinations and is characterized by unprecedented levels and widespread spatial dispersal in today’s age of globalization and hyper-communication (Bouchon & Rauscher, Citation2019). The debate about the negative ramifications of urban tourism is no longer limited to historic cities; now it applies to larger cities as well. What characterized historic cities in the 1980s and 1990s has now, four decades later, become the inheritance of many other cities that previously viewed tourism as a solution rather than a problem.
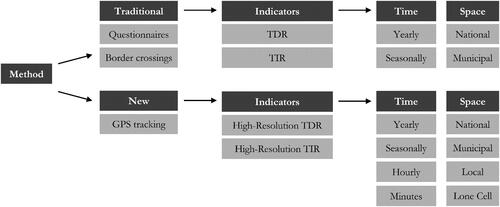
Despite a significant increase in discussion of tourism and overtourism in the academic discourse, measurement of both still suffers from shortcomings. Most studies that have formulated indicators for tourist activity—including sustainable tourism and overtourism—used traditional measurement methods based primarily on an annual and municipal scale, lacking spatial and temporal disaggregation (Mayer, Citation2008; Buitrago & Yñiguez, Citation2021). Those studies that do propose complex indicators, i.e. indices, to evaluate tourist activity more broadly (Mayer, Citation2008; Torres-Delgado & Saarinen, Citation2014) do not rely on advanced tracking technologies or other accurate methods to measure the phenomenon’s intensity and density. This article aims to bridge the gap by setting two main objectives: (1) applying advanced tracking technologies to the existing tourism demand indicators and (2) introducing a new index for tourist activity: the Intensity-Density Index (IDI), based on spatially and temporally high-resolution GPS data.
The Old City of Jerusalem serves as a case study, using temporal-spatial data collected from approximately 3,000 tourists over the course of two years. Although the data were collected between 2015 and 2017, the uniqueness of the survey in terms of scope and scale and the conceptualisation of a novel application and measurement tool for the intensity and density of tourist activity in a given destination, makes a considerable contribution to how urban tourism and issues of overcrowding can be measured.
2. Measuring tourist activity
2.1. Traditional methods for measuring tourism activity
Over the years, a variety of indicators for evaluating tourist activity and tourism’s impact have been developed. One of the oldest measurements of tourism’s impact on a destination is Tourist Function (TF). Defert (Citation1967) proposed calculating the correlation between number of existing hotel beds and number of residents to reflect the intensity of tourist activity in a destination. A follow-up study by Boyer (Citation1972) divided Defert’s TF measurement into six categories, from hyper-tourist destinations (TF > 500) to destinations that host no tourists at all (TF ≤ 4). Similarly, Tourist Locality (TL) calculates the effects of tourist activity spatially and presents the number of hotel beds in a destination per square kilometer. These two measures refer to supply by assessing the burden on a city’s tourist infrastructure (Dumbrovska & Fialova, Citation2014). Yet their main limitation is their reliance on accommodations capacity (Pearce, Citation1995). They do not reflect the true activity of tourists in a destination; they lack reference to real capacity and non-commercial lodgings (Jansen-Verbeke & Spee, Citation1995).
On the demand side, two groups of measurements should be noted. The first examines tourism demand by measuring the monetary value generated by tourist activity. This is accomplished using indicators such as Contribution to GNP, Tourist Expenditures, Tourist Expenditure per Capita, and more, evaluating the economic effect of tourist activity on a destination or economic penetration (McElroy & Albuquerque, Citation1986).
The current research focuses on the second type of measurement—demand—which defines tourist demand using number of visitors (Cooper et al., Citation1993) and assesses the social influence of tourist activity in a destination, or social penetration. The Travel Intensity Index is the ratio between the total number of visitors and the local population (Lundberg, Citation1974). It is considered the most common measure of tourism’s socio-cultural impact (McElroy, Citation2003). The ratio between the total number of visitors and the area can also be calculated to estimate the spatial pressure of tourist activity. The Tourist Intensity Rate (TIR) is calculated similarly, but it refers to the number of tourists per 100 inhabitants (Dumbrovska & Fialova, Citation2014; Harrison, Citation1992) to measure the ‘Host–Guest’ irritation (McElroy, Citation2003). It aligns with Doxey’s Irridex Model (1975); as the proportion of tourists to locals is higher, the social pressure of tourism on the destination will grow while the patience of the local population will wane.
Harrison (Citation1992) suggests two alternative indicators to measure the effects of tourism growth, demonstrating them in less developed countries: the Tourist Penetration Rate (TPR) and the Tourist Density Rate (TDR). TPR calculates the number of tourists times the average length of stay for every 1,000 residents per day; TDR calculates the same per square kilometer per day. These two indicators can be interpreted as the daily visitor intensity or the daily visitor density. According to Harrison (Citation1992), although both the TIR and the TPR calculate the ratio between visitors and residents, they have two key differences: The TIR is calculated in relation to Tourist Arrivals, whereas the TPR relates to the average overnight stay multiplied by the number of tourists, attesting to the importance of tourist duration of stay at a destination. In addition, the calculation of the TPR shows an average ratio of 1,000 inhabitants per day (divided by 365). These differences illustrate the high variability in how the demand indicators—TIR, TPR, and TDR—are applied.
These three measures reflect significant differences in tourist activity between destinations and serve to highlight the importance of specific variables in tourist activity. Although comparability is one of the main criteria for a good indicator (Torres-Delgado & Saarinen, Citation2014), the variation in the variables used for calculating the indicators makes comparisons between studies difficult. In addition, whereas in theory, they can show seasonality, in practice, for the most part, they are calculated from annual data and, therefore, use a daily average, eliminating seasonality. Another limitation is their difficulty in expressing spatial concentration, as the municipal scale is the lowest level on which the data is usually collected. Last, these indicators are characterized by one-dimensionality, describing social, economic, or physical perspectives alone, failing to reflect the complexity of tourist activity and its effects (McElroy & Albuquerque, Citation1998; Van der Borg et al., Citation1996).
To overcome the limitation of spatial distribution, Van der Borg et al. (Citation1996) proposed the Socio-economic Impact Indicator, which calculates the ratio of number of tourists to number of residents in the tourist area only. Their research, which examines tourist activity in European heritage cities, highlights the importance of matching the scale of metrics to urban nature; heritage cities must present tourist activity indicators concerning the Central Tourism District, which usually corresponds to the city’s historical center. McElroy & Albuquerque (Citation1998) attempted to overcome the one-dimensionality limitation with their Tourism Penetration Index. This complex indicator weights three measures into one index, each reflecting a different dimension of tourism’s effect on the destination. Tourist expenditure per resident was selected to represent the economic effect; the TL, hotel beds per square kilometer, was selected to represent the environmental effect; the number of daily visitors per one thousand residents was selected to represent the social impact.
Peeters et al. (Citation2018) conducted a comparative survey of forty-one European tourist destinations. The study aimed to improve the understanding of overtourism comparatively, evaluate its scope, and propose policy for moderating its negative ramifications using the two main indicators presented above. In contrast with Harrison (Citation1992), here the TPR (number of visitors per 100 inhabitants per day) and the TDR (number of visitors per square kilometer per day) were based on the total number of visitors to the destination. Peeters et al. (Citation2018) further suggest assessing these indicators alongside others—Airbnb bed capacity (Share of Airbnb), intensity of air travel (Air Transport Density), and contribution of tourism to the GDP (Share of Tourism in the Economy)—for a more coherent analysis of the phenomenon. They also found great variance between the nature of tourist activity’s effects on a destination and the four types of tourist destinations they focused on (Rural, Urban, Coastal and Islands, Heritage and Attractions). In the case of Coastal & Islands, for example, the combination of high TPR and TDR may attest to a destination at risk of overtourism; in urban destinations the TDR is found to be a more significant signal of overtourism due to the high numbers of tourists and day visitors. Given that cities have large resident populations, their TPR is expected to be relatively low. Thus, they recommend examining the different destinations by their specific characteristics rather than determining a consistent threshold for the indices presented.
González et al. (Citation2018) compared eleven European cities that suffer from extreme tourism growth. The study employed three central indicators: tourism intensity, density indicator, and rate of increase in incoming tourism between 2006 and 2016. The intensity indicator was calculated twice for two demand variables: Tourist Arrival and Tourist Overnight. Another comparative study was conducted by Amore et al. (Citation2020), who examined the overtourism phenomenon in fifteen European cities. Like the two previous studies discussed, it used several traditional indicators. However, it did not suffice with describing a series of measurements; it also proposed a new weighted index for evaluating overtourism and determining urban boundaries for tourism’s growth. The four measures used for creating the Composite Indicator of Overtourism were (1) the number of overnight stays per relevant tourist area in square kilometers; (2) the number of visitors to museums relative to the local population; (3) the percentage of annual change in the number of tourist overnights between 2009 and 2017; and (4) the number of overnights stays of foreign tourists relative to the local population. An additional innovation was the way in which the density indicator was calculated—it related not to the entire city but rather to the Central Tourism District, much like Van der Borg et al. (Citation1996), to better reflect the spatial concentration of the tourists, who tend to cluster in the center of the city.
The many indicators and indices developed over the years for assessing tourist activity can be subcategorized into two main groups relating to various tourist impacts on an urban destination. summarizes the four central indicators for evaluating tourist activity and the basic variables used to calculate them. The indicators are presented in their most basic form as a ratio between the number of visitors or beds (i.e. the dependent variables) and the number of residents or area (i.e. the independent variables). The dependent variable usually represents tourism’s economic impact and can be divided into demand or supply indicators. The independent variable generally represents either social-cultural pressure, using absolute numbers of local population to evaluate the intensity of tourist activity (TIR and TPR), or physical pressure, using the city’s area to assess the density of tourist activity (TDR).
Table 1. Summary of common indicators for evaluating tourist activity.
These basic measures have many variations (see Supplementary appendix 1). Some present them as a daily average (divided by 365). For the demand indicators, high variability was found concerning the number of visitors variable (Visitors or Tourist Arrivals or Tourist Overnights or Tourists Overnight times the Average Length of Stay). For the intensity indicators, there is also a variance in the proposed ratio for the local population (per 100 or 1,000 inhabitants). Despite the renewed discussion about the negative impact of tourist saturation on cities (Butler & Dodds, Citation2022), most comparative studies still use these common indicators to evaluate tourist activity on annual and municipal scales (Dumbrovska & Fialova, Citation2014; González et al., Citation2018; Peeters et al., Citation2018.). The few that do present new indices (Amore et al., Citation2020) rely on traditional methods rather than on advanced tracking methods.
2.2. New methods for measuring tourist activity using high-resolution data
The development of land-based digital tracking technologies (Wi-Fi, Bluetooth, RFID, etc.) and satellite-based technologies, foremost the Global Positioning System (GPS), has made it possible to more accurately record users’ spatial and temporal behavior. In addition, advances in general computing capabilities have facilitated the analysis of vast databases (Shoval et al., Citation2014). As tracking devices grew smaller and were assimilated into smartphones and wearable sensors, it became possible to collect data relatively easily, and their use increased—including in tourism studies (Hardy Citation2020).
GPS tracking is the prevalent digital method for dealing with visitors’ spatial behavior, given the abundant, accurate, continuous, and real-time information it offers (Shoval & Ahas, Citation2016). At the same time, it is not without limitations; its efficiency decreases dramatically indoors or in dense urban environments, leading to signal noise and loss. In light of this, raw data must undergo cleaning and processing after collection before it can be analyzed (Hardy, Citation2020; Shoval & Isaacson, Citation2007).
The use of GPS tracking forms the basis for several different research methods. Dedicated GPS devices (GPS Loggers) facilitate data collection for a relatively long time compared to smartphone-based GPS. At the same time, especially in longitudinal experiments, a large burden is placed on the participant (including the responsibility of carrying and loading). Moreover, dedicated devices raise the question of whether wearing the monitoring device impacts spatial behavior (Shoval & Isaacson, Citation2007). Smartphone-based GPS is an easy and convenient method since it is used daily; participants carry smartphones at all times and usually do not forget to charge the battery. Using a GPS-based application on a participant’s device for tracking makes the data-collection procedure less expensive, eliminating the need for a device distribution and return point. On the other hand, the concern for the privacy of the information may discourage potential participants, limiting the number of subjects in the survey. GPS tracking methods, whether through a dedicated device or a smartphone application, must be accompanied by a supplementary survey so that conclusions can be drawn not only about the pattern of spatial-temporal activity but also about the characteristics of the visit and the tourist, so that motives underlying tourist behavior can be understood (Hardy, Citation2020; Reif & Schmücker, Citation2020; Shen & Stopher, Citation2014; Shoval & Isaacson, Citation2007).
Combining GPS data with big data analysis is gaining popularity in geographic studies and tourism studies, which aim to map the spatial behavior of users and tourists. Passive Mobile Data (PMD) is one example of this method; it records mobile phones’ spatial and temporal traces using embedded GPS sensors. The collection of big data is characterized by the three Vs; Enormous Volume, high Velocity, and a large Variety of digital formats (Hardy, Citation2020; Reif & Schmücker, Citation2020). The use of cell phones’ passive positioning for big data tracking technology generates enormous data volume with relative ease while enabling great resource-saving, freeing the research from recruiting participants and actively collecting data. In addition, big data reflects users’ real activity; it is not a representative sample (Ahas et al., Citation2008). Nonetheless, it raises quite a few challenges. Technically, there is a need for large storage volume and complex means of processing and analysis. Ethically, data collection is conducted unconsciously and without proper consent. Privacy protection laws in many countries prevent information association and require an anonymization and aggregation procedure. This procedure prevents the synchronization of the spatiotemporal behavior with additional data, essential to understanding the visitor’s preferences, influences, and motivations. Empirically, since big data is collected frequently and unrelated to tourism studies, there is difficulty distinguishing between tourists and non-tourists (Reif & Schmücker, Citation2020).
A growing number of studies have implemented advanced tracking technologies in tourism research. For example, McKercher et al. (Citation2012) used GPS sequences to compare the spatial behavior patterns of first-time and repeat visitors in Hong Kong. De Cantis et al. (Citation2016) recorded the temporal-spatial behavior of cruise passengers during their visit to Palermo, Sicily, in addition to descriptive data on visitor behavior; the study demonstrated how different mobility patterns can be segmented from GPS sequences. A recent study by Sciortino et al. (Citation2022) also deals with onshore cruise passenger behavior in Copenhagen, Denmark. The study used a combined approach of GPS loggers and a consumer survey of passengers to investigate spatial-temporal consumption.
East et al. (Citation2017) collected daily visitor data using a dedicated GPS device. Unlike the three studies mentioned above, which investigated a spatial-temporal pattern on the urban level, East et al.’s data collection focused on a specific attraction, the Marwell Zoo in Hampshire, UK. The analysis related to the group type categorization (couple, friends, parents with children, etc.) and the time of the visit during the day to examine how these characteristics affected spatial practices at the site.
Another study, on a national level, was conducted in Estonia by Raun et al. (Citation2016). Real data on the spatiotemporal activity of visitors was gathered through the country’s largest mobile network operator’s anonymized passive mobile positioning data. Varying visitation patterns were found based on geographic levels and seasonal visitation patterns. These findings demonstrate the application of big data in tourism destination management. Passive methods allow convenient, efficient, and longitudinal analyses given their autonomous procedure, which makes it possible to measure tourist behavior on a large scale. Yet they cannot obtain additional information about a visitor’s goals and experience other than country of residence (Raun et al., Citation2016, Citation2020).
Hardy et al. (Citation2020) examined spatial-temporal tourist dispersal on the state level in Australia over a complete trip. Sample data were collected over two years using a dedicated application designed to collect GPS data and survey data; these were installed on study phones and distributed to participants. The use of study phones helped recruit participants and overcome privacy concerns. Besides its large scope and scale, the uniqueness of this study was the introduction of four dispersal indicators calculated using advanced tracking technologies (Hardy et al., Citation2020).
3. Methodology
3.1. Data collection
This study uses high-resolution tourist time-space data from a survey conducted in Israel over two years, from November 2015 to December 2017. This was undertaken by the Jerusalem Transportation Master Plan as part of a survey conducted to introduce the tourist factor into Israel’s new transportation model, aiming to improve transportation modeling in Israel. The survey used smartphone-based GPS devices to track tourist activity in the destination. A dedicated application named ‘SmartTraffic’ was installed on study phones given to the participants, synchronized in real-time with a unique system built for the study. Movement-tracking was conducted every three seconds throughout the tourists’ entire stay in Israel. International tourists were recruited to join the study at Ben-Gurion Airport, and received an explanation and signed an informed consent. In exchange, they received incentives in the form of a $42 gift card for use at duty-free stores and local internet and free phone calls on the study phone they received for the duration of their trip. Participants were also asked to fill in questionnaires regarding socio-demographic characteristics and tourism profiles.
Data were compiled for 3,012 individual tourists whose planned trip in Israel included overnight stays and was no longer than fourteen days. GPS sequences were cleared of imprecisions in location, and a method for completing or removing large gaps in data was determined. A ‘hole’ in GPS sequences was defined as a period greater than 15 min without spatial data. In cases in which a ‘hole’ did not exceed two hours, an attempt was made to complete the spatial data. If the GPS reading before and after the ‘hole’ was located in the same polygon, it was concluded that the participant was in the polygon during this gap. After completing ‘holes’ in sequence (if possible), the data were filtered according to the following criteria: Days on which more than 10% of the time was identified as ‘holes’ were removed from the analysis. Also removed from the analysis were participants with spatial information of 50% or less for all visit days and participants with spatial data solely of a single visit day. Ultimately, a sample of 2,689 individual tourists was prepared for analysis (see ).
Table 2. Participants’ statistics.
The use of smartphones, that were distributed to the participants as part of the study, not only resulted in spatially and temporally high-resolution data but also enhanced a high participation rate. This survey was unique in its participants’ scope and national spatial coverage; academic literature contains only a handful of similar studies (Hardy et al., Citation2020; Raun et al., Citation2016, Citation2020).
3.2. Data analysis
3.2.1. Formulation of HR indicators
It is common to distinguish between two patterns which, taken together, compose tourist movement in a destination: movements, describing the linear movement of tourists in space, and stays, describing the cumulative duration of stay of tourists at a specific point (McKercher & Lew, Citation2004). Based on this division, two main parameters were extracted from the GPS data: (1) Passage (parallel to movements) notes the total number of participants who passed through each cell, while (2) Duration (parallel to stays) notes the total stay of all participants in each cell. In aligning the central measures of tourist activity, TDR, and TIR with advanced tracking technologies, four new indicators can be calculated at a higher resolution (HR) than was previously customary (see ).
Figure 1. Tourist activity indicators using GPS data.
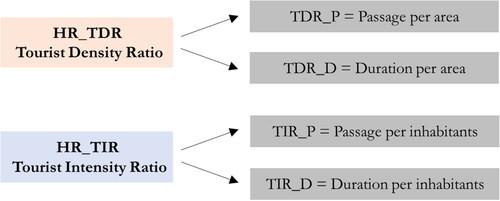
The new HR_TDR is split into two measures: duration of tourist stays per cell (TDR_D) and the number of visitors per cell (TDR_P), in contrast with earlier studies, which measured the TDR regarding the total area of a city. In the case of Jerusalem, the municipal area is approximately 125 km2, and the area of the Old City is about 1 km2. The current study calculates the indicator relative to a lone cell whose area is 2,500 m2. The new HR_TIR is similarly split into two indicators: duration of tourist stay relative to local population in the cell (TIR_D) and the number of visitors relative to local population in a cell (TIR_P).
3.2.2. Local population
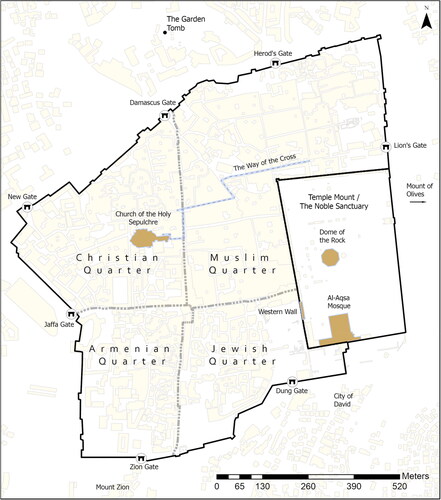
The local population density for each cell was calculated to apply HR_TIR measures on the level of a lone cell of 50 by 50 meters for the urban subdistricts in the Old City of Jerusalem. Data regarding the local population were taken from the municipal database according to statistical areas. The Old City in Jerusalem is divided into four statistical areas: the Jewish Quarter, the Armenian Quarter, the Christian Quarter, and the Muslim Quarter, including the Temple Mount/Haram al-Shariff. The Jewish and Armenian Quarters are the smallest in terms of area (making up about 14% of the total area each) and in terms of population (containing about 9% and 7% of the total population, respectively). The Christian Quarter constitutes about 21% of the total area and is inhabited by 12% of residents. In comparison, the Muslim Quarter is the largest (about 50% of the total area) and the most populated (roughly 73% of the total population). About a third of the Muslim Quarter’s area is the Temple Mount/Haram al-Shariff, which contains no inhabitants at all. The local population density per cell was calculated based on a municipal layer of residential buildings, including numbers of residents, intersected with the fishnet grid. The resulting layer was divided by the residents in each quarter per the relative cell area, excluding public buildings that are not inhabited (such as the Temple Mount/Haram al-Shariff; for more details, see Supplementary appendix 2).
3.2.3. The sample
The sample included 2,689 individual tourists who came to Israel for at least one day and at most 14 days. During the data-collection period, an annual average of 3,466,600 tourists arrived in Israel. According to the sample definitions, FITs, and 1<Length of Stay<14, the survey population was 1,502,800 tourists (Israel Ministry of Tourism, Citation2016, Citation2017). The ratio between the survey population and the sample was used to represent the total number of tourists when calculating the indicators.
The present study demonstrates the HR indicators in Jerusalem’s Old City; therefore, only the GPS sequences of those who visited the Old City were used (n = 1,443), making up about 54% of the total sample. It is important to note that the percentage is lower than the annual average published by the Israel Ministry of Tourism (which states that approximately 68% of all tourists to Israel visit the Old City). This gap results from the fact that the current analysis only refers to individual tourists. About 204 organized groups were included in the sample as part of the survey by monitoring their guides and drivers. However, due to the different data-collection methodologies, they were not included in the analysis.
4. Findings
4.1. Calculation of traditional indicators
The traditional tourist activity measures, TDR, and TIR were calculated for Jerusalem according to its municipal borders and the Old City area (see ). The inbound tourism data analysis was performed for 2016 to relevant to the GPS data collected between 2015 and 2017. When calculating the density indicator, the TRD, for the city of Jerusalem in relation to its entire municipal area (125 km2), a relatively low value of about 50 visitors per day per square kilometer is obtained. Despite its limited area of less than 1 km2, the Old City of Jerusalem hosts about 89% of all visitors to Jerusalem (Israel Ministry of Tourism, Citation2016). The TDR indicator spikes 117 times when calculated only for the Old City. For comparison, Venice’s historic center, which has been dealing with tourist saturation for several decades (Van der Borg et al., Citation1996), has a TDR that is 49 times higher than the municipal TDR. Concerning the intensity indicator, the TIR, there is also a high gap between the municipal area, which receives an average of 8 tourists per day per 100 residents, and the Old City, with its 176 tourists per day per 100 residents. When calculating the indicators for the Jerusalem municipality, it is evident that it is not characterized by particularly high density and intensity relative to the Old City and other cities such as Venice (see ).
Table 3. Calculation of traditional indicators for Jerusalem and Venice (municipal area and old city area; Citta’ Di Venezia, Citation2017; Israel Ministry of Tourism, Citation2016; Peeters et al., Citation2018).
4.2. Calculation of high-resolution indicators
The tourist activity indicators were recalculated for the Old City of Jerusalem using the methodology detailed in Section 3, resulting in four measures for each cell. The range of the four high-resolution indicators varies greatly. To present them conveniently and comparatively, they were normalized using a minimum and maximum normalization methodology and range between 0 and 1. Adjusting the values measured to a scale of 0 to 1 also made it possible to compare and aggregate them into one index (see Section 4.3). The result should be reviewed in parallel with the orientation map (see ). Below, we present the four HR measures calculated for the Old City of Jerusalem.
Figure 2. Map of the Old City of Jerusalem (Source: Authors).
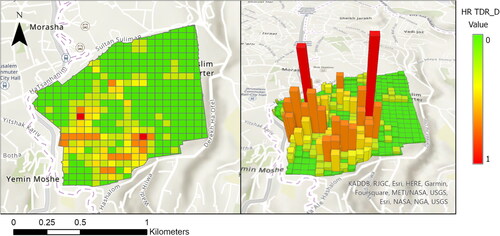
The TDR_D, tourist duration of stay per area, tallies the duration of stay of all tourists within a cell relative to its area. This indicator presents the central points of stay in the Old City of Jerusalem. The measure is calculated in hours and normalized, ranging between 0 and 1, where 1 indicates cells with the longest cumulative stay. The Western Wall and the Church of the Holy Sepulcher are identified as the cells that draw visitors for longer stays (see , which presents the indicator data in two and three dimensions).
Figure 3. TDR_D in the Old City of Jerusalem, 2015–2017 (Source: Authors).
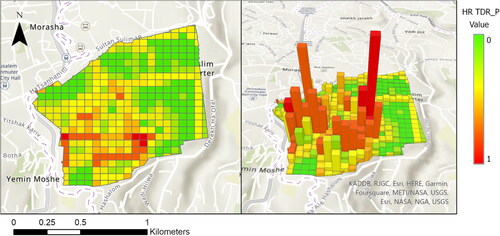
The TDR_P, the number of visitors per area, presents the number of tourists passing through each cell relative to its area. This indicator sums up all respondents who stepped into a cell. Each respondent was counted once (as a unique value). The theoretical measure ranges between 0 and 1, with 1 relating to the cells through which the largest number of tourists passed. In practice, the cell with the maximal number of tourists, Jaffa Gate (the central entrance gate to the Old City), had 1,000 tourists visiting it, comprising some 70% of the total visitors to the Old City. This measure outlines the predominant linear movement of tourists in the Old City: the central walking route from Jaffa Gate toward the Western Wall and the Temple Mount and the walking route to the Church of the Holy Sepulcher, including the via Dolorosa. An additional, prominent route is the Ramparts Walk, which encircles the Old City (see , which shows the indicator data in two and three dimensions).
Figure 4. TDR_P for the Old City of Jerusalem, 2015–2017 (Source: Authors).
The intensity indicators, TIR_D and TIR_P, referring to the local population, were calculated in relation to the residential areas and therefore do not include the popular religious sites. Accordingly, they illustrate the pressure on the surrounding public space due to the relative number of residents in each cell.
The TIR_D, tourist duration of stay per the local population, sums up the tourists’ duration of stay within a cell relative to its residents. This indicator presents the central pressure points upon the Old City’s inhabitants. The measure is calculated in hours and normalized, ranging between 0 and 1, with 1 referring to the cells in which the ratio of tourist stay to the number of residents is the greatest. The indicator’s consideration of the local population thus emphasizes the pressure on the main entrance gates to the Old City, especially Jaffa Gate and the New Gate. In contrast with TDR_D, the values of the TIR_D in the Muslim Quarter, which holds most of the Old City’s population (approximately 72%), are significantly lower since the indicator presents the central staying points in the Old City of Jerusalem relative to the local population (see ).
Figure 5. Left: TIR_D in the Old City of Jerusalem, 2015–2017; Right: TIR_P in the Old City of Jerusalem, 2015–2017 (Source: Authors).
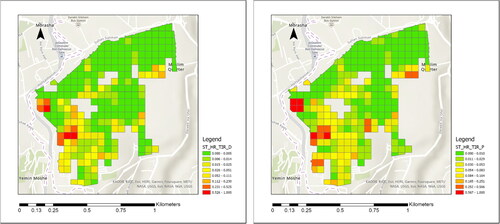
The TIR_P, the number of visitors relative to the local population, presents the number of visitors passing through each cell in relation to its residents. The indicator ranges between 0 and 1, with 1 relating to the cells in which the ratio of the number of tourists to the number of residents is highest. Compared to TDR_P, which presented a clear linear movement, this movement is slightly weakened when the index is calculated in relation to the local population. The less populated a cell is, the greater the noticeable effect of the visitors on the local population, and vice versa; the more populated a cell is, the more negligible the passing tourists’ effect is on the local population. Much like the TIR_D, the indicator’s values for the main entrance gates to the Old City are significantly higher. In addition, the surroundings of the main religious sites (the entrance to the Western Wall and the Temple Mount/Haram al-Shariff complex) also show high values (see ).
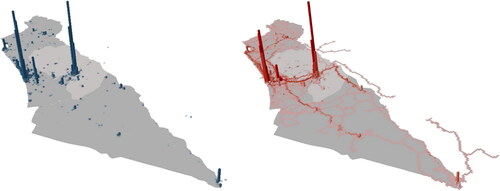
The four HR indicators detailed above, taken together, describe tourist activity in Jerusalem’s Old City. Due to our methodological approach and the goal of presenting HR indicators, they were applied to only one spatial scale (the Old City of Jerusalem) and one temporal scale (time of the entire sample). However, since the data were collected on the national level and included accurate temporal records, the indicators can easily be calculated for different spatial contexts and times. presents the Duration variable on a national scale, comparing daytime and nighttime activity. The advantage of these indicators over the traditional ones is their ability to present this activity more precisely both temporally and spatially. Another strength of the HR indicators is that they can be calculated for different populations, cell sizes and scales, times, etc.
Figure 6. Left: Duration variable on a national scale, average day activity; Right: Duration variable on a national scale, average night activity (Source: Jerusalem Transportation Master Plan, Citation2018).
However, the HR indicators have two main drawbacks: data collection and final output. First, calculating these indicators based on advanced tracking methods demands no small effort, including collecting spatial data for many participants. Once collected, it is relatively simple to calculate the four indicators for each chosen cell’s visiting population and/or given time. The second shortcoming is the analysis result, which includes four different metrics. This drawback can be overcome by creating an Intensity-Density Index (IDI) aggregating the four indicators.
4.3. The Intensity-Density Index (IDI)
The Intensity-Density Index (IDI) is calculated by placing the four HR indicators in Cartesian axes (see ). On the x-axis are the density indicators (TDR_D and TDR_P), and on the y-axis are the intensity indicators (TIR_D and TIR_P)—the four HR measures ranging between 0 and 1. The value of the IDI is the sum of the areas of the opposing right-angle triangles, D and P, according to the following formula:
Figure 7. The Intensity-Density Index (Source: Authors).
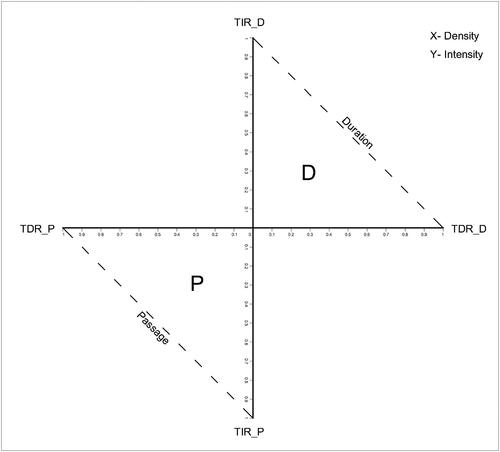
The D triangle connects the two indicators that use the variable of the duration of stay (Duration Triangle), and the P triangle connects the two measures that relate to the number of visitors (Passage Triangle). In a case in which all four HR indicators are near 1—that is to say, the density and intensity of the visitors in the cell are maximal—the total area of the triangles will be 1. The IDI ranges between 0 and 1, and its values can be divided into five categories based on the natural distribution of the results (Natural Breaks): values between 0.5 and 1 attest to a cell characterized by very high tourist activity; values between 0.1 and 0.5 attest to high tourist activity; values between 0.05 and 0.1 attest to medium tourist activity; values between 0.05 and 0.01 attest to low tourist activity; and values that are lower than 0.01 attest to a cell that has a very low tourist activity.
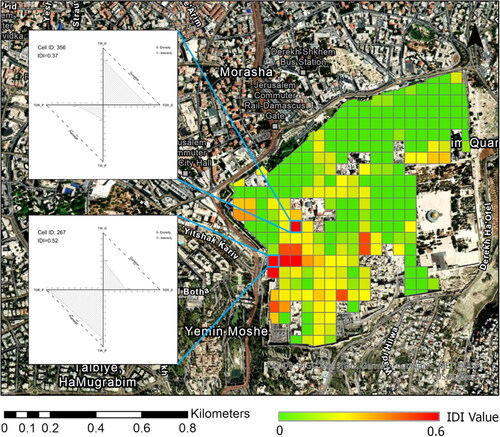
The IDI was calculated for each cell separately and presents the phenomenon with great precision and at a high resolution. demonstrates the IDI for the two cells with the highest IDI value: cell 267 (Jaffa Gate) and cell 356 (the plaza in front of the Church of the Holy Sepulchre). Cell 267 and the adjacent cells represent the central entrance to the Old City. Hence, it is unsurprising that it received the highest IDI values, particularly a very high number of visitors passing through. Cell 356 also has high IDI values—yet, unlike cell 267, it is characterized by a high duration of stay and only a medium number of visitors passing through. In addition, the IDI was also calculated for the entire Old City of Jerusalem, resulting in a low value (IDIOld City of Jerusalem = 0.014), especially compared to the highest cell presented above (IDI267 = 0.52).
Figure 8. IDI for cells 267 and 356, 2015–2017 (Source: Authors).
5. Discussion and conclusions
The methodology of measuring the intensity and density of tourist activity introduced above relies on two scientifically well-founded indicators, the density indicator (TDR) and the intensity indicator (TIR), which present the correlation between the number of tourists at a destination and its area or number of residents, respectively (Amore et al., Citation2020; Defert, Citation1967; Dumbrovska & Fialova, Citation2014; González et al., Citation2018; Harrison, Citation1992; McElroy, Citation2003; Peeters et al., Citation2018).
The four HR indicators were calculated using data extracted from an extensive smartphone-based GPS survey conducted on a national scale in Israel between 2015 and 2017. GPS data make it possible to document not only the number of tourists visiting each cell but also the length of their stay at any given time. This novel methodology facilitated a broader discussion about tourism-demand indicators and their more accurate and sensitive presentation, thus successfully addressing one of the main disadvantages of measurement: the spatial and temporal scale at which they are calculated (Mayer, Citation2008; Buitrago & Yñiguez, Citation2021; see ).
Figure 9. Methods for measuring tourist activity (Source: Authors).
Another central contribution of this article is the IDI. The IDI is a composite index aggregating all four HR indicators into one measure. The use of the index was demonstrated in detail concerning the Old City of Jerusalem. The IDI was calculated twice: for every cell and for the Old City in general. The IDI for the entire Old City of Jerusalem was low, which is inconsistent with the index’s values per cell. This comparison between the general and local indices illuminates the IDI’s relevance due to the tourist activity’s spatial concentration and the need to address it at a higher resolution than is currently studied.
The results of the index have a clear spatial representation that make it possible to grasp and communicate the spread of the phenomenon. The motivation for creating the IDI relates not only to its theoretical contribution but also to its application. The IDI is intended to be a tool for destinations coping with overtourism. Ideally, it will be calculated frequently and provide a continual assessment (Uysal & Sirgy, Citation2019). It can be used to guide decision-makers in the required policy changes as an ‘early warning system’ (White et al., Citation2006).
In the current study, this methodology was demonstrated solely on the Old City of Jerusalem for the total sampled visitors to the area during the sample period. Due to the article’s scope and methodological objectives, it did not present temporal or spatial comparisons. Future research that strives to explain tourism activity should apply the proposed methodology in a comparative manner concerning different spatial scales, tourist destinations, and times (hours of the day, days of the week, months of the year).
A number of limitations concerning the applicability of the IDI index must also be noted: the use of a GPS-based survey for the data-collection process is relatively complex and expensive, ultimately resulting in a limited sample size. Moreover, the data-analysis procedure requires great skill. Currently, GPS data are available, but their accessibility is lacking due to the high use costs. This limitation may delay the use of the index on an ongoing basis. Despite the imbalance in current cost efficiency, we estimate that as GPS technologies become more available and accessible in the near future, this drawback will become less of a factor (Shoval & Isaacson, Citation2009). Implementing the suggested methodology using the passive positioning of mobile phone data may help overcome the high costs and limited sample size while enabling more frequent calculations. Yet, as mentioned in the literature review, this method has restrictions that future research should consider, such as the inability to associate personal data with spatial data, its irrelevance to small geographic areas due to inaccuracy, the fact that this kind of data is not available by law in certain countries, and so on.
This article suggests a new, higher-resolution index for the existing tourist activity indicators using advanced tracking technologies. Such an index is a necessary next step in the objective perspective of measuring tourism demand, especially in light of phenomena such as overtourism. Future research should also include the subjective aspect of tourists and the local population (Amore et al., Citation2020). Today, studies incorporate tracking technologies not only in the spatial-temporal dimension but also in the emotional sphere, measuring objective physiological measures of emotional arousal (Kim & Fesenmaier, Citation2015; Shoval et al., Citation2018a, Citation2018b).
Despite the COVID-19 crisis, the need to develop indices for tourist activity has not become redundant, as many cities are once again troubled by excessive amounts of tourism (Butler & Dodds, Citation2022). In addition to the question of balancing tourism’s positive and negative effects, the question of the industry’s flexibility, given the fluctuations and the uncertainty of tourist activity, has arisen. The COVID-19 crisis has given cities an opportunity to re-examine how they manage tourism, recreation, and culture. The aspiration of tourist cities in the post-COVID-19 era should not be to return to the original form of tourism but rather to promote tourism that can improve the entire system (Richards, Citation2020). To do so, first and foremost, measurement must reflect the dynamic and unpredictable characteristics of each destination (Torres-Delgado & Saarinen, Citation2014). This article is a call to rethink not only how urban tourism is planned and managed but also how tourist activity in an urban destination is measured.
Supplemental Material
Download MS Word (943.4 KB)Disclosure statement
No potential conflict of interest was reported by the author(s).
Additional information
Funding
Notes on contributors
Rotem Mashkov
Rotem Mashkov is a Ph.D. candidate at the Hebrew University of Jerusalem. Her main research interests are urban planning, tourism planning, and urban tourism.
Noam Shoval
Noam Shoval is a professor of Geography at the Hebrew University of Jerusalem. His main research interests are urban geography and planning, urban tourism, and the implementation of advanced tracking technologies in various areas of spatial research, such as tourism and urban studies and medicine.
References
- Ahas, R., Aasa, A., Roose, A., Mark, U., & Silm, S. (2008). Evaluating passive mobile positioning data for tourism surveys: An Estonian case study. Tourism Management, 29(3), 469–486. https://doi.org/10.1016/j.tourman.2007.05.014
- Amore, A., Falk, M., & Adie, B. A. (2020). One visitor too many: Assessing the degree of overtourism in established European urban destinations. International Journal of Tourism Cities, 6(1), 117–137. https://doi.org/10.1108/IJTC-09-2019-0152
- Bouchon, F., & Rauscher, M. (2019). Cities and tourism, a love and hate story: Towards a conceptual framework for urban overtourism management. International Journal of Tourism Cities, 5(4), 598–619. https://doi.org/10.1108/IJTC-06-2019-0080
- Boyer, M. (1972). Le Tourisme. Editions du Seuil.
- Buitrago, E. M., & Yñiguez, R. (2021). Measuring overtourism: A necessary tool for landscape planning. Land, 10(9), 889. https://doi.org/10.3390/land10090889
- Butler, R. W. (1980). The concept of a tourist area cycle of evolution: Implications for management of resources. The Canadian Geographer/Le Géographe Canadien, 24(1), 5–12. https://doi.org/10.1111/j.1541-0064.1980.tb00970.x
- Butler, R. W., & Dodds, R. (2022). Overcoming overtourism: A review of failure. Tourism Review, 77(1), 35–53. https://doi.org/10.1108/TR-04-2021-0215
- Citta’ Di Venezia. (2017). Project of territorial governance of tourism in Venice. https://www.venicegov.com/Home/ShowDocument?id=3161
- Cooper, C., Fletcher, J., Gilbert, D., & Wanhill, S. (1993). Tourism: Principles and practice. Longman.
- Defert, P. (1967). Le Taux de Fonction Touristique: Miseau point et critique. Cahiers du Tourisme, C-13. CHET.
- De Cantis, S., Ferrante, M., Kahani, A., & Shoval, N. (2016). Cruise passengers’ behavior at the destination: Investigation using GPS technology. Tourism Management, 52, 133–150. https://doi.org/10.1016/j.tourman.2015.06.018
- Dodds, R., & Butler, R. (Eds.). (2019). Overtourism: Issues, realities, and solutions (Vol. 1). Walter de Gruyter GmbH & Co KG. https://doi.org/10.1515/9783110607369
- Doxey, G. V. (1975). A causation theory of visitor-resident irritants: Methodology and research inferences. In The impact of tourism: Travel research association, 6th annual conference proceedings (pp. 195–198). Sage.
- Dredge, D. (2017, September 13). “Overtourism”: Old wine in new bottles? https://www.linkedin.com/pulse/overtourism-old-wine-new-bottles-dianne-dredge
- Dumbrovska, V., & Fialova, D. (2014). Tourist intensity in capital cities in Central Europe: Comparative analysis of tourism in Prague, Vienna and Budapest. Czech Journal of Tourism, 3(1), 5–26. https://doi.org/10.2478/cjot-2014-0001
- East, D., Osborne, P., Kemp, S., & Woodfine, T. (2017). Combining GPS & survey data improves understanding of visitor behaviour. Tourism Management, 61, 307–320. https://doi.org/10.1016/j.tourman.2017.02.021
- González, A., Fosse, J., & Santos-Lacueva, R. (2018). Urban tourism policy and sustainability. The integration of sustainability in tourism policy of major European cities. Eco-Union publishing.
- Grodach, C., & Loukaitou-Sideris, A. (2007). Cultural development strategies and urban revitalization. International Journal of Cultural Policy, 13(4), 349–370. https://doi.org/10.1080/10286630701683235
- Hardy, A. (2020). Tracking tourists: Movement and mobility. Goodfellow Publishers. https://doi.org/10.23912/9781911635383-4277
- Hardy, A., Birenboim, A., & Wells, M. (2020). Using geoinformatics to assess tourist dispersal at the state level. Annals of Tourism Research, 82, 102903–102917. https://doi.org/10.1016/j.annals.2020.102903
- Harrison, D. (1992). International tourism and less developed countries: The background. In D. Harrison (Ed.), Tourism and the less developed countries. International journal of tourism cities (pp. 1–34). Belhaven Press. https://doi.org/10.1002/jtr.411
- Israel Ministry of Tourism. (2016). Tourism to Israel: A statistical report 2016. https://www.gov.il/he/departments/publications/reports/tourism-statistical-report
- Israel Ministry of Tourism. (2017). Tourism to Israel: A statistical report 2017. https://www.gov.il/he/departments/publications/reports/tourism-statistical-report
- Jafari, J. (2005). Bridging out, nesting afield: Powering a new platform. Journal of Tourism Studies, 16, 1–5. https://search.informit.org/doi/10.3316/ielapa.200603946
- Jansen-Verbeke, M., & Spee, R. (1995). A regional analysis of tourist flows within Europe. Tourism Management, 16(1), 73–80. https://doi.org/10.1016/0261-5177(95)93433-W
- Jerusalem Transportation Master Plan. (2018). Tourists GPS based transportation survey. Unpublished Report: Jerusalem.
- Kim, J., & Fesenmaier, D. R. (2015). Measuring emotions in real time: Implications for tourism experience design. Journal of Travel Research, 54(4), 419–429. https://doi.org/10.1177/0047287514550100
- Law, C. M. (2000). Regenerating the city centre through leisure and tourism. Built Environment, 26(2), 117–129. http://www.jstor.org/stable/23288852
- Lundberg, D. E. (1974). Caribbean tourism: Social and racial tensions. Cornell Hotel and Restaurant Administration Quarterly, 15(1), 82–87. https://doi.org/10.1177/001088047401400407
- Mayer, A. L. (2008). Strengths and weaknesses of common sustainability indices for multidimensional systems. Environment International, 34(2), 277–291. https://doi.org/10.1016/j.envint.2007.09.004
- McElroy, J. L. (2003). Tourism development in small islands across the world. Geografiska Annaler: Series B, Human Geography, 85(4), 231–242. https://doi.org/10.1111/j.0435-3684.2003.00145.x
- McElroy, J. L., & Albuquerque, K. (1986). The tourism demonstration effect in the Caribbean. Journal of Travel Research, 25(2), 31–34. https://doi.org/10.1177/004728758602500207
- McElroy, J. L., & Albuquerque, K. (1998). Tourism penetration index in small Caribbean islands. Annals of Tourism Research, 25(1), 145–168. https://doi.org/10.1016/S0160-7383(97)00068-6
- McKercher, B., & Lew, A. (2004). Tourist flows, itineraries and factors affecting the spatial distribution of tourists. In A. Lew, C. Hall, & A. Williams (Eds.), A tourism companion to geography (pp. 36–48). Blackwell. https://www.proquest.com/scholarly-journals/companion-tourism/docview/228355836/se-2?accountid=14546
- McKercher, B., Shoval, N., Ng, E., & Birenboim, A. (2012). First and repeat visitor behaviour: GPS tracking and GIS analysis in Hong Kong. Tourism Geographies, 14(1), 147–161. https://doi.org/10.1080/14616688.2011.598542
- Nilsson, J. H. (2020). Conceptualizing and contextualizing overtourism: The dynamics of accelerating urban tourism. International Journal of Tourism Cities, 6(4), 657–671. https://doi.org/10.1108/IJTC-08-2019-0117
- Pearce, D. (1995). Tourism today: A geographical analysis (2nd ed.). Longman.
- Peeters, P., Gössling, S., Klijs, J., Milano, C., Novelli, M., Dijkmans, C., Eijgelaar, E., Hartman, S., Heslinga, J., Isaac, R., Mitas, O., Moretti, S., Nawijn, J., Papp, B., & Postma, A. (2018). Research for TRAN Committee—Overtourism: Impact and possible policy responses. European Parliament, Policy Department for Structural and Cohesion Policies.
- Rafat, A. (2018, August 14). The genesis of overtourism: Why we came up with the term and what’s happened since. https://skift.com/2018/08/14/the-genesis-of-overtourism-why-we-came-up-with-the-term-and-whats-happened-since
- Raun, J., Ahas, R., & Tiru, M. (2016). Measuring tourism destinations using mobile tracking data. Tourism Management, 57, 202–212. https://doi.org/10.1016/j.tourman.2016.06.006
- Raun, J., Shoval, N., & Tiru, M. (2020). Gateways for intra-national tourism flows, measured using two types of tracking technologies. International Journal of Tourism Cities, 6(2), 261–278. https://doi.org/10.1108/IJTC-08-2019-0123
- Reif, J., & Schmücker, D. (2020). Exploring new ways of visitor tracking using big data sources: Opportunities and limits of passive mobile data for tourism. Journal of Destination Marketing & Management, 18, 100481. https://doi.org/10.1016/j.jdmm.2020.100481
- Richards, G. (2020). The impact of crisis on travel: COVID-19 and other shocks. In F. Burini (Ed.), Tourism facing a pandemic: From crisis to recovery (pp. 25–32). University of Bergamo. https://doi.org/10.6092/978-88-97253-04-4
- Sciortino, C., Ferrante, M., De Cantis, S., & Gyimóthy, S. (2022). Tracking cruise passengers’ consumption: An analysis of the relationships between onshore mobility and expenditure. Annals of Tourism Research Empirical Insights, 3(2), 100059. https://doi.org/10.1016/j.annale.2022.100059
- Shen, L., & Stopher, P. R. (2014). Review of GPS travel survey and GPS data-processing methods. Transport Reviews, 34(3), 316–334. https://doi.org/10.1080/01441647.2014.903530
- Shoval, N., & Ahas, R. (2016). The use of tracking technologies in tourism research: The first decade. Tourism Geographies, 18(5), 587–606. https://doi.org/10.1080/14616688.2016.1214977
- Shoval, N., & Isaacson, M. (2007). Tracking tourists in the digital age. Annals of Tourism Research, 34(1), 141–159. https://doi.org/10.1016/j.annals.2006.07.007
- Shoval, N., & Isaacson, M. (2009). Tourist mobility and advanced tracking technologies. Routledge. https://doi.org/10.4324/9780203869376
- Shoval, N., Kwan, M. P., Reinau, K. H., & Harder, H. (2014). The shoemaker’s son always goes barefoot: Implementations of GPS and other tracking technologies for geographic research. Geoforum, 51, 1–5. https://doi.org/10.1016/j.geoforum.2013.09.016
- Shoval, N., Schvimer, Y., & Tamir, M. (2018a). Tracking technologies and urban analysis: Adding the emotional dimension. Cities, 72, 34–42. https://doi.org/10.1016/j.cities.2017.08.005
- Shoval, N., Schvimer, Y., & Tamir, M. (2018b). Real-time measurement of tourists’ objective and subjective emotions in time and space. Journal of Travel Research, 57(1), 3–16. https://doi.org/10.1177/0047287517691155
- Torres-Delgado, A., & Saarinen, J. (2014). Using indicators to assess sustainable tourism development: A review. Tourism Geographies, 16(1), 31–47. https://doi.org/10.1080/14616688.2013.867530
- Uysal, M., & Sirgy, M. J. (2019). Quality-of-life indicators as performance measures. Annals of Tourism Research, 76, 291–300. https://doi.org/10.1016/j.annals.2018.12.016
- Van der Borg, J., Costa, P., & Gotti, G. (1996). Tourism in European heritage cities. Annals of Tourism Research, 23(2), 306–321. https://doi.org/10.1016/0160-7383(95)00065-8
- Wagar, J. A. (1964). The carrying capacity of wild lands for recreation. Forest Science Monograph., 7, Society of American Foresters. https://doi.org/10.1093/forestscience/10.s2.a0001
- White, V., McCrum, G., Blackstock, K. L., & Scott, A. (2006). Indicators and sustainable tourism: Literature review. Macaulay Institute. https://macaulay.webarchive.hutton.ac.uk/ruralsustainability/LiteratureReview.pdf
- WTTC. (2021). Global economic impact and trends 2021. World Travel and Tourism Council. https://wttc.org/Portals/0/Documents/Reports/2021/Global%20Economic%20Impact%20and%20Trends%202021.pdf?ver=2021-07-01-114957-177
- Young, G. (1973). Tourism: Blessing or blight. Penguin.