
ABSTRACT
This paper explores the potential impact of the Covid-19 pandemic on people’s perceptions of cohesion in their local communities; particularly for vulnerable groups/communities, such as ethnic minorities or those living in highly deprived neighbourhoods. To this end, we examine both trends over time in overall levels of cohesion as well as patterns of positive and negative changes experienced by individuals using nationally representative data from Understanding Society Study. We test whether rates of positive-/negative-change in cohesion over the pandemic-period differed across socio-demographic groups and neighbourhood characteristics. These trends are then compared to patterns of positive-/negative-change over time experienced in earlier periods to test whether the pandemic was uniquely harmful. We show that the overall levels of social cohesion are lower in June 2020 compared to all of the examined pre-pandemic periods. The decline of perceived-cohesion is particularly high in the most deprived communities, among certain ethnic minority groups and among the lower-skilled. Our findings suggest that the pandemic put higher strain on social-resources among vulnerable groups and communities, who also experienced more negative changes in other areas of life.
Introduction
Social cohesion in the Covid-19 pandemic
Since the introduction of the Covid-19 social distancing restrictions, there has been an ongoing public discussion on how far communities in the UK (and globally) are coming together to overcome the crisis. On one hand, news outlets have touted a renewed sense of community and togetherness emerging from the pandemic.Footnote1 Some prominent examples of this include the rapid response to the government-backed NHS Volunteer Responders scheme and the brisk emergence of ad-hoc community help groups. Yet, at the same time, we have also witnessed signs of communities under strain, such as ethnic harassment during the early days of the pandemicFootnote2, and news reports on neighbourhood tensions over adherence to ‘social distancing’ rules.Footnote3 This raises a key question: did communities come together during the pandemic or did they come apart? Furthermore, were any impacts of the pandemic on cohesionFootnote4 shared equally across society; or, were more vulnerable people/places less able to hold together in the wake of Covid-19, potentially widening pre-existing inequalities in cohesion?
Understanding how the pandemic affected perceived-cohesion is critical given the benefits it can bring, especially during crises. Disaster research links collective-efficacy that comes from higher perceived neighbourhood cohesionFootnote5 to greater community resilience, reflected in faster recoveries from natural disasters (e.g. Cagney et al. Citation2016). Studies of recent environmental disasters, such as hurricane Katrina and the nuclear disaster in Fukushima, show that individuals in more cohesive neighbourhoods (as measured by perceived-cohesion) had lower odds of developing depression (Lê et al. Citation2013), a higher likelihood of maintaining life satisfaction and were more positive about their future prospects (Jung Citation2019). In addition, Norris et al. (Citation2008) argue that community-competence, related to collective decision-making and taking effective action is highly correlated with perceived local cohesion. Interestingly, Tackenberg and Lukas (Citation2019:325) note that, in modern societies, collective efficacy may be based less on actual friendship relationships between neighbours and more on ‘the shared belief in the collective ability to achieve common goals’.
What can past research of crises teach us about how perceived-cohesion might be responding under the Covid-19 pandemic? On one hand, there are reasons to be optimistic that neighbourliness may have experienced a resurgence under the pandemic. There are no shortage of accounts of communities coming together during crises, such as the 2008–09 Economic Crisis or London Blitz (e.g. Judt Citation2010). Experimental work also demonstrates that acute social stress might lead to more prosocial behaviour (e.g. trust and support) (von Dawans et al. Citation2012). On the other hand, however, recent research into the impact of Covid-19 on other outcomes leads to less optimistic predictions. Emerging evidence is revealing a slew of negative pandemic impacts, such as increasing mental distress (e.g. Sibley et al. Citation2020), unemployment (e.g. Bauer and Weber Citation2020) and loneliness (e.g. Killgore et al. Citation2020). Concurrently, more vulnerable groups appear to be bearing a disproportionate share of these impacts. E.g. studies show that the economically-precarious and those with pre-existing health conditions are reporting even greater depressive symptoms (e.g. Kim and Laurence Citation2020), or that minority groups are exhibiting a greater jump in pandemic-driven unemployment (Couch et al. Citation2020), while residents of disadvantaged communities are bearing a greater healthcost (Harlem and Lynn Citation2020).
Such findings raise the possibility that the pandemic could also be harming perceived local cohesion. Poorer mental-/physical- health and socio-economic insecurity are all associated with weaker cohesion (Lim and Laurence Citation2015; Putnam Citation2000). For example, economic insecurity can lead resources (finances, time and energies) being redirected to supporting oneself and immediate household, rather than the wider community (Strauß Citation2008). Similarly, stress, depression and anxiety are strong predictors of social isolation and disengagement (Sirven and Debrand Citation2012). Accordingly, through these pathways the pandemic may also trigger a national withdrawal from community life. In addition, if vulnerable groups are experiencing harsher-effects of the pandemic, or if the pandemic has induced greater precarity and anxiety among those in vulnerable positions, these groups may see larger cohesion declines.
Concurrently, where vulnerable-groups are concentrated together (e.g. disadvantaged communities) the pandemic could exert additional pernicious effects on cohesion, beyond individuals’ personal experiences. For example, if many residents in an area are negatively impacted by the pandemic, their withdrawal from community-life could spill-over to affect the cohesion of residents who have not been significantly impacted themselves. Alternatively, disadvantaged communities may possess weaker social resources, norms of engagement, or civic infrastructures, all important to maintain cohesion. This may result in less resilience to mobilise in the face of the pandemic, or become actively involved in their areas, leading to even greater community withdrawal (Lim and Laurence Citation2015; Sampson et al. Citation2005). Accordingly, the impacts of the pandemic on perceived-cohesion may vary not solely across individuals but also communities, with disadvantaged areas potentially particularly hard hit.
To our knowledge, little work has systematically examined how the current pandemic is affecting perceptions of cohesion. However, one clue may be to return to the last crisis the UK experienced – the 2008–09 Recession – in which communities also experienced large-scale economic, health and mental distress (Chang et al. Citation2013; e.g. Stuckler et al. Citation2011). With the onset of the recession, rates of formal and informal helping behaviours declined amongst all people, but with particularly precipitous drops among residents of disadvantaged communities (Lim and Laurence Citation2015). Such work suggests the Covid-19 pandemic could have a similarly corrosive effect on cohesion, especially for more vulnerable people/places.
In this paper, we attempt to provide the first empirical evidence on how perceptions of cohesion in England have changed around the time of the Covid-19 pandemic. We measure cohesion using survey questions on how individuals perceive cohesion of their local community. However, despite being individuals’ own perceptions, we believe these reflect (in part) neighbourhood-level beliefs about local cohesiveness. We ask: 1) Are overall levels of perceived local cohesion during the pandemic different from the levels reported in pre-pandemic periods? And, 2) did levels of cohesion decline/increase more among certain socio-demographic groups/communities during the pandemic, compared to the pre-pandemic period? We then use the panel component of our data to track how individuals’ perceptions of cohesion changed over the pre-pandemic period (2011/12–2014/15), versus how individuals’ perceptions of cohesion changed around the pandemic period (2014/15–2020). In doing so, we can compare the proportion of individuals reporting a negative change, no change, or a positive change over the pre-pandemic period with patterns of positive/negative/no change around the pandemic period. This is important to unpack the source of any declining cohesion over time: simply studying levels of cohesion over two time-periods gives no indication of how much change might still be occurring. For example, if levels of cohesion between two time-points remain stable, this could be driven by all individuals experiencing ‘no change’ over the period, or it could be driven by equal proportions of individuals experiencing a positive and negative change, similarly resulting in stable levels. Accordingly, any declining levels of cohesion around the pandemic may be driven by both an increase in the proportion experiencing negative changes compared to the pre-pandemic period and a decrease in the proportion experiencing positive changes in cohesion. We therefore also ask: 3) Are the changes in levels of perceived-cohesion observed during the pandemic driven more by declining positive/or rising negative change? We also provide the first test of whether cohesion in more and less deprived communities was differently affected during the pandemic by linking individual-level responses to neighbourhood-level measures of deprivation. This explores whether, after controlling for individual-level characteristics, contextual-characteristics of neighbourhoods (e.g. deprivation) also matter for how individuals’ cohesion responded. Although we cannot explicitly test if changes in cohesion were directly related to the pandemic, as our baseline levels of cohesion were measured in 2014/15, for some measures we are also able to compare pandemic levels of cohesion with those observed in 2017/18, to assess any cohesion declines around the time of the pandemic with more confidence.
Data
Our main analysis uses three waves of Understanding Society: the UK Household Longitudinal Study (UKHLS), which comprises a representative sample of approximately 40,000 households followed since 2009–10. Understanding Society includes a special Covid-19 Study capturing individuals’ experiences during the pandemic. The Covid-19 Study sample consists of active respondents from the main Study, meaning that the data can be linked to answers provided in previous UKHLS waves. For our analyses, we use two waves of the annual survey: Wave 3 (collected 2011/12) and 6 (collected 2014/15), and the latest UKHLS Covid-19 data (Wave 3), collected between 24 and 30 June 2020. All three waves contain a ‘neighbourhood-module’ regarding perceived-cohesion in respondents’ local area. Additionally, for two out of five measures, we can compare cohesion levels observed in 2017/2018 (Wave 9).
Measures
Neighbourhood cohesion
Neighbourhood cohesion is assessed using five items, measured on a 5-point Likert scale (1-strongly agree; 5-strongly disagree): ‘I regularly stop and talk with people in my neighbourhood’, ‘People around here are willing to help their neighbours’, ‘People in this neighbourhood can be trusted’, ‘People in this neighbourhood generally don't get along with each other’, ‘I think of myself as similar to the people that live in this neighbourhood’.Footnote6 We reverse scales where appropriate so higher values always represent greater cohesion. We also construct a social cohesion scale computed as the sum of scores of the five input variables (Cronbach’s alpha=.8). The values of the scale range from 5 (lowest cohesion) to 25 (highest cohesion). If respondents are missing only one item, we impute their mean response (rounded to integer) based on the four other items as a proxy. For each cohesion measure, we also create a change variable that takes the value of 1 (‘positive change’) if an individual reports higher level of social cohesion at time t, compared to the value reported when previously asked; value 0 if there is no change, and value −1 if there is a ‘negative change’ (less cohesion). We create a change variable for the cohesion-scale in a similar manner; however, those who experienced net positive or negative change by less than two points are classed in the ‘no change’ category. We apply a threshold of +/- 2 points so that the distribution of change follows approximately the same distribution of its composite measures.
Covariates
We explore cohesion patterns across basic socio-demographic characteristics such as: gender (men/women); age groups (coded in 10-year intervals), economic activity (employed, self-employed, non-employed), education (GCSE or lower, A-level, degree-level) and ethnicity (White British, Indian, Pakistani/Bangladeshi, Black, White Other, Other ethnic group). We also examine differences in cohesion across area-level deprivation using deciles of the Index of Multiple Deprivation (IMD)Footnote7 measured at Middle Layer Super Output Area level (MSOA).Footnote8 In the models estimated for Wave 6, we use IMD 2015 and in the models estimated for the Covid-19 wave, we use IMD 2019.
Sample, methods and analytical approach
We restrict the analytic sample to England given the devolved governments had different policies on restrictions/timing of their implementation. Our sample consists of 34,508 individuals at Wave 3; 28,383 at Wave 6 and 11,164 at the Covid-19 wave. The first stage of analysis compares levels of perceived-cohesion across three points in time (two pre-pandemic time-points and one pandemic time-point) for the general population and for different socio-demographic groups. For two out of five composite measures (with data for 2017/18), we report three pre-pandemic time points. In the second step, we compare the share of individuals experiencing positive and negative changes in social cohesion around the ‘pandemic-period’ (between Wave 6 and the third Covid-19 Study Wave) with the share experiencing positive and negative changes over the ‘pre-pandemic-period’ (between Waves 3 and 6).
In the third step, we apply multinomial multilevel logistic regression models with individuals as Level-1 units and MSOAs as Level-2 units where the dependent variable is ‘change in social cohesion’ occurring across two-waves the (pre-pandemic and pandemic) periods. These models apply the aforementioned 3-category measure of ‘change in perceived-cohesion’, where: −1 is an individual experiencing ‘negative change’, 0 is ‘no change’, and 1 is ‘positive change’. ‘No change’ forms the baseline outcome category. First, we build the baseline model that controls for individual-level characteristics only. In the second step, we add neighbourhood-level deprivation measured by IMD deciles. We also conduct sensitivity analysis by testing alternative modelling strategies (results available on request) e.g. individual-level multinomial logistic regressions with robust standard errors clustered either at individual or MSOA level; the results are substantively the same.
Firstly, these models test whether different individual-level socio-demographic characteristics, and neighbourhood deprivation, are associated with a higher likelihood of experiencing positive/negative changes in cohesion around the pandemic-period (Wave 6 to Covid-19 Wave). Secondly, this analysis is repeated to examine the same relationships over the pre-pandemic period (Wave 3–6). This allows us: (a) to model how much positive/negative change different groups experienced around the pandemic-period; and (b) compare such pandemic-period changes to patterns of change occurring over the pre-pandemic period. We do not perform formal significance-testing for any observed differences in how our socio-demographic predictors are associated with change in the pre-pandemic period and pandemic period (point (b) above), given data complications associated with multinomial analyses of panel data across different periods. Instead, comparisons of models across the pre-pandemic/pandemic periods are only indicative.
Although Understanding Society is a panel study, we essentially treat it as a repeated cross-sectional survey, but which also contains an individuals’ lagged outcome-score. Given longitudinal weights for the UKHLS Covid-19 survey are not currently produced, we are only able to correctly adjust for unequal selection probabilities and panel attrition using cross-sectional weights.
Applying this data structure to our multinomial models, for the pandemic-period analysis our outcome is a three-category variable measuring ‘change in cohesion between the Covid-19 Wave and Wave 6’, while covariates are measured at their Covid-19 Wave value. For the pre-pandemic period, our outcome is a three-category variable measuring ‘change in cohesion between Wave 6 and Wave 3’, with all covariates measured at their Wave 6 value. We repeat the same models on a longitudinal unweighted sample of individuals present in Wave 3, Wave 6 and Covid-19 Wave and the results are substantively similar to the weighted findings.
Results
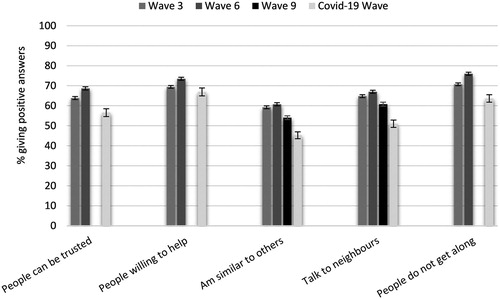
shows the percentage of people expressing ‘positive’ opinions about each of the five perceived-cohesion statements at three points in time: Wave 3 (2011/12), Wave 6 (2014/15) and the third Covid-19 Wave (June 2020). Additionally, we report the percentage of people expressing ‘positive’ statements about ‘talking to neighbours’ and ‘being similar to neighbours’ at Wave 9 (2017/18). Across all sub-dimensions, the percentage of people reporting positive feelings about their community was the lowest during the pandemic-period. Except for ‘people’s willingness to help their neighbours’, the proportion of those expressing positive views declined by more than 10 percentage-points (pp). The decline in ‘local people’s willingness to help their neighbours’ was statistically significant but the net difference was much smaller. In terms of ‘talking to neighbours’ and ‘being similar to neighbours’, a decline in expressing positive views was already visible in Wave 9. However, the decline observed between Wave 9 and Covid-19 Wave (1.5–2 years difference) was almost two times larger (about 10pp) than between Wave 6 and Wave 9 (3 years difference; decline by about 6 pp). Given high correlations between all perceived-cohesion measures, it is reasonable to expect similar patterns also occurred for the other three measures. Such patterns suggest that some of the decline in perceived-cohesion between 2014/15 (Wave 6) and June 2020 (Covid-19 Wave) was already observed in 2017/18 (Wave 9); however, the scale of decline was much smaller. In the subsequent analysis, we refer only to the changes between Wave 3 and 6 and between Wave 6 and Covid-19 (unless explicitly stated otherwise) for which we have full data for our five-item cohesion scale.
Figure 1. Percentage of people reporting positive opinions about social cohesion in their neighbourhood (sum of ‘strongly agree’ and ‘agree’ answers to positive statements and sum of ‘strongly disagree’ and ‘disagree’ answers to negative statements) for each of the five social cohesion dimensions at Wave 3, Wave 6, Wave 9 (two statements only), and Covid-19 Wave. Weighted results with 95% CI. (Data: Understanding Society, University of Essex, Institute for Social and Economic Research Citation2020)
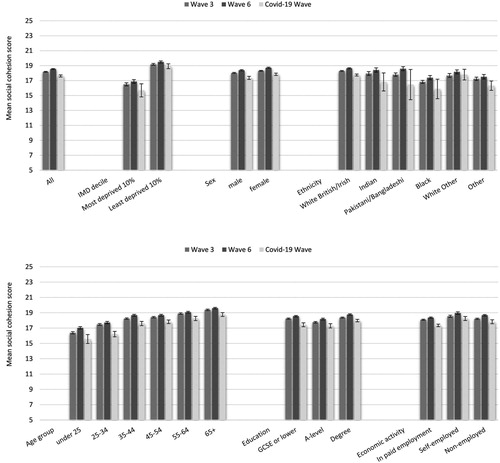
The next question is whether all individuals experienced a similar decline in their reported cohesion during the pandemic or whether certain sub-groups saw particularly large/small declines. demonstrates that levels of perceived-cohesion across all socio-demographic groups, and those living in deprived and non-deprived neighbourhoods, was at its lowest during the pandemic period, compared to the two pre-pandemic periods. In other words, the pandemic seems to have had a negative effect on perceived-cohesion among all people/places. That said, some groups saw their cohesion decline more than others. People living in the 10% most (compared to the 10% least) deprived neighbourhoods, those with less than A-level education (compared to degree holders), younger age groups (under 35) (compared to those over 35), and those from certain ethnic minority backgrounds (Pakistanis/Bangladeshis, Black and ‘Other’Footnote9) (compared to White British) experienced larger declines. The higher decline in cohesion among those living in the most deprived communities and the aforementioned ethnic minority groups seem to be a new phenomenon compared to the patterns observed pre-pandemic. As discussed earlier, perceived-cohesion seems to have already declined between 2014/15 (Wave 6) and 2017/18 (Wave 9); however, this decline was not particularly felt by minority individuals or those in less affluent neighbourhoods (see: Table A2 in supplemental online material).
Figure 2. Average social cohesion score at Wave 3, Wave 6 and Covid-19 Wave by IMD decile, sex, ethnicity, age group, education and economic activity. Weighted results with 95% CI. (Data: Understanding Society, University of Essex, Institute for Social and Economic Research Citation2020)
As mentioned, the observed lower level of cohesion in and (showing a negative net change over time) could be due to a greater stability of cohesion over the pre-pandemic period and more negative change over the pandemic period. An alternative possibility is that significant change was occurring during both the pre- and pandemic period. If so, the pandemic decline in levels could be driven by more people experiencing a negative change over the pandemic-period (Wave 6 to Covid-19 wave), compared to the pre-pandemic-period Wave 3 to Wave 6, and/or a lower proportion experiencing positive changes.
To explore this, shows the percentage of people reporting positive/negative changes in their cohesion over the pre-pandemic and pandemic periods. Importantly, cohesion across both periods appears rather fluid and not too dissimilar: over the pre-pandemic period, 52% of individuals changed their perceptions while 58% changed during the pandemic-period. However, the main change during the pandemic is that the proportion experiencing a negative change increased by 17pp but also that the proportion experiencing a positive change dropped by 10pp.
Figure 3. Percentage of people experiencing positive and negative changes in the overall social cohesion score in two time periods: between Wave 3 and Wave 6 (2011/12–2014/15); and between Wave 6 and Covid-19 Wave (2014/15-June 2020). Weighted results with 95% CI. (Data: Understanding Society, University of Essex, Institute for Social and Economic Research Citation2020).
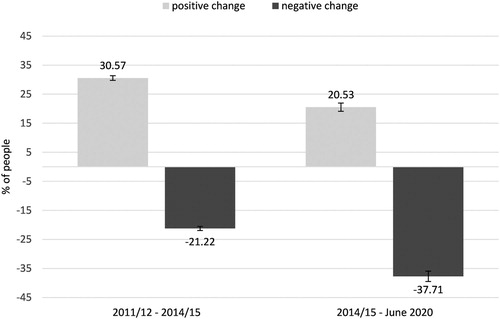
Figure 4. Adjusted predicted probabilities from multilevel multinomial logistic regression models predicting the likelihood of experiencing positive change, negative change and no change in perceived cohesion between Wave 3 and Wave 6 and between Wave 6 and Covid-19 Wave for all covariates. Weighted results with 95% CI. (Data: Understanding Society, University of Essex, Institute for Social and Economic Research Citation2020)
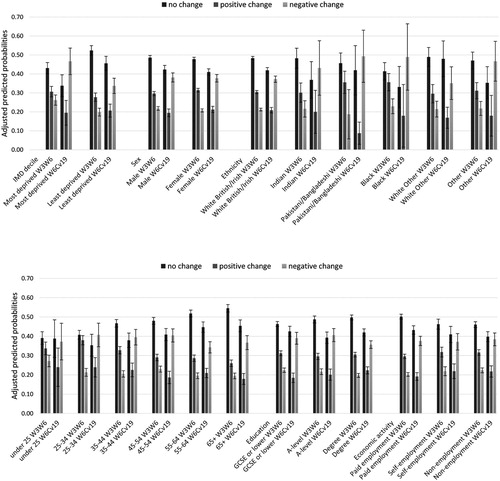
We next explore whether people with certain socio-demographic characteristics were more likely to experience positive/negative changes over the pandemic-period, and whether these patterns of changes during the pandemic-period appear similar or different from pre-pandemic patterns. To this end, we apply multinomial multilevel logistic regressions to compare the likelihood of experiencing ‘positive’ or ‘negative’ change relative to experiencing ‘no change’ (reference category) over the pandemic and pre-pandemic periods. shows adjusted predicted probabilities calculated from the models with all covariates. The full model coefficients can be found in the supplemental online file (Table A3A and Table A3B). In terms of age, in the pre-pandemic period, the youngest group (under 25) was the most likely to change their perceived local cohesion (in both the positive and negative direction). However, over the pandemic period, the age gradient has flattened i.e. all ages were generally more likely to report a negative change in cohesion and less likely to experience a positive change. Similarly, both men and women, and people from different economic activity groups, were equally likely to experience more negative changes in perceived-cohesion over the pandemic-period compared to pre-pandemic period.
In terms of education, people with lower formal skills (GCSE or lower) were more likely to report both positive and negative changes in the pre-pandemic period compared to degree-level. During the pandemic, however, lower skilled were less likely to experience positive change, whereas their likelihood of negative change was similar to those with degrees. Thus, it is mainly the decline in proportion reporting a positive change behind the bigger decline in perceived-cohesion among lower skilled individuals.
Pre-pandemic and pandemic patterns of positive/negative change have also somewhat shifted amongst people living in the most and least deprived neighbourhoods. During both periods, rates of negative change were higher in the 10% most deprived neighbourhoods than in the 10% least deprived areas. However, in the pre-pandemic period, rates of positive change were also higher in the most compared to the least deprived areas. During the pandemic, however, the likelihood of experiencing positive change dropped more in deprived compared to affluent areas (and became equal to rates of positive change in affluent areas). Yet, rates of negative change continued to be higher in deprived areas. Taken together, it was thus a bigger decline in the likelihood of experiencing positive change during the pandemic (relative to the pre-pandemic period) that likely explains the bigger drop in cohesion in the most deprived areas. Importantly, these differences hold after adjusting for individual-level covariates, suggesting cohesion shifted more in disadvantaged areas even after accounting for their compositional makeup.
Another shift in the patterns of change over the pandemic period occurred among some of the ethnic minority groups. During the pandemic period, people from Black and ‘Other’ ethnic minority backgrounds were much more likely than those from White British/Irish background to experience negative changes, and those from Pakistani/Bangladeshi backgrounds were much less likely to experience positive changes. During the pre-pandemic period, it was only the Black groups who had more fluid perceptions about cohesion (they were more likely to experience changes in both directions). Thus, it was both an increase of rates of negative change for some groups and a decline of rates of positive change for other groups that contributed to the larger drop in perceived-cohesion among minority groups, relative to the pre-pandemic period.
We also applied this same modelling approach for the changes in ‘talking to neighbours’ and ‘being similar to neighbours’ occurring between 2014/15 (Wave 6) and 2017/18 (Wave 9) i.e. where Wave 6 to Wave 9 is now treated as the pre-pandemic period. Reassuringly, those results demonstrate consistency with those in which we use Wave 3 to Wave 6 as the pre-pandemic period.Footnote10 In other words, the higher decline in perceived-cohesion in the deprived neighbourhoods, among certain ethnic minority groups, and among lower skilled, that is observed during the pandemic is substantively different from patterns of change occurring prior to the pandemic.
It is difficult to speculate about the reasons behind the negative changes among ethnic minorities without further analysis, beyond the scope of this paper. One explanation is that minority-groups are also more economically/socially vulnerable (Platt and Warwick Citation2020). This might lead to greater negative changes across other aspects of their lives, contributing to more negative change in cohesion.
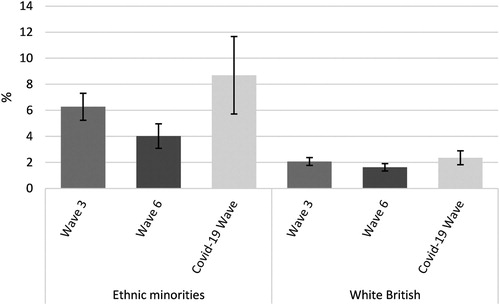
Yet, another explanation is that the Covid-19 crisis may have increased inter-ethnic divisions within communities. This might stem, in part, from negative rhetoric about the virus being associated with certain ethnicities, or ‘foreigners’ (e.g. Gover et al. Citation2020). The possibility of increased racial attacks seems plausible based on preliminary analysis of the UKHLS. shows that the proportion of people with ethnic minority backgrounds who reported that racial insults/attacks are ‘very common’/‘fairly common’ increased from 4% to about 9% during the pandemic-period (after decreasing by about 2pp between Waves 3–6). This could suggest ethnic minorities saw their cohesion decline during the pandemic because intergroup tensions worsened.
Figure 5. Percentage of Ethnic Minority and White British respondents stating that racial insults and attacks are very/ fairly common in their local area at Wave 3, Wave 6 and Covid-19 Wave. Weighted results with 95% CI. (Data: Understanding Society, University of Essex, Institute for Social and Economic Research Citation2020)
Discussion and conclusion
This paper aimed to perform the first systematic test of whether the Covid-19 pandemic led to changes in perceptions of neighbourhood cohesion. The first key finding is that, despite the positive prognoses across media/political narratives, cohesion appeared to decline quite substantially around the pandemic, compared to pre-pandemic periods. This decline occurred across all five dimensions of cohesion: both behavioural dimensions of ‘talking to neighbours’ (which might be expected given requirements to socially distance), but also perceptual dimensions, such as neighbour-trust. Due to data availability, we were only able to compare the levels of all the ‘social cohesion scale’ components measured in June 2020 with baseline-levels observed in 2014/15. This of course is a limitation as the observed decline in perceived neighbourhood cohesion could have happened before the pandemic and might have been due to societal tensions around 2016 EU referendum, climate change activism, or polarising debates of ‘young’ against ‘old’. However, our comparison of the two perceived-cohesion indicators measured in June 2020 that were also measured in 2017/18 provide initial evidence that both the scale of the decline, as well as the patterns of positive/negative change among different groups, appear qualitatively different during the pandemic. Furthermore, we cross-validated our UKHLS findings using the Community Life Survey (CLS) on neighbour-trust between 2012/13 and 2018/19, which showed a small drop in neighbour-trust between 2015/16 and 2016/17, after which levels of cohesion remained stable up to 2018/19 (see: Figure A6 in the supplemental online material). This suggests the decline observed in UKHLS data during the pandemic is less likely to be simply a continuation of a declining trend in cohesion that began in 2014/15 (given trust levels in the CLS data looked stable from 2016/17 onwards). Instead, the decline likely represents something triggered during the pandemic-period itself.
In order to unpack whether the decline in overall levels of cohesion was simply driven by people becoming more pessimistic about their neighbourhoods, we explored patterns of positive/negative changes in cohesion between 2014/15 and June 2020 with the patterns across the pre-pandemic period (2011/12- 2014/15). During both pandemic and pre-pandemic periods there was a significant amount of flux (people experiencing both positive and negative changes), which is something often masked by the seemingly stable aggregate levels of cohesion. Furthermore, this revealed that the pandemic decline in cohesion was primarily driven by an increasing proportion of individuals experiencing a negative change compared to the pre-pandemic period (38% compared to 21%) but also a decreasing proportion of individuals experiencing a positive change over the pandemic (compared to pre-pandemic) period (20% compared to 30%).
The second key finding is that the negative impact of the pandemic on perceived-cohesion was not shared equally across all people/places. More vulnerable groups, including residents of disadvantaged communities, those with lower education, and certain ethnic minorities such as Pakistani/Bangladeshis, ‘Other’ minorities and Blacks, all experienced a greater decline compared to their less vulnerable counterparts. For several minority-groups, alongside residents of disadvantaged communities, this stronger decline had the additional pernicious effect of widening pre-existing inequalities with their White British and affluent-area counterparts. This widening of inequalities stems predominantly from a larger increase in the proportion of vulnerable individuals experiencing a negative change in perceived-cohesion during the pandemic- (compared to pre-pandemic) periods. This was true using both the social cohesion scale between 2014/15 (pre-pandemic period) and June 2020 (pandemic-period) as well as the two measures (‘talking to neighbours’ and ‘feeling similar to others’) additionally available for the comparisons between the more recent pre-pandemic period (2017/18) and pandemic-period (June 2020). However, for some of these groups, the widening of gaps in cohesion is also driven by a larger decrease in the proportion experiencing a positive change. For example, Blacks and residents of disadvantaged communities were, in the past, likely to experience more flux (more positive and negative changes). In the pandemic period, however, their likelihood of experiencing positive change significantly decreased whereas their likelihood of experiencing negative change remained higher, compared to those from more affluent neighbourhoods, and those from White British background. Therefore, the larger drop in cohesion for certain groups during the pandemic was as much about increasing rates of negative change as about curtailing the positive flux apparent in the pre-pandemic period. In sum, this paper adds perceptions of cohesion to the list of areas of people’s lives worsening during Covid-19. It also presents evidence that the scale of decline in perceived-cohesion has not been shared equally across society, and some groups suffered much more. The only positive signal emerging was that the smallest decline in cohesion was in people’s perceptions that neighbours were ‘willing to help one another’. Therefore, despite appearing to withdraw from their communities, individuals still maintained a belief that people were willing to help. Future research should explore whether the (more stable) declared willingness to help has turned into action e.g. providing informal help. Unfortunately, the data do not allow us to explore behavioural aspects of cohesion (e.g. informal helping behaviours), which may have responded differently to the pandemic relative to residents’ perceptions. Another possibility is that the apparent decline in perceived-cohesion on the neighbourhood-level, might have been compensated for by other forms of social capital, such as increased contact with, or reciprocity among, people’s strong ties (such as family, close friends) or weak ties beyond the neighbourhood (e.g. via online platforms). Both of these limitations are important avenues for future research.
Supplemental Material
Download MS Word (21 KB)REUS-2020-0214-File014.docx
Download MS Word (13.1 KB)REUS-2020-0214-File013.docx
Download MS Word (15.5 KB)REUS-2020-0214-File012.docx
Download MS Word (15.4 KB)REUS-2020-0214-File011.docx
Download MS Word (14.8 KB)REUS-2020-0214-File010.docx
Download MS Word (14.8 KB)REUS-2020-0214-File009.docx
Download MS Word (13.3 KB)Acknowledgments
We thank the two anonymous reviewers whose comments and critical suggestions greatly helped to improve this manuscript.
Disclosure statement
No potential conflict of interest was reported by the author(s).
Correction Statement
This article has been republished with minor changes. These changes do not impact the academic content of the article.
Additional information
Funding
Notes on contributors
Magda Borkowska
Magda Borkowska is a Senior Research Officer at the University of Essex, UK. Her main research interests include ethnicity, political participation and social capital. She is particularly interested in exploring how political behaviours and preferences are shaped by individual life courses.
James Laurence
James Laurence is a Research Fellow at the University of Manchester, UK, and a Visiting Fellow at the Wissenschaftszentrum Berlin für Sozialforschung, Germany. His major research interests include the study of inter-group relations and inter-group contact, civic engagement and social capital, and the role of ethnic diversity and segregation across communities in processes of social cohesion.
Notes
1 https://www.theguardian.com/world/2020/jun/05/neighbourliness-to-the-fore-its-been-the-highlight-of-our-lockdown; https://www.dailymail.co.uk/news/article-8134733/Tiny-acts-kindness-keeping-Britain-going-coronavirus-crisis.html
2 https://www.theguardian.com/uk-news/2020/feb/09/chinese-in-uk-report-shocking-levels-of-racism-after-coronavirus-outbreak; https://www.newyorker.com/news/letter-from-the-uk/the-rise-of-coronavirus-hate-crimes
4 For parsimony, we use the terms perceived cohesion and cohesion interchangeably.
5 We use the terms ‘local community’ and ‘neighbourhood’ interchangeably.
6 The exact question wording as well as the mean and standard deviation of social cohesion scale and each of the composite items is available in the supplemental online material (Table A1).
7 Index of Multiple Deprivation (IMD) is the official measure of area deprivation in England. It comprises seven domains: Income, Employment, Health, Education, Crime, Housing, and Living Environment. Source: https://www.gov.uk/government/statistics/english-indices-of-deprivation-2019
8 For further discussion of geographical units used in our analysis, please see supplemental online material (Table A5).
9 The small sample sizes of ethnic minorities in the Covid-19 Wave (and therefore large CI) mean that we ought to be cautions with interpretation of the results although the differences between means were statistically significant.
10 The full models’ coefficients are available in the supplemental online material (Table A4).
References
- Bauer, A. and Weber, E. (2020) ‘COVID-19: how much unemployment was caused by the shutdown in Germany?’, Applied Economics Letters, 2020 Jul 11: 1–6.
- Cagney, K. A., Sterrett, D., Benz, J. and Tompson, T. (2016) ‘Social resources and community resilience in the wake of superstorm sandy’, PLoS ONE 11(8): e0160824. doi:10.1371/journal.pone.0160824.
- Chang, S.-S., Stuckler, D., Yip, P. and Gunnell, D. (2013) ‘Impact of 2008 global economic crisis on suicide: time trend study in 54 countries’, BMJ: British Medical Journal 347: f5239.
- Couch, K. A., Fairlie, R. W. and Xu, H. ‘The Impacts of COVID-19 on minority unemployment: first evidence from April 2020 CPS Microdata’, (May 18, 2020). doi:10.2139/ssrn.3604814.
- Data: University of Essex, Institute for Social and Economic Research (2020) Understanding Society: waves 1-9, 2009–2018 and COVID-19 study, 2020: special licence access, census 2011 lower layer super output areas, [data collection], UK Data Service, SN: 7248 and SN: 8663. doi:10.5255/UKDA-SN-8663-1.
- Gover, A. R., Harper, S. B. and Langton, L. (2020) ‘Anti-Asian hate crime during the COVID-19 pandemic: exploring the reproduction of inequality’, American Journal of Criminal Justice 45(4): 647–67.
- Harlem, G. and Lynn, M. (2020) ‘Descriptive analysis of social determinant factors in urban communities affected by COVID-19’, Journal of Public Health. doi:10.1093/pubmed/fdaa078.
- Judt, T. (2010) The Memory Chalet, New York, NY: The Penguin Press.
- Jung, J. Y. (2019) ‘Socio-psychological recovery from disasters through the neighbourhood storytelling network: empirical research in Shinchimachi, Fukushima’, International Journal of Communication 13: 21.
- Killgore, W. D. S., Cloonan, S. A., Taylor, E. C. and Dailey, N. S. (2020) ‘Loneliness: A signature mental health concern in the era of COVID-19’, Psychiatry Research 290: 113–7.
- Kim, H. and Laurence, J. (2020) ‘COVID-19 restrictions and mental distress among American adults: evidence from Corona impact survey (W1 & W2)’, Journal of Public Health 1–18. https://www.ncbi.nlm.nih.gov/pmc/articles/PMC7499737.
- Lê, F., Tracy, M., Norris, F. H. and Galea, S. (2013) ‘Displacement, county social cohesion, and depression after a large-scale traumatic event’, Social Psychiatry and Psychiatric Epidemiology 48(11): 1729–41.
- Lim, C. and Laurence, J. (2015) ‘Doing good when times are bad: volunteering behaviour in economic hard times’, The British Journal of Sociology 66(2): 319–44. doi:10.1111/1468-4446.12122.
- Norris, F. H., Stevens, S. P., Pfefferbaum, B., Wyche, K. F. and Pfefferbaum, R. L. (2008) ‘Community resilience as a metaphor, theory, set of capacities, and strategy for disaster readiness’, American Journal of Community Psychology 41(1–2): 127–50.
- Platt, L. and Warwick, P. (2020) Are some ethnic groups more vulnerable to COVID-19 than others? Institute for Fiscal Studies.
- Putnam, R. D. (2000) Bowling Alone: The Collapse and Revival of American Community, New York: Simon & Schuster.
- Sampson, R. J., McAdam, D., MacIndoe, H. and Weffer-Elizondo, S. (2005) ‘Civil society reconsidered: the durable nature and community structure of collective civic action’, American Journal of Sociology 111: 673–714.
- Sibley, C. G., Greaves, L. M., Satherley, N., Wilson, M. S., Overall, N. C., Lee, C. H. J., Milojev, P., Bulbulia, J., Osborne, D. and Milfont, T. L. (2020) ‘Effects of the COVID-19 pandemic and nationwide lockdown on trust, attitudes toward government, and well-being’, American Psychologist 75(5): 618–630.
- Sirven, N. and Debrand, T. (2012) ‘Social capital and health of older Europeans: causal pathways and health inequalities’, Social Science & Medicine 75: 1288–95.
- Strauß, S. (2008) Volunteering and Social Inclusion: Interrelations between Unemployment and Civic Engagement in Germany and Great Britain, New York: Springer-Verlag.
- Stuckler, D., Basu, S., Suhrcke, M., Coutts, A. and McKee, M. (2011) ‘Effects of the 2008 recession on health: a first look at European data’, The Lancet 378: 124–5.
- Tackenberg B., Lukas T. (2019) ‘Resilience through social cohesion: a case study on the role of organizations’, in B. Rampp, M. Endreß, M. Naumann (eds) Resilience in Social, Cultural and Political Spheres. Wiesbaden: Springer VS. doi:10.1007/978-3-658-15329-8_16
- von Dawans, B., Fischbacher, U., Kirschbaum, C., Fehr, E. and Heinrichs, M. (2012) ‘The social dimension of stress reactivity: acute stress increases prosocial behavior in humans’, Psychological Science 23(6): 651–60.