
 ?Mathematical formulae have been encoded as MathML and are displayed in this HTML version using MathJax in order to improve their display. Uncheck the box to turn MathJax off. This feature requires Javascript. Click on a formula to zoom.
ABSTRACT
Using data from the 2002 and 2014 waves of the European Social Survey, enriched with contextual data, we examine the impact of perceived ethnic enclaves upon several social outcomes of their residents. Diversity studies usually find a strong negative relationship between social trust and increasing ethnic heterogeneity for majority members. What happens however in residential areas such as ethnic enclaves that offer more opportunities for bridging contacts for majority members and for bonding among migrants and minorities? Our results show that majority, 1st and 2nd generation residents of enclaves have on average poorer social outcomes than non-residents. Nevertheless, residential sorting forms a large part of the enclave penalty story when it comes to the well-being of all groups in the study and the levels of trust and perceived discrimination of the 2nd generation. Importantly, our study suggests that enclaves are not necessarily areas in which people are doomed to chronic unhappiness, and we do not find conclusive evidence that lack of exposure to outgroupers is to blame for lack of trust across ethnic boundaries. Poorer personal and regional economic conditions exacerbate the negative association of the enclave residents with trust, happiness and social distance.
1. Introduction
Ethnic enclaves are local residential areas in which migrants and minorities form a large proportion of the population while there is little presence of majority members (Waldinger Citation1994). Such areas can be culturally and economically distinctive and characterized by the increased presence of formal and informal community institutions and ethnic businesses (Zhou Citation2004) but their defining feature is the spatial concentration of non-majority members in the residential locality (Danzer and Yaman Citation2013; Poulsen et al. Citation2002)
Politicians can be quite negative about the effect of ethnic enclaves and see them as breeding ground for extremist ideas, and as the marker of social isolation from the mainstream for migrants and minorities (Cameron Citation2011). Yet, research shows that enclaves may have important benefits as well: they can provide economic opportunities and advice from co-ethnics in the first stages of the migration journey (Portes et al. Citation2005; Zhou Citation1994) alongside shielding effects for migrants and minority members that may otherwise be exposed to heightened levels of discrimination (Bécares et al. Citation2009; Nandi et al. Citation2020). Thus, migrants and minorities can actively seek ethnic enclaves and the concentration of co-ethnics and other migrants in such residential spaces for access to ethnic goods, positive social and cultural connections with in-groupers and reduced exposure to prejudice and stereotyping (Bécares et al. Citation2009; Portes and Zhou Citation1993; Zhou Citation2005). At the same time, enclaves can be associated with poorer job quality prospects on the part of 2nd generation minority members, increased competition between migrant groups (Damm Citation2009) and linguistic isolation that can result in the solidifying of bonding ties but lack of bridging ties to majority members (Koopmans and Schaeffer Citation2016).
This paper contributes to the literature in several ways. First, we investigate the association between residing in a perceived ethnic enclave across European countries and a variety of social outcomes to address concerns about the impact of the ethnic enclave on social unity. Similarly to the work of Semyonov et al. (Citation2007) and Semyonov and Glikman (Citation2009), this paper relies on a measure of perceived ethnic composition of the local residential area. We acknowledge and discuss the limitation of this measure further in the Data and Methods and the Discussion sections in addition to performing a variety of additional tests in the Supplementary online material which demonstrate alignment between the perception of the respondent and the ethnic composition of the region captured in the EU_LFS 2008 and 2014 modules. Second, using propensity score matching techniques, we account for compositional differences between residents and non-residents of the perceived ethnic enclaves. Ethnic enclaves can be less desirable neighbourhoods in which there is a greater opportunity to find cheaper rentals and social housing (Semyonov and Glikman Citation2009), and minority members may find themselves pushed into one because of housing discrimination (Boeri et al. Citation2015). If these local areas are more deprived and re-enforce competition between ethnic groups over jobs and resources (Feng et al. Citation2015), it is important to account for selection into them when considering their impact (Boeri et al. Citation2015; Damm Citation2009). Finally, we throw light on a variety of possible conflict and contact mechanisms and the heterogenous effect of the enclave that underlie differences between majority members, migrants and minorities in Europe.
2. Ethnic concentration and social outcomes
Do ethnic enclaves warrant the concern of politicians? This study focuses on a variety of social outcomes that can reinforce or undermine the cohesiveness of societal units: social trust and subjective well-being (positive) on one hand; social distance and perceived discrimination (negative) on the other. Social trust has been extensively studied and treated almost as a universal measure of community well-being and prosperity (Uslaner Citation2018). Subjective well-being also can be used as an indicator of a vibrant society (Zorlu and Frijters Citation2019). High levels of social distance expose the cracks in the relationship between different ethnic groups and are a signal of ethnic tensions (Smith et al. Citation2014; Goldschmidt and Rydgren Citation2018), often seen as responsible for segregation and failed attempts at integration. In the same vein, increasing perceived discrimination can be considered a manifestation of negative underlying dynamics that erode cohesion and contribute to the poor mental health of the individual experiencing harassment (Schofield et al. Citation2016).
Many studies have looked at how diversity is related to each of these social outcomes, and we consider each in turn in greater detail below. But why should we consider ethnic enclaves in particular? Ethnic enclaves, by definition, represent a specific case – they are characterized by a relatively low presence of majority members and high density of minorities either belonging to one or indeed several migrant and minority groups (Portes and Zhou Citation1993; Zhou and Kim Citation2006) which can have a strong attachment to the local area (Wang and Ramsden Citation2018). If tensions arise because of the presence of heterogeneous groups in a local area and the competition between them (Blalock Citation1967), majority members may feel particularly threatened in ethnic enclaves in which they see themselves surrounded by outgroupers – residents belonging to an ethnic group different than their own (Vervoort et al. Citation2012). Threat indeed can arise and be reinforced as much by perceptions of relative position in the residential area as by the actual presence of migrant or minority groups (Koopmans and Schaeffer Citation2016; Liang et al. Citation2019). Thus, the study of the association between ethnic enclaves and social outcomes across several European countries is very timely and of substantial scholarly interest.
2.1. Social trust
Using the Social Capital Benchmark Study, Putnam (Citation2007) painted a vivid picture of the deterioration of social life and the fracturing of social glue in the US with increasing diversity identified as one of the main culprits. In Europe, some research has produced similarly pessimistic results (Tolsma and Van der Meer Citation2017; Gesthuizen et al. Citation2009; Dinesen et al. Citation2020); while others point to a range of possible explanations including socio-economic disadvantage and lack of contact between groups that can foster reliability (Demireva and Heath Citation2014; Laurence and Heath Citation2008; Sturgis et al. Citation2014). Even with Putnam’s Social Capital Benchmark Study data, different conclusions have been reached and compositional differences can be an important part of the story (Abascal and Baldassarri Citation2015). Little attention has been paid both to the impact of residential sorting and trust within the ethnic enclaves, in general. This paper addresses that gap. The measure of social trust in the ESS data focuses on trust in strangers as in contrast to particularized trust that focuses on trust in co-ethnics or neighbours specifically.
2.2. Subjective well-being
High presence of co-ethnics or other non-majority residents can have positive effects on the well-being of migrants and minority individuals (Jonsson and Demireva Citation2018; Bécares et al. Citation2011; Schofield et al. Citation2016). There has been some evidence with ESS data that where minorities live matters for subjective well-being (Zorlu and Frijters Citation2019) although individual predictors such as income should matter most (Bartram Citation2011). With UK data Liang et al. (Citation2019) show that the negative impact of the increased share of migrants is pronounced among those without a job and Yan et al. (Citation2019) show that there are important differences between migrants and the 2nd generation – heterogeneity driven by generational status and economic status is important and we will explore it in this study as well. Subjective well-being has been little studied in relation to the ethnic enclave and our study will provide important evidence in this respect.
2.3. Social distance
Ethnic density and preferences for ethnic concentration can be very much related to dynamics of social distance and residential segregation (Fossett Citation2006). High levels of perceived social distance are often equated with increased conflict between ethnic groups (Goldschmidt and Rydgren Citation2018). Ethnic enclaves and spaces of ethnic concentration are usually hypothesized to increase social distance among migrants and minorities as there is little opportunity for the creation of inter-ethnic ties in such areas – residents may indeed experience isolation from the mainstream. This is however not true for majority members: they would have more opportunities to form inter-ethnic ties with migrants and minorities. Within the threat framework, majority residents of the enclave who find themselves in the increased presence of an outgroup may experience enhanced sense of threat to their resources and their way of life that will consequently exacerbate the conflict and social distance between the groups present in the enclave. Some support has been found for the postulates of the threat and high-visibility framework among majority members – there is increased fear of victimization in ethnic enclaves (Semyonov et al. Citation2012) or strong anti-immigrants attitudes (Semyonov and Glikman Citation2009) although the latter resentment can also be pronounced in areas in which there is little presence of migrant or minority out-groupers (Kawalerowicz Citation2021). The present focus on social distance will shed further light on the dynamics of conflict and cooperation between residents of different ethnic groups in the enclave.
2.4. Perceived ethnic discrimination
The relationship between diversity and perceived discrimination is not conclusive. Bécares et al. (Citation2009, Citation2011) show that ethnic density can have a shielding effect on the experience of racism and mental health, and in mitigating the negative impact of deprivation. Using UK data, Nandi et al. (Citation2020) show that the relationship between perceived discrimination and mental health is exacerbated in areas of strong presence of co-ethnics which the authors interpret in line of the high visibility and threat framework. Perceived ethnic discrimination has been studied with European Social Survey data (André and Dronkers Citation2017) as a function of religiosity and economic threat, and groups size – proxied by the size of the immigrant group in the country of residence however not in relation to ethnic homogeneity per se or the ethnic enclave. Our study will thus further contribute to this discourse by providing evidence across European societies.
2.5. Residential sorting and mechanisms at play
Residential sorting is likely to play a role in defining the impact of the ethnic enclave and should be accounted for.
2.5.1. Conflict
Conflict and competition (real or perceived) between ethnic groups (Blalock Citation1967) can be responsible for a negative effect of the ethnic enclave on trust. Majority members experiencing greater diversity may feel their economic and political power questioned and think that the resources to which they are entitled have been usurped by out-groupers (Vervoort et al. Citation2012).
There are several measures of conflict that are standardly used in the diversity literature. Fear of crime can be strong in areas perceived as dominated by out-groupers as shown by other research based on European data (Semyonov et al. Citation2012). Economic resources as proxied by the regional employment levels can also play a role. Previous studies find little evidence for direct competition for jobs at the regional level however there is some evidence at the local level for increased competition between migrants and majority members (Dustmann et al. Citation2008, Dustmann et al. Citation2010), with migrants affecting majority members’ employment probability negatively (Dustmann et al. Citation2017), particularly those at the bottom of the economic hierarchy (Manacorda et al. Citation2012). Majority members residing in areas with high concentration of out-groupers can be susceptible to these negative effects. Demireva and Zwysen (Citation2021) using the ESS find that living in a perceived ethnic enclave particularly affects the economic outcomes of migrants and minorities rather than those of the majority.
2.5.2. Contact
Enclaves present different opportunities for interaction between ethnic groups. On one hand, they increase the chances of majority members to come into contact with migrants and minorities and to form bridging ties. Bonding ties can also be reinforced if there is conflict, real or perceived between the different groups – which can lead to the formation of ‘defended’ neighbourhoods and ethnic strongholds (Green et al. Citation1998). Previous work that uses the European Social Survey finds that diversity increases both the frequency of positive but also negative inter-group contact for majorities (Laurence and Bentley Citation2018). Migrants and minorities are more likely to form contacts with other minorities, but have fewer opportunities to engage with the mainstream and in bridging ties with the majority (Vervoort et al. Citation2012) in spatially concentrated ethnic areas. Bridging ties can have very many positive effects by fostering further socio-cultural integration of migrants and 2nd generation minority members through improving language skills, sharing of information and providing useful social networks (Lancee Citation2012; Semyonov and Glikman Citation2009; Vervoort et al. Citation2012). If bonding remains strong, we can expect continuous rejection of out-groupers on both sides (Vervoort Citation2012)
Language fluency may also matter as it is related to opportunities to have a connection with the mainstream society and avoid social isolation (Van Tubergen and Kalmijn Citation2005).
2.6. Research expectations
Following previous research, we formulate several research expectations.
2.6.1. Among majority members
We expect the threat framework to be particularly salient. Thus, the residence in the ethnic enclave which proxies increasing exposure to ethnic diversity and higher visibility of minorities will be negatively associated with social outcomes for majority members (decreased trust and subjective well-being, increased social distance and perceived discrimination). It follows that accounting for conflict measures would alleviate this difference between majority enclave residents and non-residents as tensions can be due to competition for limited resources.
2.6.2. Among migrants and the 2nd generation
Following the literature, we expect the enclave to have some negative as well some positive effect on the social outcomes of migrants and minorities. Migrants and the 2nd generation in the enclave will have limited exposure to majority out-groupers which should strengthen their trust in particularized others, for example, co-ethnics while decreasing trust in strangers (which is captured in the measure of generalized trust in the ESS). Lack of contact can very well be the main mechanism behind a negative social impact for migrants and 2nd generation enclave residents which once accounted for should reduce the enclave penalty to zero. If ethnic enclaves present opportunities for shielding, we should witness reduced perceived ethnic discrimination and increased subjective well-being for migrant and 2nd generation enclave residents.
Finally, for majority, migrants and 2nd generation individuals alike, the negative difference between enclave and non-enclave residents in social outcomes is expected to be compounded by other vulnerabilities: e.g. by the absence of interethnic ties and lack of proficiency in the language of the majority, or for those who face greater levels of deprivation in the local area.
3. Data and empirical strategy
3.1. Outcomes
We study four main social outcomes: trust, subjective well-being social distance and ethnic discrimination. We consider them for migrants, 2nd generation and majority members separately.Footnote1 We use the European Social Survey (ESS); a cross-national representative dataset which included modules on immigration in 2002Footnote2 and 2014Footnote3 and includes the EU-15 member states as well as Norway.Footnote4 After listwise deletion of missing cases, the sample consists of 28,333 respondents, of whom 2337 are 1st generation and 1820 are 2nd generation.
3.1.1. Social trust and subjective well-being
Social trust is measured as a scale of three items coded on an 11-point scale: most people try to take advantage or be fair; most people can be trusted or you can’t be too careful; most of the time people are helpful or they look out for themselves. These are combined in a scale where a higher score indicates more trusting, with a Cronbach’s alpha of 0.76. The ESS also includes a question on how happy respondents are, ranging from extremely unhappy to extremely happy on an 11-point scale which is our measure of subjective well-being.
3.1.2. Social distance
Social distance is a scale combining two questions where respondents are asked to think of people who have migrated into the country and are of a different race or ethnic group from the majority, and how much they would mind if they married a close relative; or if those were appointed as their boss.Footnote5 These two questions are asked on an 11-point scale ranging from not minding at all to minding a lot. The combined scale has a Cronbach’s alpha of 0.83, with a higher score indicating higher social distance.
3.1.3. Perceived discrimination
We measure perceived discrimination through respondents’ answers on whether they are a member of a group discriminated against in their country because of their colour or race; nationality; ethnic group; language; or religion. This is a dichotomous variable.
3.1.4. Defining the ethnic enclave
In 2002 and 2014 respondents were asked how they would describe the local area where they currently liveFootnote6 in terms of the presence of members of a minority race or ethnic group with the answer categories: almost none; some; many. We dichotomize this variable to distinguish respondents living in an ethnic enclave – an area with high concentration of migrants and minorities (Zhou Citation2004) from those with some or almost none. Around 10% of the majority, 25% of migrants and 19% of 2nd generation individuals live in perceived ethnic enclaves defined as such.
While we would ideally use the share of migrants or minorities in the local area, no cross-nationally comparative European data exists at the local level. Descriptively, we have compared the regional average of living in an ethnic enclave to the actual share of migrants and 2nd generation individuals in a region – see Figure S.1 in the supplementary materials; and find alignment between the measure of regional ethnic composition found in the EU LFS 2008 and 2014 ad hoc modules (the closest we can get to measuring ethnic residential density) and our ESS perceived measure of the ethnic enclave.
3.2. Methodological strategy
3.2.1. Main effect
Individuals cannot be randomly assigned to live in an ethnic enclave. Instead, we can study the difference in outcomes that are observed for an individual living in such an enclave and an individual who is not but is otherwise very similar by matching them on a range of covariates (observable characteristics that are likely to have driven residential selection in the first place).Footnote7 First, we estimate the effect (Δ) of living in an ethnic enclave on our three outcomes after accounting for selection into these areas. The propensity score p(x) estimates the probability of living in an ethnic enclave conditional on a set of observed characteristics X (Caliendo and Kopeinig Citation2008). We estimate the average treatment effect for the treated separately for majority members, migrants and minorities – each of these groups is likely to be exposed to different set of unobservable characteristics and separating the models by broader ethnic group allows us to somewhat address this issue. The ESS data allows us to balance enclave and non-enclave residents in great detail using their background information (for example, by including a range of parental background and household variables), thus producing a control and treatment group similar on several characteristics. Although both PSM and OLS methods assume no unobserved confounders, with PSM we can produce a range of sensitivity tests to check the robustness of the results to thoseFootnote8 and we elaborate further on sensitivity tests in Table S.4 in the Supplementary Material.
(1)
(1)
(2)
(2) There are several factors we consider in the matching: individual socio-demographic, area, and survey characteristics detailed in the Supplementary Material.
Several matching algorithms were tested (not shown here) and the best balance overall as well as an acceptable match for all instances was obtained by matching on 5 nearest neighbours with replacement. A replication package for all analyses shown here is available on-line (Zwysen and Demireva Citation2021).
3.2.2. Mechanisms
The second step in our analysis includes the addition of proxies for conflict and contact to a model estimated through inverse probability weighted regression adjustment. Selection is modelled through logistic regression as in Equation (2) and expected outcomes are obtained through separate regressions for enclave and non-enclave residents, weighted by the inverse propensity score. We use this method to obtain the total enclave effect (Equation 1) and the direct enclave effect obtained after including indicators for conflict and contact (M) in the outcome equation (Equation 3b). The percentage change in the estimated enclave effect after including the conflict or contact mechanism M (Equation 3c) then indicates the share of the total effect that is accounted for by conflict/contact predictors M. We include each variable separately and then jointly for conflict and contact.
(3a)
(3a)
(3b)
(3b)
(3c)
(3c)
Conflict is measured through factors that can indicate strife and competition. First, we include the employment rate at the regional levelFootnote9 estimated through the EU Labour Force Survey (LFS) in 2002 and 2014 to account for resources in the local labour market and overall deprivation. The regional level is much larger than the locality, but it does provide some indication of differences in resources and opportunities across the sample. Second, we include a dummy variable indicating the respondent was a victim of burglary or assault in the last 5 years – crime being an oft-cited indicator (Semyonov et al. Citation2012) of conflict in the literature, and third is a dummy indicating whether respondents feel unsafe walking alone at night in their local area.
Contact is approximated through including a dummy variable indicating whether respondents speak the host country language as their main language to proxy socio-cultural integration, and through a question measuring close friendships with migrants/minorities.Footnote10 The question of the main language varies very little among the majority; it is also expected to have little effect on them.
3.2.3. Heterogeneous effects
We further analyse whether the relations between living in an enclave and the outcomes depend on own individual contacts – through having minority friends and speaking the language of the country at home – or by regional characteristics – such as the employment rate and the presence of minorities in the region. This is done through OLS regression including all controls and interacting enclave residence with the different moderators.
4. Results: the impact of the ethnic enclave on social outcomes
4.1. Average differences between groups
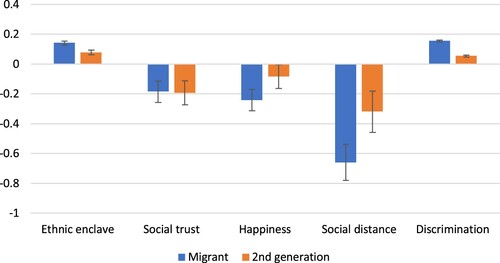
There are substantial differences between majority, migrants, and 2nd generation enclave residents and non-enclave residents in terms of social trust, social distance and ethnic discrimination. shows the average difference to the majority of migrants and the 2nd generation within a country and year. On average, migrants stand out as most likely to live in an enclave, having the lowest levels of subjective well-being, and highest rates of experiencing discrimination. 2nd generation minority members however also report lower social trust, lower happiness, and a higher rate of discrimination if residing in an enclave. Both migrants and the 2nd generation report lower levels of social distance compared to the majority members in the enclave which aligns with the threat framework propositions.
Figure 1. Difference from the majority (with 95% confidence interval).
Notes: The figure shows the average difference and 95% confidence interval in living in an ethnic enclave, social trust, happiness, social distance and discrimination for migrants and the 2nd generation compared to the majority, controlling for country by year fixed effects.
The section on selection and Tables S1 and S2 in the supplementary material discuss the issue of selection into the enclave in more detail. Table S3 in the appendix shows the average descriptions for the whole sample.
4.2. Accounting for residential sorting and compositional effects
compares the average difference in social trust, social distance and ethnic discrimination and subjective well-being between those living in an ethnic enclave and their counterparts (mean difference) with the estimate after matching (matched difference accounting for selection on socioeconomic characteristics) for our three major groups: majority members, migrants and the 2nd generation.
Table 1. Living in ethnic enclave before and after matching.
The mean difference rows suggest that majority, migrants and minority residents of ethnic enclaves are on average less likely to trust, report higher levels of social distance and perceived discrimination, and worse subjective well-being. Yet, socio-demographic characteristics are very salient to our understanding of the negative average effect of the enclave. Accounting for this selection does make a pronounced difference – it either attenuates greatly the negative effect of the enclave (on social trust for majority members and migrants, on discrimination for migrants, on subjective well-being for minorities) or the significance of the association completely disappears (on social trust and discrimination for the 2nd generation, on social distance for the majority, on subjective well-being for the majority individual and migrants).
Compositional differences clearly matter; and yet, they cannot fully account for the still pronounced decline of social trust for majority residents of enclaves and migrants; the levels of perceived discrimination of majority members and migrants; and a decline in subjective well-being of the 2nd generation. We next investigate whether conflict or contact can be the driving force behind this pattern.
4.3. Mechanism: conflict and contact
In this section, we test whether conflict and contact measures form part of the mechanism underlying the negative enclave effect. (majority), (migrants), and (2nd generation) show two things: the association between our predictors and residing in the ethnic enclave (Column 1), and the changes in the difference between enclave and non-enclave residents on our social outcomes when including conflict and contact predictors in the models (Columns 2, 3 and 4).
Focusing on Column 1 in , the regional employment rate is negatively associated with living in an ethnic enclave (but significantly only for migrants), while fear of crime and being victim of crime are positively and significantly associated with residing in the enclave. Thus, competition for scarce resources and social disorganization can potentially be behind a negative effect of the enclave on social outcomes as hypothesized in the literature (Laméris et al. Citation2018; Semyonov et al. Citation2012). All groups residing in the enclave are more likely to have many minority friends, and less likely to speak as their main language the majority language at home. For migrants and the 2nd generation then, reduced contact with the majority may be important.
Table 2. Conflict/contact mechanism for the majority: effect (s.e.) of living in ethnic enclave.
Table 3. Conflict/contact mechanism for migrants: effect (s.e.) of living in ethnic enclave.
Table 4. Conflict/contact mechanism for the 2nd generation: effect (s.e.) of living in ethnic enclave.
Overall, introducing conflict and contact measures in our models does not alleviate the difference between enclave residents and non-residents to the point to make it disappear. Conflict measures in general however attenuate further the negative association between residing in an ethnic enclave and social outcomes for majority members – substantially for social trust (β changes from −0.308 (se = 0.038) to −0.232 (se = 0.038)), social distance (β changes from 0.191 (se = 0.067) to 0.120 (se = 0.068)), and happiness (β changes from −0.109 (se = 0.042) to −0.061 (se = 0.043)). Introducing conflict measures has a similar impact in the models for migrants and minorities, although it does not mediate the relation between living in an enclave and social distance or happiness as much for the 2nd generation. It is notable that controlling for the respondent’s employment status makes very little difference.
Overall, the impact of contact appears to be modest. In terms of social distance for majority members, the introduction of contact measures further strengthens the negative association with residing in the enclave indicating that the impact of friendship ties on the reduction of ethnic barriers is more pronounced in areas outside of the enclave where there is less opportunity for such ties to be formed. Bonding contact reinforces the negative impact of the enclave on social trust for the 2nd generation as we would have expected (β changes to −0.385 (se = 0.113) from −0.344 (se = 0.112)).
4.4. Heterogeneous effects
We have hypothesized that the negative difference between residents and non-residents of ethnic enclaves will be pronounced for those in disadvantaged social situations, and when there are fewer opportunities to meet out-groupers. provide some evidence to support these research expectations.
Figure 2. Effect of living in ethnic enclave for the majority (95% C.I.). Notes: Estimated effect of living in an ethnic enclave, from a regression model controlling for socio-economic characteristics, background, country and year fixed effects. Results are shown from 7 different models: a model with the main effect, a model interacting living in ethnic enclave with employment status (inactive, unemployed, employed), interaction between living in an ethnic enclave and the main language, interaction between living in an ethnic enclave and the employment rate [showing 10th, 50th, and 90th percentile], and an interaction between living in an ethnic enclave and the share of minorities in the local region [10th, 50th, 90th percentile].
![Figure 2. Effect of living in ethnic enclave for the majority (95% C.I.). Notes: Estimated effect of living in an ethnic enclave, from a regression model controlling for socio-economic characteristics, background, country and year fixed effects. Results are shown from 7 different models: a model with the main effect, a model interacting living in ethnic enclave with employment status (inactive, unemployed, employed), interaction between living in an ethnic enclave and the main language, interaction between living in an ethnic enclave and the employment rate [showing 10th, 50th, and 90th percentile], and an interaction between living in an ethnic enclave and the share of minorities in the local region [10th, 50th, 90th percentile].](/cms/asset/9a8b8e15-2bd4-4188-b593-e27458a29205/reus_a_2006258_f0002_oc.jpg)
Figure 3. Effect of living in ethnic enclave for migrants (95% C.I.). Notes: Estimated effect of living in an ethnic enclave, from a regression model controlling for socio-economic characteristics, background, country and year fixed effects. Results are shown from 7 different models: a model with the main effect, a model interacting living in ethnic enclave with employment status (inactive, unemployed, employed), interaction between living in an ethnic enclave and the main language, interaction between living in an ethnic enclave and the employment rate [showing 10th, 50th, and 90th percentile], and an interaction between living in an ethnic enclave and the share of minorities in the local region [10th, 50th, 90th percentile].
![Figure 3. Effect of living in ethnic enclave for migrants (95% C.I.). Notes: Estimated effect of living in an ethnic enclave, from a regression model controlling for socio-economic characteristics, background, country and year fixed effects. Results are shown from 7 different models: a model with the main effect, a model interacting living in ethnic enclave with employment status (inactive, unemployed, employed), interaction between living in an ethnic enclave and the main language, interaction between living in an ethnic enclave and the employment rate [showing 10th, 50th, and 90th percentile], and an interaction between living in an ethnic enclave and the share of minorities in the local region [10th, 50th, 90th percentile].](/cms/asset/9b89612c-4c7f-443b-af98-766a6fa6578e/reus_a_2006258_f0003_oc.jpg)
Figure 4. Effect of living in ethnic enclave for the 2nd generation (95% C.I.). Notes: Estimated effect of living in an ethnic enclave, from a regression model controlling for socio-economic characteristics, background, country and year fixed effects. Results are shown from 7 different models: a model with the main effect, a model interacting living in ethnic enclave with employment status (inactive, unemployed, employed), interaction between living in an ethnic enclave and the main language, interaction between living in an ethnic enclave and the employment rate [showing 10th, 50th, and 90th percentile], and an interaction between living in an ethnic enclave and the share of minorities in the local region [10th, 50th, 90th percentile].
![Figure 4. Effect of living in ethnic enclave for the 2nd generation (95% C.I.). Notes: Estimated effect of living in an ethnic enclave, from a regression model controlling for socio-economic characteristics, background, country and year fixed effects. Results are shown from 7 different models: a model with the main effect, a model interacting living in ethnic enclave with employment status (inactive, unemployed, employed), interaction between living in an ethnic enclave and the main language, interaction between living in an ethnic enclave and the employment rate [showing 10th, 50th, and 90th percentile], and an interaction between living in an ethnic enclave and the share of minorities in the local region [10th, 50th, 90th percentile].](/cms/asset/7cc0e051-696c-4f91-8b64-3d9a9ea0b04f/reus_a_2006258_f0004_oc.jpg)
Among majority members, the enclave penalty is smaller for those who are employed and who have many minority friends (for subjective well-being and social distance).Footnote11 The negative relation of living in an enclave and general trust is also weaker in regions where there are more minorities – in other words, regions in which enclaves may be the norm rather than the exception.
Among migrants, the negative enclave penalty is less pronounced for the employed (for trust and social distance). Those living in an enclave are more negatively affected in better regional economic circumstances – possibly because in such regions the beneficial/sheltering effect of an enclave is less important. Interestingly, smaller ethnic differences between the region and the enclave lead to increasing perceptions of discrimination.
Among the 2nd generation, we find that the enclave penalty is smaller for the employed (for social trust, subjective well-being and social distance) while bonding reinforces the penalty for some outcomes such as social trust and perceived discrimination but not others such as subjective well-being. As with migrants, greater alignment between the enclave and the regional ethnic composition strengthens the negative impact of the ethnic enclave in terms of perceived discrimination and aligns with the higher visibility interpretations of the threat theoretical framework. 2nd generation minorities are not affected by economic circumstances in the same way as migrants – the negative association of the ethnic enclave with discrimination is largest in areas with worse employment rates and all but disappears in regions that do better economically for the 2nd generation.
5. Discussion
Using the 2002 and 2014 waves of the European Social Survey, we find that living in a perceived ethnic enclave has a pronounced negative impact upon social outcomes: it decreases social trust and subjective well-being and increases social distance and perceived discrimination. Nevertheless, individual socio-demographic characteristics go a long way to explain the enclave penalty in terms of social distance and happiness (once selection on observables is accounted for, the significance of the difference between enclave and non-enclave residents disappears) – enclaves are areas in which individuals with poorer socio-economic profiles settle down. For social trust and perceived discrimination, the difference between enclave and non-enclave residents diminishes but disappears only for 2nd generation minority members. The literature generally ascribes a positive effect to spatially concentrated areas for migrants and minorities in terms of the experience of discrimination (Bécares et al. Citation2009), but our results align with these of recent studies (Nandi et al. Citation2020) which find mixed evidence of shielding. After accounting for residential sorting in our analyses, migrants continue to perceive greater levels of discrimination in enclaves whereas among the 2nd generation the significance of the positive relationship between perceived discrimination and enclave residence disappears but does not reverse.
We further examined what happens to the difference between enclave and non-enclave residents conditioning on conflict or contact variables. We however do not find that the enclave penalty disappears accounting for conflict or contact measures. In general, the introduction of conflict measures in our study such as the regional employment rate or lack of feelings of safety attenuates the difference between residents and non-residents of enclaves and had a more pronounced impact than contact measures. The role of contact in diminishing social distance for majority members is greater in areas in which there are fewer opportunities for such contact (outside of the enclave).
The examination of the heterogeneous effects suggests that it is particularly for the unemployed among majority, migrants and 2nd generation individuals for whom enclave penalty can be exacerbated in terms of trust, social distance and happiness (for the latter not among migrants). Bonding also is associated with increased social distance for all groups. We do not find evidence that the enclave provides shielding effects for migrants and minorities in terms of discrimination, but the enclave may have an important protective effect for the social outcomes of migrants in regions blighted by economic poverty.
There are several data limitations in this study. Among migrants and minorities, we cannot provide a finer distinction between in-groupers as in co-ethnics and extend the out-grouper framework to other migrants and minority groups not just majority members. Yet, we still have engaged with the main literature on threat and the ameliorating effect of contact and find ample evidence of the importance of resources. The measure of ethnic enclaves that we consider is based on the perceptions of respondents – we do not have information about the actual ethnic diversity of the local area but have provided additional tests in the Supplementary material that demonstrate an alignment between the ethnic composition of the region (captured through EU LFS data) and the perceptions of ethnic heterogeneity captured in the ESS. Indeed, previous research suggests that perceptions can have a strong impact on social outcomes above and beyond actual levels of ethnic concentration (Koopmans and Schaeffer Citation2016; Semyonov et al. Citation2012), and we can be confident that our measure captures these perceptions well irrespective of their accuracy. Propensity score matching techniques provide an account of the selection on observable characteristics, allow for the accounting of detailed background information to understand residential sorting but there may be a variety of unobserved characteristics that can make us under or overestimate the impact of the enclave. We have provided several sensitivity tests in the Supplementary material to such unobservables that allow us to have some confidence in our estimates. The measure of social distance in the ESS data refers to hypothetical migrants and we have assumed that respondents consider these to be outgroupers. The ambiguity of the measure is perhaps reflected in the lower degree of social distance that migrants and 2nd generation minority members report. What seems to happen in ethnic enclaves is a convergence towards the experience of social distance among the majority, albeit not statistically significantly so. Importantly, we do not know whether the ethnic residential experience of a respondent is reinforced by also working in an ethnic niche or ethnic economy (Zhou Citation2005) or whether diversity in the workplace experience helps counter the negative effects of residential segregation on social outcomes such as trust or social distance. Further work should aim to distinguish between the impact of enclaves and niches.
6. Conclusion
Our results suggest that residents of enclaves have poorer social outcomes than non-residents. The picture that emerges is however a complex one. Residential sorting forms a large part of the enclave penalty story when it comes to the well-being of all groups in the study and the levels of trust and perceived discrimination of the 2nd generation. Despite the fact that the latter are often the target of policy makers’ concern (Cameron Citation2011), we find little evidence to substantiate such worries. When it comes to social trust perceived enclaves in Europe do not seem conducive to the transcendence of group boundaries and the developing of solidarity and trust towards strangers among migrants and the majority. Is this because the enclave fosters primarily homogeneous networks and/or because of increased competition between groups? Our study suggests that in-group bonding is less of an impediment compared to threat explanations. Poorer personal and regional economic conditions exacerbate the negative association of the enclave residents with trust, happiness and social distance. The similarity of social distance patterns between majority and minority enclave residents also points to possible increased competition between groups – enclaves are heterogeneous environments for majority members but they can be heterogeneous environments for migrants and minorities in the sense that several ethnic 1st and 2nd generation groups can reside in these areas (Portes and Zhou Citation1993). When jobs and opportunities are scarce, tensions may arise between these groups that present a challenge to pro-social behaviour. What is more, the enclave may not shield migrant and minority individuals from discrimination especially if contact with negatively predisposed mainstream is maintained through workplaces and news consumption, and there is greater competition among ethnic groups in the enclave. Further research should seek to explore fine-tuned distinctions between ethnic enclaves and ethnic niches and between the variety of residents living in them to understand better the dynamics of inter-group solidarity. Importantly, our study suggests that enclaves are not necessarily areas in which people are doomed to chronic unhappiness, and we do not find conclusive evidence that lack of exposure to outgroupers is to blame for lack of trust across ethnic boundaries. Thus, similarly to other studies (Abascal and Baldassarri Citation2015; Letki Citation2008; Sturgis et al. Citation2011), we would encourage the more detailed consideration of structural features and failures – enclaves may be subject to underfunding which can undermine the social cohesion prospects of these communities. Managing diversity and enclaves, our research suggests, would entail commitment and resources to ensure these are not spaces blighted by deprivation, for residents with few economic prospects.
REUS-2021-0045-File007.pdf
Download PDF (523.8 KB)Disclosure statement
No potential conflict of interest was reported by the author(s).
Additional information
Funding
Notes on contributors
Neli Demireva
Neli Demireva is a Senior Lecturer in Sociology at the University of Essex. Her research focuses on vulnerable local communities, migration, inter-ethnic ties, social cohesion, ethnic penalties and multiculturalism. Her work has been published in Ethnic and Racial Studies, the Journal of Ethnic and Migration Studies, Sociology and has been featured in the Independent, the Guardian, TEDx among others. She is an Associate Editor of Migration Studies.
Wouter Zwysen
Wouter Zwysen is a senior researcher at the European Trade Union Institute. He is affiliated with the department of sociology at the University of Essex. His research focuses on socio-economic inequalities, the labour market and ethnic minority integration. His work has been published in several peer-reviewed journals, including: European Sociological Review; International Migration Review; Work, Employment and Society; the British Journal of Sociology; and the Journal of Ethnic and Migration Studies.
Notes
1 By partitioning the sample into three separate groups based on rough categories of country of birth of self and parents, we aim to compare like with like as much as the sample size allows. These groups are of course still very diverse and differ in composition across countries, which we address through the matching approach.
2 ESS Round 1: European Social Survey Round 1 Data (2002). Data file edition 6.6. NSD – Norwegian Centre for Research Data, Norway – Data Archive and distributor of ESS data for ESS ERIC. doi:10.21338/NSD-ESS1-2002.
3 ESS Round 7: European Social Survey Round 7 Data (2014). Data file edition 2.2. NSD – Norwegian Centre for Research Data, Norway – Data Archive and distributor of ESS data for ESS ERIC. doi:10.21338/NSD-ESS7-2014.
4 Greece, Italy and Luxembourg were not involved in the 2014 round.
5 Social distance is measured in the ESS by referring specifically to migrants from a different race/ethnic group from most people in the country. This means it is less clear what the variable measures for migrants and the 2nd generation since it depends on whether they see these hypothetical migrants as of their own group or not. 2nd generation minority members are likely to see the hypothetical migrant as outgrouper as research suggests. We assume the migrants and minorities generally would consider the hypothetical migrants as others, given the wording of the question, but this ambiguity is reflected in the lower degree of social distance that migrants and 2nd generation minority members report.
6 Respondents are asked: ‘how would you describe the area where you currently live?’ While referring to people’s own perception of the neighbourhood, the scale of this local area is unknown and may differ across respondents.
7 Table S4 in the supplementary results shows a variety of sensitivity results for generalised trust and perceived discrimination.
8 Furthermore, within these control and treatment groups, any non-linearities would also be taken on board by always comparing the treated to their closest comparators. We carry out the analyses using doubly robust methods which would be unbiased as long as one of the models is correctly specified.
9 Unfortunately, the survey contains no local labour market identifiers at a lower level than the region. We therefore use regional employment rate as a proxy, following standard practice in the literature.
10 In 2002 respondents were asked if they have any close friends that are immigrants and in 2014, they were asked whether they have any close friends who are of a different race or ethnic group from most people in the country. While these questions are different, they are included jointly to measure strong ties with minorities and are dichotomized to contrast having many minority/immigrant friends with having few or none.
11 Among majority members the enclave penalty is smaller in terms of well-being for the small number of respondents (565) who speak the majority language as the main language at home.
References
- Abascal, M. and Baldassarri, D. (2015) ‘Love thy neighbor? Ethnoracial diversity and trust reexamined’, American Journal of Sociology 121: 722–82.
- André, S. and Dronkers, J. (2017) ‘Perceived in-group discrimination by first and second generation immigrants from different countries of origin in 27 EU member-states’, International Sociology 32: 105–29.
- Bartram, D. (2011) ‘Economic migration and happiness: comparing immigrants’ and natives’ happiness gains from income’, Social Indicators Research 103: 57–76.
- Bécares, L., Nazroo, J. and Stafford, M. (2009) ‘The buffering effects of ethnic density on experienced racism and health’, Health & Place 15: 700–8.
- Bécares, L., Stafford, M., Laurence, J. and Nazroo, J. (2011) ‘Composition, concentration and deprivation exploring their association with social cohesion among different ethnic groups in the UK’, Urban Studies 48: 2771–87.
- Blalock, H. M. (1967) Toward a Theory of Minority-Group Relations, New York: Wiley.
- Boeri, T., De Philippis, M., Patacchini, E. and Pellizzari, M. (2015) ‘Immigration, housing discrimination and Employment’, The Economic Journal 125: F82–114.
- Caliendo, M. and S. Kopeinig (2008). “Some practical guidance for the implementation of propensity score matching.” Journal of Economic Surveys 22 (1): 31–72.
- Cameron, D. (2011) Speech at the Munich security conference, www.number10.gov.uk/news/pms-speech-at-munich-security-conference.
- Damm, A. P. (2009) ‘Ethnic enclaves and immigrant labor market outcomes: quasi-experimental evidence’, Journal of Labor Economics 27: 281–314.
- Danzer, A. M. and Yaman, F. (2013) ‘Do ethnic enclaves impede immigrants' integration? Evidence from a quasi-experimental social-interaction approach’, Review of International Economics 21: 311–25.
- Demireva, N. and Heath, A. (2014) ‘Diversity and the civic spirit in British neighbourhoods: an investigation with MCDS and EMBES 2010 data’, Sociology 48: 643–63.
- Demireva, N. and Zwysen, W. (2021) ‘Ethnic enclaves, economic and political threat: an investigation with the European social survey’, Frontiers in Sociology 6: 110. https://doi.org/https://doi.org/10.3389/fsoc.2021.660378
- Dinesen, P. T., Schaeffer, M. and Sønderskov, K. M. (2020) ‘Ethnic diversity and social trust: a narrative and meta-analytical review’, Annual Review of Political Science 23: 441–65.
- Dustmann, C., Frattini, T. and Halls, C. (2010) ‘Assessing the fiscal costs and benefits of A8 migration to the UK’, Fiscal Studies 31: 1–41.
- Dustmann, C., Glitz, A. and FrattinI, T. (2008) ‘The labour market impact of immigration’, Oxford Review of Economic Policy 24: 477–94.
- Dustmann, C., Schönberg, U. and Stuhler, J. (2017) ‘Labor supply shocks, native wages, and the adjustment of local employment’, The Quarterly Journal of Economics 132: 435–83.
- Feng, X., Flowerdew, R. and Feng, Z. (2015) ‘Does neighbourhood influence ethnic inequalities in economic activity? Findings from the ONS longitudinal study’, Journal of Economic Geography 15: 169–94.
- Fossett, M. (2006) ‘Including preference and social distance dynamics in multi-factor theories of segregation’, The Journal of Mathematical Sociology 30: 289.
- Gesthuizen, M., Van Der Meer, T. and Scheepers, P. (2009) ‘Ethnic diversity and social capital in Europe: tests of Putnam's thesis in European countries’, Scandinavian Political Studies 32: 121–42.
- Goldschmidt, T. and Rydgren, J. (2018) Social Distance, Immigrant Integration, and Welfare Chauvinism in Sweden.
- Green, D., Strolovitch, D. and Wong, J. (1998) ‘Defended neighborhoods, integration, and racially motivated crime’, American Journal of Sociology 104: 372–403.
- Jonsson, K. R. and Demireva, N. (2018) ‘Does the ethno-religious diversity of a neighbourhood affect the perceived health of its residents?’, Social Science & Medicine 204: 108–16.
- Kawalerowicz, J. (2021) ‘Too many immigrants: how does local diversity contribute to attitudes toward immigration?’, Acta Sociologica, doi:https://doi.org/10.1177/0001699320977592.
- Koopmans, R. and Schaeffer, M. (2016) ‘Statistical and perceived diversity and their impacts on neighborhood social cohesion in Germany, France and the Netherlands’, Social Indicators Research 125: 853–83.
- Laméris Joran, John R. Hipp, and Jochem Tolsma. (2018). Perceptions as the crucial link? The mediating role of neighborhood perceptions in the relationship between the neighborhood context and neighborhood cohesion, Social Science Research, 72: 53–68. https://doi.org/https://doi.org/10.1016/j.ssresearch.2018.02.010.
- Lancee, B. (2012) Immigrant Performance in the Labour Market: Bonding and Bridging Social Capital, Amsterdam: Amsterdam University Press.
- Laurence, J. and Bentley, L. (2018) ‘Countervailing contact: community ethnic diversity, anti-immigrant attitudes and mediating pathways of positive and negative inter-ethnic contact in European societies’, Social Science Research 69: 83–110.
- Laurence, J. and Heath, A. (2008) Predictors of Community Cohesion: Multi-Level Modelling of the 2005 Citizneship Survey, London: Department for Communities and Local Government.
- Letki, N. (2008) ‘Does diversity erode social cohesion? Social capital and race in British neighbourhoods’, Political Studies 56: 99–126.
- Liang, Y., Wei, Y., Wang, S., Gong, S., Dong, Y., Gao, L., Wang, S., Zhou, Y. and Ye, N. (2019) ‘Impact of international immigration on life satisfaction of local residents in England: exploring the differentiated relationships across socioeconomic gradients’, American Journal of Health Behavior 43: 866–76.
- Manacorda, M., Manning, A. and Wadsworth, J. (2012) ‘The impact of immigration on the structure of wages: Theory and evidence from Britain’, Journal of the European Economic Association 10: 120–51.
- Nandi, A., Luthra, R. and Benzeval, M. (2020) ‘When does hate hurt the most? Generational differences in the association between ethnic and racial harassment, ethnic attachment, and mental health’, Ethnic and Racial Studies 43 (16): 327–347.
- Portes, A., Fernandeze-Kelly, P. and Haller, W. (2005) ‘Segmented assimilation on the ground: the new second generation in early adulthood’, Ethnic and Racial Studies 28: 1000–40.
- Portes, A. and Zhou, M. (1993) ‘The new second-generation – segmented assimilation and its variants’, Annals of the American Academy of Political and Social Science 530: 74–96.
- Poulsen, M., Johnston, R. and Forrest, J. (2002) ‘Plural cities and ethnic enclaves: introducing a measurement procedure for comparative study’, International Journal of Urban and Regional Research 26: 229–43.
- Putnam, R. D. (2007) ‘E pluribus unum: diversity and community in the twenty-first century the 2006 Johan Skytte prize lecture’, Scandinavian Political Studies 30: 137–74.
- Schofield, P., Das-Munshi, J., Bécares, L., Morgan, C., Bhavsar, V., Hotopf, M. and Hatch, S. (2016) ‘Minority status and mental distress: a comparison of group density effects’, Psychological Medicine 46: 3051.
- Semyonov, M. and Glikman, A. (2009) ‘Ethnic residential segregation, social contacts, and anti-minority attitudes in European societies’, European Sociological Review 25: 693–708.
- Semyonov, M., Glikman, A. and Krysan, M. (2007) ‘Europeans’ preference for ethnic residential homogeneity: cross-national analysis of response to neighborhood ethnic composition’, Social Problems 54: 434.
- Semyonov, M., Gorodzeisky, A. and Glikman, A. (2012) ‘Neighborhood ethnic composition and resident perceptions of safety in European countries’, Social Problems 59: 117–35.
- Smith, J. A., Mcpherson, M. and Smith-Lovin, L. (2014) ‘Social distance in the United States: sex, race, religion, age, and education homophily among confidants, 1985 to 2004’, American Sociological Review 79: 432–56.
- Sturgis, P., Brunton-Smith, I., Kuha, J. and Jackson, J. (2014) ‘Ethnic diversity, segregation and the social cohesion of neighbourhoods in London’, Ethnic and Racial Studies 37: 1286–309.
- Sturgis, P., Brunton-Smith, I., Read, S. and Allum, N. (2011) ‘Does ethnic diversity erode trust? Putnam’s ‘hunkering down’ thesis reconsidered’, British Journal of Political Science 41: 57–82.
- Tolsma, J. and Van der Meer, T. (2017) ‘Losing wallets, retaining trust? The relationship between ethnic heterogeneity and trusting coethnic and non-coethnic neighbours and non-neighbours to return a lost wallet’, Social Indicators Research 131: 631–58.
- Tolsma, J. and Van Der Meer, T. (2018) ‘Trust and contact in diverse neighbourhoods: an interplay of four ethnicity effects’, Social Science Research 73: 92–106.
- Uslaner, E. M. (2018) The Oxford Handbook of Social and Political Trust, Oxford: Oxford University Press.
- Van Tubergen, F. and Kalmijn, M. (2005) ‘Destination-language proficiency in cross-national perspective: a study of immigrant groups in nine western countries’, American Journal of Sociology 110: 1412–57.
- Vervoort, M. (2012) ‘Ethnic concentration in the neighbourhood and ethnic minorities’ social integration weak and strong social ties examined’, Urban Studies 49: 897–915.
- Vervoort, M., Dagevos, J. and Flap, H. (2012) ‘Ethnic concentration in the neighbourhood and majority and minority language: a study of first and second-generation immigrants’, Social Science Research 41: 555–69.
- Waldinger, R. (1994) ‘The making of an immigrant niche’, International Migration Review 28: 3–30.
- Wang, S. and Ramsden, M. (2018) ‘Revisiting the ‘parallel lives’ thesis: neighbourhood attachment and residential integration of ethnic minorities in England’, Population, Space and Place 24: e2156.
- Yan, Y., Wang, S., Zhou, W., Wang, S. and Gong, S. (2019) ‘Does immigrant generation matter? Re-examining the ethnic density effects on mental health of ethnic minorities in Britain’, American Journal of Health Behavior 43: 924–36.
- Zhou, M. (1994) ‘Segmented assimilation: Issues, controversies and recent research on the new second generation’, in C. Hirschman, J. Dewind, & P. Kasinitz (eds.), The Handbook of International Migration: The American Experience (pp. 196–211). New York: Russell Sage Foundation.
- Zhou, M. (2004) ‘Immigrants in the US economy’, in E. J. Taylor & D. Massey (eds.), International Migration: Prospects and Policies in a Global Market (pp. 131–156). Oxford: Oxford University Press.
- Zhou, M. (2005) ‘Ethnicity as social capital: community-based institutions and embedded networks of social relations’, in G. C. Loury, T. Modood & S. M. Teles (eds.), Ethnicity, Social Mobility and Public Policy (pp. 131–159). 1st ed. Cambridge: Cambridge University Press.
- Zhou, M. and Kim, S. (2006) ‘Community forces, social capital, and educational achievement: the case of supplementary education in the Chinese and Korean immigrant communities’, Harvard Educational Review 76: 1–29.
- Zorlu, A. and Frijters, P. (2019) ‘The happiness of European Muslims post-9/11’, Ethnic and Racial Studies 42: 23–44.
- Zwysen, W. and Demireva, N. (2021) Replication for: wellbeing in local areas: how trust, attitudes, and experience of discrimination differ in the perceived ethnic enclave. //osf.io/rmypz.