
Abstract
Newspapers’ democratic functions have not been fully assumed by the media capturing the revenues newspapers used to enjoy. It is, therefore, important to understand the determinants of newspaper use. Earlier studies found age to be the principal determinant, but did not account for newspapers’ online editions. This article investigates to what extent digital distribution has disrupted previously observed cohort effects, bringing younger audiences back to newspaper content. The annual time spent with UK newspapers by their younger, middle-aged, and older British audiences was calculated for 1999/2000—before, or just after, newspapers started to go online—and for 2016, when digital distribution had come of age. The results show (1) the time spent with newspaper brands fell by 40 per cent, even as online platforms made access easier and cheaper; (2) the proportional decrease in time spent was greatest for the youngest age group and smallest for the oldest; and (3) there are important variations between individual newspaper brands, a result, we propose, of differences in their multiplatform strategies. Digital distribution has, therefore, had little impact on previously observed cohort effects but has enabled changes in media use that have shaped the attention given to newspapers and will continue to do so.
Introduction
Audiences are the lifeblood of the media industry. They generate revenues by paying for content directly and by having their attention sold to advertisers. For publicly or philanthropically supported media, having the right audience is a justification for the subsidies supplied. Audiences can never be taken for granted, of course; their attention is liable to be attracted by that which is new. Audience adoption of novel media platforms can reduce the use of those platforms already in the market, as the adoption of television did with radio, or even push them into extinction, as the adoption of DVDs did with VHS tape. Changes in preferences for content of particular styles are also clearly apparent over time, driven by a mixture of social, economic, legal, political, and technological dynamics.
Changes in audience behaviour can have profound effects on media institutions and all those in their orbit. Marvel Entertainment Group, for example, the creator of comic characters including Spider-Man and Captain America, filed for bankruptcy in 1996 after nearly 60 years in business, an event effected by a “three-year slide in the comic book business” (Washington Post Citation1996) that some attributed to a loss of a “generation of prime comic … readers” in the five years preceding the bankruptcy (Jones Citation1996).
Media platforms and the content they carry are, of course, highly interdependent, with, for example, advances in production technology allowing particular types of content, such as talking pictures, to be produced, which consumers may then develop a taste for. Distribution and consumption technologies also exert influence. The widespread adoption of radio and television in the home prompted the creation of new forms of content, such as the soap opera (Allen Citation1985).
Newspapers
Like soap operas, newspapers are a media form characterised by a combination of content and delivery platform, this platform, for newspapers, initially being print but now also including digital editions. Also like soap operas (Ford, de Kosnik, and Harrington Citation2011), newspapers have been negatively affected by changes in audience behaviour, with falls in the circulation of their printed editions (see, e.g., Brock Citation2013) as consumers have invested more of their finite attention in other media, such as television and the internet (see, e.g., Ofcom Citation2015a).
The financial problems facing newspapers (see, e.g., Cagé Citation2016) are, many would suggest, of more concern than the decline of soap operas or particular media brands or technologies. Newspapers are an important source of the information citizens rely on for their everyday orientation and the exercise of their democratic responsibilities (see, e.g., Aalberg and Curran Citation2013). Newspapers also provide an important set of checks and balances on those in power (see, e.g., Gilson Citation2016).
Are these democratic functions being taken up by the media outlets that have attracted attention away from newspapers? Not entirely. For example, the online classified advertising platforms, such as Craigslist and eBay, that have eliminated much of the advertising revenue newspapers used to enjoy (see, e.g., Douglas Citation2016), are not able, or do not need or feel obliged, to bundle the advertisements they carry with news and information that fulfils explicitly democratic functions.
It follows, therefore, that it is important to understand the dynamics driving changes in the consumption of newspapers in order to predict, and prepare for, the future.
Age and Newspaper Use
Age has been found to be the (Lauf Citation2001; McGrath Citation1993; Schlagheck Citation1998; Thurlow and Milo Citation1993) or one of the (Elvestad and Blekesaune Citation2008) most important determinants of newspaper use. It is, therefore, age that we will focus on in this article.
Earlier studies have compared the importance of age as an explanation for newspaper use across countries (Elvestad and Blekesaune Citation2008) and also assessed its importance against additional individual attributes—such as gender, income, and education—as well as national factors (Elvestad and Blekesaune Citation2008). Other studies have analysed particular dimensions of age as a determinant of newspaper consumption, looking, for example, at the use of newspapers over different stages of people’s lives (intra-cohort change) and analysing cohort effects (Peiser Citation2000).
For research purposes, cohorts are usually defined as groups of people born in the same time period who grew up together and were exposed to a similar set of social, cultural, and political influences that affect their behaviour throughout their lives (Peiser Citation2000). For example, a cohort socialised before the 1990s may be found to use the World Wide Web less than cohorts for whom it was part of their developmental environment. Because, after three or four decades, about half of a country’s population will consist of new individuals (12), cohort effects can bring about long-term change. For example, Peiser found that over half (56 per cent) of the decline in daily newspaper reading in the United States, and a third in West Germany, was due to cohort effects, as younger cohorts who read less frequently replaced older cohorts who read more frequently. Overall, Peiser concluded that cohort replacement has “contributed substantially to the decline in newspaper readership” (11).
Platform Independence
Such studies on age as a determinant of newspaper use are, however, now several years old and were undertaken using data from periods when newspapers were almost exclusively consumed in print (e.g. Peiser’s study used data from 1970 to 1996 and Lauf’s from 1980 to 1998), and/or were based on surveys that asked simply about “reading newspapers”, making no distinction between newspapers’ print and online editions (e.g. Elvestad and Blekesaune Citation2008). This is important because newspapers are no longer wedded to a single platform.
It may be, then, that the availability of newspaper content on digital distribution platforms is disrupting previously observed intra-cohort change effects and cohort effects. Put another way, those within cohorts who were drawn away from newsprint by novel electronic media may be returning to newspaper brands now that those brands make their content available online. Furthermore, while cohorts socialised in the four decades or so between the introduction of television and the World Wide Web may have regarded newspaper brands as rather old-fashioned, wedded as they were to a technology—paper and ink—that was hundreds of years old, those cohorts socialised in a world where the World Wide Web was widespread may make no such judgement, rather seeing newspaper brands as simply another genre of content available across multiple platforms.
General Approach and Research Questions
The data produced by the regular national and international surveys that were used by some of the earlier studies on the age demographics of newspaper consumption are not suitable for use in this study. The European Social Survey—used by Elvestad and Blekesaune (Citation2008)—last asked about newspaper reading in 2010 and, even then, made no distinction between newspapers’ print and online editions. Although the standard Eurobarometer survey—used by Lauf (Citation2001)—and the General Social Survey—used by Peiser (Citation2000) and McGrath (Citation1993)—do continue to ask about the frequency with which people read newspapers, they too make no distinction between the press’s print and online editions. Furthermore, even if these surveys did distinguish between newspapers’ hardcopy and digital versions, their reliance on participants’ recall could, as we will show in the next section, compromise the validity of their data on the consumption of newspapers online.
Looking at other potential sources of data reveals that, for our purposes, they too have limitations, such as:
the size of the samples,
the survey instruments used, and
not having sufficient longitudinal data to measure the effects of digital distribution (see ).
Furthermore, some do not provide data that allow for analyses of differences between individual newspaper brands and genres. We contend that there is value in looking at such differences because of the divergence in business models and content strategies that has come about in recent years. Unlike in the past when almost all newspapers relied on revenue from both subscription/newsstand sales and advertising, today some rely solely on advertising in both print and online, others charge for print but keep the online edition free, while others charge for both. There has also been divergence in newspapers’ content strategies, with some adopting a markedly different approach online (see, e.g., Bartlett Citation2012), while others align their print and digital offerings much more closely.
TABLE 1 Summary of contemporary data sources on the age demography of UK newspaper brands
As we will demonstrate through the examination and comparison of a range of data-sets, newspaper use is best understood when both the numbers of consumers and the intensity of their consumption is accounted for and when a distinction is made between newspapers’ online and print editions. As we will also demonstrate, accounting for online newspaper consumption is best achieved through passive measurement, where consumers’ behaviour is monitored via the use of software. Finally, analyses of age-related subsamples of newspapers’ online and print audiences require large samples.
Our critical review of contemporary data sources on the demography of newspaper use in the United Kingdom concludes that there is a pair of sources—the National Readership Survey (NRS) and comScore—that provide unmatched data. It is those sources we use in this study. The review also concludes that examining the time spent, on an annual basis, with newspaper brands by their print and online audiences is the best way to evaluate the consumption of newspapers, including by age.
First, in order to firmly establish the direction of travel, we ask how the total attention received by newspaper brands has changed in recent years:
RQ1: How did the total annual attention (expressed in time spent reading) received by newspaper brands change between 1999/2000 and 2016?
Our second research question relates to whether digital distribution has rejuvenated readership by disrupting previously observed intra-cohort change and cohort effects. This question is operationalised thus:
RQ2: How did the total annual attention (expressed in time spent reading) received by newspaper brands from their younger, middle-aged, and older audiences change between 1999/2000 and 2016?
RQ3: How do the results for RQ1 and RQ2 differ across individual newspaper brands?
Following our critical review of data sources, we present further details on the data sources we used, how they were combined, and the calculations that were performed. The results are then presented, followed by a discussion of their implications and limitations.
It should be noted that, although the data we have used relate to the UK market, equivalent data may be available in other countries, which would allow for replications of this study. Our source of online data, comScore, operates in more than 75 countries (comScore Citation2016), and there are additional sources of passively collected online audience data in many countries (see, e.g., EMRO Citation2016). Print readership data on newspapers is collected by surveys in at least 79 countries, 32 of which also collect data on time spent reading (PDRF Citation2015a).
A Critical Review of Contemporary Data Sources
Ofcom’s Media Tracker
Some data on the age demography of newspaper use are available from Ofcom’s regular Media Tracker survey. The results show (Ofcom Citation2016a) relatively minor differences between adults of different ages (see Table A in the online Supplemental Data).
The relatively small variations between those of different ages contrast with other surveys that have shown larger variations. The explanation, we propose, involves two methodological limitations. Firstly, in asking about respondents’ use of newspapers, the survey gives no time-frame, which means participants are left to determine whether or not they have used newspapers over an unspecified period. The longer the period about which respondents believed the survey was concerned, the greater the chance they would have used newspapers. Secondly, the survey does not measure respondents’ use of newspapers in any nuanced way. Although it makes the binary distinction between the use of newspapers as a “main” or “other” source, it has no means of measuring intensity of use, for example via reading frequency or time spent reading. These two limitations may disguise significant day-to-day demographic differences in consumption.
There are two further methodological limitations. The survey makes no distinction between newspapers’ print and online editions and does not ask about the consumption of individual news brands. These are important omissions because of the differences in the intensity with which readers of different ages may consume newspapers’ print editions, newspapers’ online editions, and individual newspaper brands. Although, as other data show, readers of print newspapers have been ageing for some time,Footnote1 it may be that newspaper brands have been rejuvenating their audience by offering content online and via mobile apps.
Ofcom’s Digital Day
Digital Day is a quantitative diary study that examines media consumption in the United Kingdom over a typical week. The publicly available data (Ofcom Citation2016b) show both participants’ weekly exposure to, and time spent with, “newspapers”. The data allow for a more specific understanding of the reach of newspaper brands than the Media Tracker survey because of the focus on a defined time period. As expected, the results show greater differentiation between age bands than is seen in the Media Tracker results. Nearly double the proportion of those aged 55 and over had used a print or digital newspaper in the week of the survey compared with those aged 16–34. There are even greater differences between age groups if we look at the duration of exposure (time spent), with those aged 55 and over spending nearly 150 per cent more time using newspapers than those aged 16–34 (see Table B in the online Supplemental Data).
By asking about time spent, and by defining a specific time period, the Ofcom Digital Day study paints a more nuanced picture of newspaper consumption among different age groups. However, because it combines newspapers’ print and online editions into a single category, it provides no information about variations in the consumption of these different platforms among the age bands. Like Media Tracker, it does not allow differences between individual newspaper brands or categories to be explored. Finally, because the study began in 2010, it does not provide the longitudinal data necessary to answer our primary research question.
Ofcom’s News Consumption in the United Kingdom
Ofcom’s News Consumption in the UK survey provides information on the general reach of printed newspapers and of newspapers’ websites and apps, both for the newspaper market as a whole and for specific newspaper brands. As well as asking about general reach (“do you use nowadays”), the survey also asks about frequency of use. The data show (Ofcom Citation2015b) that both printed and online editions of newspapers are more likely to be used by older people, although the differences between the ages are less pronounced with newspapers’ online editions than with their printed versions (see Table C in the online Supplemental Data). It may therefore be that, as proposed above, newspaper brands have rejuvenated their audience by offering content online and via mobile apps. Unfortunately, the survey provides no data on the duration of exposure to newspaper brands. This means that we are only able to say that online newspapers reach a higher proportion of younger readers than printed newspapers do. We are not able to use the survey data to explore what could be significant demographic differences in the attention paid to newspapers online and in print.
The survey also asks about the use of specific newspaper brands by age. The data show apparent differences between news brands, with some—such as The Sun, The Metro, London Evening Standard (Standard), and The Guardian—having a higher reach in print among young readers than among older readers (see Table D in the online Supplemental Data). The data also appear to show that reach is almost universally lower, across all age bands, for newspapers’ online editions than for their print versions (see Table D in the online Supplemental Data). These results should be treated with caution, however. Firstly, because the sample size (N = 2921) is relatively small for the purposes of conducting robust analyses of age-related subsamples of individual newspaper brands. Secondly, because of the methodology used.
As we will discuss later, asking participants to recall their online consumption at this level of detail is considered a relatively inaccurate method due to the large number of websites and apps that internet users visit and the relatively short duration of those visits. Because of this potential for inaccuracy, passive measurement of online consumption through software installed on users’ computers and mobile devices and/or through the use of site-centric census measurement is widespread. All of the “official” Internet Audience Measurement organisations in the 23 European countries surveyed by the European Media Research Organisation (EMRO Citation2016) make use of passive methods.
The survey cannot provide longitudinal data earlier than 2013.
Reuters Digital News Survey
The Reuters Digital News Survey (Newman et al. Citation2016) uses an online sample and excludes those who are not regular (at least once a month) news consumers. In 2016 the survey gathered data on the weekly reach of print and online newspapers, both in general terms and by individual newspaper brands, as well as whether they were relied on as respondents’ “main” source of news. The results on the general reach of newspapers’ print and online editions follow a similar pattern to that found in the News Consumption in the UK survey—while printed newspapers are more likely to be used by older people, the differences between the ages are less pronounced with newspapers’ online editions. Indeed, the Reuters’ data report that it is amongst the youngest age group that we find the highest proportion of weekly newspaper website and app users and also the highest proportion claiming newspapers’ online editions to be their main source of news (see Table E in the online Supplemental Data). However, as with the results of the News Consumption in the UK survey, these data tell us nothing about the amount of attention being paid by those in the different age bands.
Like the News Consumption in the UK survey, the Reuters survey provides data on the weekly reach of individual newspaper brands’ print and online editions. The results of the two surveys are not consistent, however. The Reuters data report a much higher reach for individual newspapers’ online editions (see Table F in the online Supplemental Data). Again, the results at this level of granularity should be treated with caution because of the sample size and the use of recall as a method to measure online consumption.
As a source of data on the age-related demographics of newspaper reading, the Reuters Digital News Survey shares some of the limitations of the other studies referred to in this section. Because the primary focus of the study is on providing international comparisons, it has a relatively small sample size and narrow sampling window in each country and relies on recall to measure online consumption; and like all the other surveys mentioned in this section it cannot provide sufficient longitudinal data to answer our primary research question.
IPA TouchPoints
IPA TouchPoints (IPA, n.d.) combines a diary study of about 5000 people with data on mobile usage collected passively from a subsample of 1159. IPA TouchPoints has strengths in the distinction that it makes between newspaper brands and between newspapers’ print and online editions, its recording of duration of exposure, and its passive monitoring of consumption from mobile devices. On the other hand, its sample size, in particular the size of its mobile panel, is relatively small; it has the disadvantage of relying on recall to record online consumption from PCs; and its data only go back as far as 2005. Unlike most of the other data sources, it is a subscription-only service—hence its results are not reported here.
TGI/TGI Clickstream (GB)
TGI is a long-running general survey that includes questions on media consumption (PDRF Citation2015b). The survey data are now supplemented by data (marketed as TGI Clickstream) on online media consumption that are collected passively from a subsample of 4000–5000 PC users and 1500–2000 mobile users. Like IPA Touchpoints, TGI/TGI Clickstream tracks the consumption of individual newspaper brands’ print and online editions. Although it has the advantage of collecting online usage data passively, it does so from relatively small panels. Furthermore, it does not collect data on the time spent reading newspapers’ print editions (Fraser McAvoy, personal communication, 7 March 2017). The TGI/TGI Clickstream data are not in the public domain and, therefore, we do not present its results in this article.
In summary, all the contemporary data sources on the age demography of UK newspaper brands mentioned thus far have limitations. Two of the sources do not differentiate between newspapers’ online and print editions, five rely on recall to measure the consumption of newspapers’ online editions, fourFootnote2 do not measure duration of exposure, two do not record data for individual newspaper brands, and five do not have sufficient longitudinal data to answer our primary research question (see ).
National Readership Survey/comScore
There is, however, another source, or pair of sources, that has none of these limitations. The UK NRS and comScore, together, provide data on newspaper consumption in the United Kingdom. In addition to having none of the aforementioned limitations, the NRS/comScore data come from substantially larger samples (see ). For example, in its measurement of the consumption of newspapers’ print editions, the NRS sample is between 7 and 22 times larger than that used by any of the other surveys. This is important as it allows for robust analyses of age-related subsamples of newspaper brands in aggregate and, in particular, as individual entities. Furthermore, time spent reading data are available for newspapers’ print editions from 1999/2000,Footnote3 sufficiently far back for us to be able to measure the effects of digital distribution on newspaper readership. Although comScore does not have data on the consumption of UK newspaper brands’ online editions from that period, not all of the newspaper brands in our sample were online at that time and the consumption of the online editions of the other brands in our sample was not high enough to make its omission have any significant effect on our results (more information is provided in the online Supplemental Data).
Although the NRS and comScore data are not in the public domain, access was gained for this research project via paid subscriptions.
Methodology
Sources
NRS
The UK NRS is used as a source of data on the numbers of readers of newspapers’ print editions and the time they spend reading those editions. This study uses NRS data to calculate the annual, aggregated time spent reading newspapers’ print editions. The NRS is based on a random sample (N ≥ 33,225) of British adults (aged 15+). The survey records demographic information and produces the official average issue readership (“AIR”) figures for the print editions of UK national newspapers. The NRS collects data on time spent reading via the following question: “How long do you usually spend in total reading or looking at [the publication] by the time you’ve finished with it” (Birt, Consterdine, and Robinson Citation1999; NRS Citation2015). Because the NRS data are based on recall, it may over- or underestimate the true numbers of readers per copy and time spent reading. Furthermore, because the interviews are conducted face-to-face, respondents may over- or under-report their use of some newspapers for reasons of social desirability.
comScore
This study used data from comScore to calculate the time spent reading newspapers’ online editions in 2016. comScore is the official supplier of online audience data to the NRS and the official data partner of the UK Online Measurement Company—UKOM—which sets the standards for online audience measurement on behalf of UK online publishers and advertisers. comScore uses a methodology that integrates data collected from a sample of panellists with “server-centric census data” that are collected via the use of “tags” that publishers place on their websites and mobile apps (comScore Citation2013, 2). Panellists’ online consumption—including time spent—is monitored by software installed on their PC, smartphone, or tablet. A telephone survey is used to estimate the composition of the population of internet users, and the panels are “weighted and projected” (3) in an attempt to make them representative of that population. In the United Kingdom, comScore has a panel of PC users (N = 73,000) as well as panels of iOS and Android smartphone users (N = 6500) and iOS tablet users (N = 1000) (Vit Smekal, EU Research Director at comScore, personal communication, 20 July 2017). There is, however, no panel of Android tablet users. As with any source, the comScore data have some limitations. They do not track consumption from mobile platforms other than iOS and Android, the usage of some newspaper brands’ iOS and Android mobile apps is not tracked (including those of two of the newspaper titles in this study’s sample, The Telegraph and the Standard), and this study was not able to access the data that comScore has about time spent watching video on mobile devices. As discussed in a previous study by one of the authors (Thurman Citation2017), we do not consider these limitations to have had a significant effect on this study’s results.
Sampling Issues
As we have seen, a minority of the UK population uses newspapers as a source of news, and the reach of individual newspaper brands within particular age bands is even more restricted. To conduct robust analyses of the consumption of individual newspapers by those in different age bands requires, therefore, large samples. This is particularly true if, as with this study, the variables to be analysed go beyond reach and consider other behaviour, such as time spent reading. Even though the source of our data on print readership, the NRS, has a minimum sample of 33,225—much larger than that used by the other surveys we have mentioned—it was necessary to exclude some newspapers from our analysis because there were insufficientFootnote4 respondents in the particular age bands to make the data on time spent reading reliable. These exclusions left us with a sample of eight UK newspapers: seven that have a national print circulation and one, the Standard, that is distributed in London and the south-east of England (see Table G in the online Supplemental Data). comScore has a larger sample than the NRS and also makes use of server-centric census data. As a result, we could get robust online consumption data for all the newspaper brands for which we had NRS data.
Calculations
In order to estimate the total time, in 1999/2000 and 2016, spent reading each newspaper brand’s print editions by their younger (18–34), middle-aged (35–54), and older (55+) audiences in Great Britain, calculations were made that involved the number of weekdays, Saturdays, and Sundays in those 12-month periods, the average number of readers on those days, and the average minutes of reading time per reader on those days. The procedure followed that used in a previous study by one of the authors (Thurman Citation2017).
In order to calculate the online (PC and mobile) reading time in 2016, data from comScore were used. The data provided, for each month of 2016, the total number of minutes younger, middle-aged, and older audiences in Great Britain spent with the online editions of each newspaper brand.
The age bands used are not of exactly the same breadth. These age bands were chosen for two reasons. Firstly, their breadth ensured a sufficient sample size for our analyses and, secondly, both of our data sources—the NRS and comScore—provided data about these particular age spans, allowing us to account for time spent reading in print and online.
Results
RQ1: How did the total annual attention (expressed in time spent reading) received by newspaper brands change between 1999/2000 and 2016?
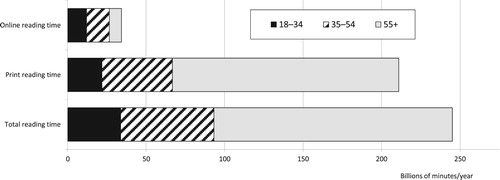
Between 1999/2000 and 2016, the eight UK newspapers in our sample suffered a drop in attention from their British audiences aged 18 and over of 40 per cent. In 1999/2000 this audience segment read the newspapers’ print editions for a total of 407 billion minutes a year. By 2016 those same newspapers’ print and online editions were being read for a total of 245 billion minutes a year by their British adult audiences (see ).
RQ2: How did the total annual attention (expressed in time spent reading) received by newspaper brands from their younger, middle-aged, and older audiences change between 1999/2000 and 2016?
FIGURE 1 Changes in total annual attention (measured by minutes spent reading) received by eight UK national newspaper brands (The Mail, Mirror, Star, The Telegraph, The Guardian, The Sun, Standard, and The Times) from their younger (18–34), middle-aged (35–54), and older (55+) British audiences between 1999/2000 and 2016. Reading time for 2016 includes PC, mobile, and print audiences. Only print reading time is included in the 1999/2000 figures. In 1999/2000 the time spent reading online was insignificant for this sample of newspaper brands (for more information, see the online Supplemental Data). Sources: NRS and comScore
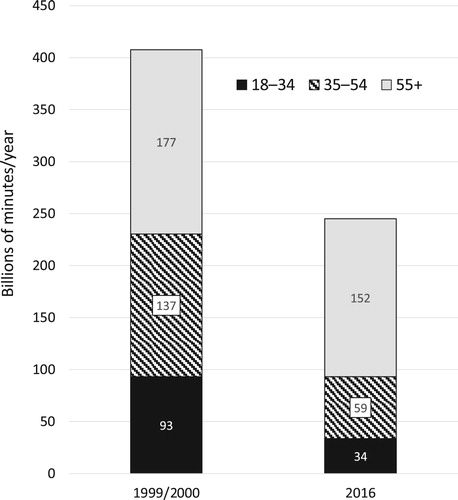
also breaks the figures down by age group. Here, we see large differences. The total attention contributed by readers aged 55 and older has remained relatively constant, dropping just 14 per cent. However, there have been much greater falls in the attention contributed by those aged 35–54 and 18–34: 57 and 64 per cent, respectively. Put another way, while in 1999/2000 about 43 per cent of the time spent with newspapers by their British adult audiences came from the oldest (aged over 54) audience segment, 34 per cent from those aged 35–54, and 23 per cent from those aged 18–34, by 2016 those proportions had changed to 62, 24, and 14 per cent, respectively.
RQ3: How do the results for RQ1 and RQ2 differ across individual newspaper brands?
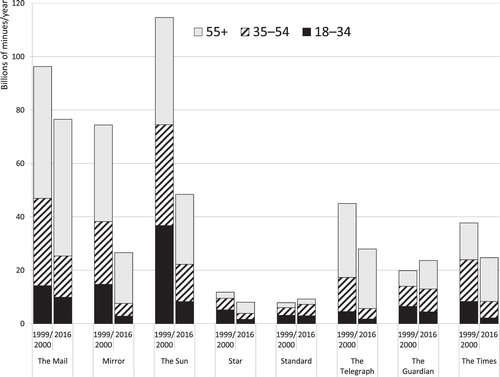
The results show a number of significant differences between individual newspaper brands, both longitudinally and in terms of their 2016 print and online readerships. Firstly, comparing changes in total attention received by the individual newspaper brands between 1999/2000 and 2016 (see ) shows that two, The Guardian and the Standard, have increased the attention they receive (by 19 and 17 per cent, respectively). Of the other titles, The Mail lost attention, though the fall was comparatively small, at 21 per cent. Two of the popular tabloid titles, the Mirror and The Sun, are notable for the relatively high losses they have suffered, 64 and 58 per cent, respectively, while the other tabloid title, the Star, has seen attention fall by less (31 per cent). Losses at The Telegraph, a quality broadsheet, were 38 per cent, while those at The Times were slightly better at 35 per cent.
FIGURE 2 Changes in total annual attention (measured by minutes spent reading) received by each of eight UK national newspaper brands from their younger (18–34), middle-aged (35–54), and older (55+) British audiences between 1999/2000 and 2016. Reading time for 2016 includes PC, mobile, and print audiences. Only print reading time is included in the 1999/2000 figures. In 1999/2000 the time spent reading online was insignificant for this sample of newspaper brands (for more information, see the online Supplemental Data). Sources: NRS and comScore
Secondly, our results allow us to examine the proportions of attention individual newspaper brands received from audience segments of different ages in 1999/2000 and 2016. All newspaper brands, bar one, had higher proportions of attention from their older readers in 2016 than in 1999/2000, and smaller proportions from younger readers (see ). The exception is the Standard, where older (and younger) readers contributed smaller proportions of attention in 2016 than in 1999/2000, and middle-aged readers more. In 2016, the Standard was receiving a higher proportion of attention from younger audiences than any other newspaper in our sample. The Guardian, The Sun, and the Star also receive higher proportions of attention from younger readers than other titles, although probably for different reasons. The Guardian because of its liberal editorial stance and The Sun and the Star because of their focus on “soft” news topics—like sport, entertainment, and celebrity—that tend to be of more interest to the under 35s (see Newman et al. Citation2016, 98). In 2016, The Telegraph, the Mirror, The Mail, and The Times were particularly reliant on older readers. For these newspaper brands, 80, 71, 67, and 66 per cent, respectively, of the attention they receive comes from those aged 55+.
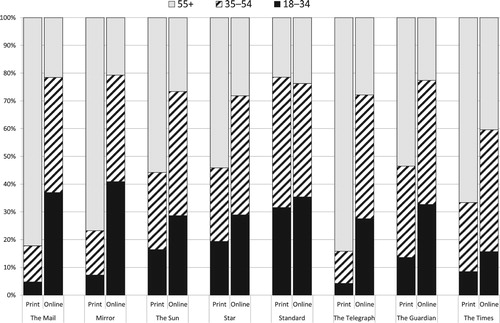
Finally, our results allow comparisons to be made between individual news brands in the attention they received via their print and online editions in 2016. All the newspaper brands get much more attention from their British adult audiences via print than online (see ). However, there are differences: the success of The Mail’s online edition in absolute terms, the relatively high proportion of online reading as a proportion of total reading time at The Guardian and The Mail, and the relatively low proportions at The Times and the Standard, for example. Some of these differences have been observed and discussed previously (see Thurman Citation2017). This article’s novel contribution is its focus on age demographics, and in this respect we see some interesting differences between titles’ print and online editions. While most titles’ online editions get a higher proportion of attention from younger and middle-aged audiences than their print editions do (see ), the difference is particularly pronounced at The Mail. This slant towards youthful online attention is less pronounced, however, at The Times, whose online editions rely on those aged 55 and over for 40 per cent of the attention they receive. There is, however, a notable exception: the Standard. High proportions of the time spent with its print edition come from younger and middle-aged readers,Footnote5 as is the case with its online editions. It should be remembered that, in absolute terms, all the newspapers in our sample—bar The Mail—receive more attention from younger audience members via their print editions than via PCs and mobile devices (see ).
FIGURE 3 Total time spent reading each of eight UK newspapers by their younger (18–34), middle-aged (35–54), and older (55+) British print and online audiences, 2016. Sources: NRS and comScore
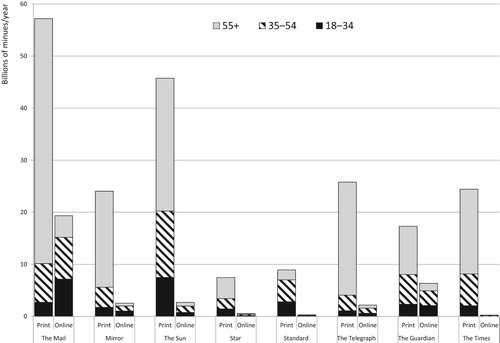
FIGURE 4 Proportion of consumption (measured by time spent reading) from the younger (18–34), middle-aged (35–54), and older (55+) British print and online audiences of each of eight UK newspapers, 2016. Sources: NRS and comScore
Discussion
We have shown that, when time spent is used as the measure of consumption, UK newspaper brands experienced a large drop in use over the 16-year period from 1999/2000 to 2016. This reduction took place even though online distribution lowered the costs of content consumption, both in financial terms—by providing free access in many cases—and with respect to convenience and speed.
What might explain this drop? Let us consider two factors. The first concerns the huge expansion in media choice that occurred during the time period in question. Newspaper brands now exist in an environment where potential readers have many more media alternatives. Given that the maximum amount of time that people can spend with media has changed relatively little, it follows that an increase in choice can reduce the total time spent with both particular media formats and with individual media brands.
The second factor concerns differences in the way news is consumed in print and online. Studies of markets—like Sweden—where good longitudinal data are available show that newspaper websites have partially displaced newspapers’ print editions as elements of the public’s media diet (Westlund and Färdigh Citation2011). Data from the Reuters Digital News Reports from 2012 to 2016 point to similar patterns in the United Kingdom. This displacement means that, for many newspaper brands, drops in print reach have been compensated for by increased online reach. Crucially, however, we should not expect the attention received by newspaper brands to remain similarly stable, because digital distribution appears to have enabled forms of news consumption—such as snacking and scanning—that take up less time (Costera Meijer and Kormelink Citation2015). As a result, the average amount of time spent consuming newspapers in print is much higher than the average amount of time spent consuming newspapers online. For example, Thurman (Citation2017) found that, typically, a UK national newspaper brand will get an average of 40 minutes of reading time per user per day with its weekday print edition, but just 30 seconds per user per day with its website and apps.
We have also shown that total time spent with newspaper brands by the young and middle-aged shrunk more between 1999/2000 and 2016 than the total time spent by those aged 55+ (see ). It is clear that, collectively, younger readers spent far less time with newspaper brands in 2016 than was the case in 1999/2000.
Those readers aged 18–34 at the turn of the millennium have now grown into middle age. Amongst this group we see a considerable fall in the time spent with newspaper brands, indicating behavioural (intra-cohort) change. However, the fall is not as great as that observed among younger readers, indicating that media consumption habits acquired early in adult life continue to be evident in middle age.
Most of those who were middle-aged at the turn of the millennium had joined the ranks of the over-54s by 2016. Because this age bracket also includes (surviving) newspaper consumers who were 55+ in 1999/2000, cohort effects and intra-cohort change are more difficult to determine. However, it seems clear that there has been less intra-cohort change among those middle-aged and older, in line with other research that has shown older audiences tend to “adhere to familiar media practices, with only a minority making intense use of new practices” (Nimrod Citation2016, 233).
In seeking to explain these changes, we must ask whether the drops in the time spent with newspaper brands by the young and middle-aged are a result of those age groups avoiding newspaper brands altogether or of their consuming those brands with different devices and frequencies. Our evidence suggests the latter. The attention newspaper brands received via PCs and mobile devices from their younger, middle-aged, and older readers in 2016 was relatively evenly distributed: 35, 42, and 23 per cent, respectively (see ). This supports other research (see, e.g., Ofcom Citation2016a) which shows that over a third of the young and middle-aged are still exposed to newspaper brands. However, as we have shown, the time spent with newspaper brands online is far less than it is in print. So, although digital distribution has allowed newspaper brands to reach out to younger audiences, the fleeting attention paid by those accessing newspaper content via PCs and mobile devices has diluted digital distribution’s rejuvenating effects. Newspapers received an even higher proportion of attention from their oldest audience segment in 2016 than they did at a time before, or just after, newspapers started to go online (see ).
FIGURE 5 Time spent reading eight UK newspapers (The Mail, Mirror, Star, The Telegraph, The Guardian, The Sun, Standard, and The Times) by their younger (18–34), middle-aged (35–54), and older (55+) British print and online audiences, 2016. Sources: NRS and comScore
Finally, we have shown that, even though the total time spent with newspaper brands decreased between 1999/2000 and 2016, there were some noticeable differences among titles, mostly explainable by variations in newspaper brands’ multiplatform strategies. The Guardian and the Standard were the only newspaper brands to see an increase in time spent (see ). In the case of the Standard this was largely because its print circulation rose after it became a free sheet in October 2009. We can also look to print for an explanation of the Star’s relatively small losses compared to the other two tabloid titles, The Sun and the Mirror: its weekday print circulation held up better than many of its competitors, and it has benefited from the additional attention received by its Sunday print title, launched in 2002.
In the case of The Guardian, losses in the attention received from its print products have been more than offset by its success in digital distribution. Although between 1999/2000 and 2016 there was a drop (of 13 per cent) in the aggregated time print readers of The Guardian were spending with the brand, the duration of attention coming via the title’s online editions more than made up those losses. The Guardian has sought to build scale online, keeping content free-to-access, and “shifting focus, effort and investment towards digital” (GNM Citation2011). It should be noted, however, that 2016 was an exceptionally successful year for The Guardian. Print readership was up on the previous two years,Footnote6 and the average time spent reading the title’s print editions was higher than in the previous four years (NRS Citation2017c). In 2016, the time spent with the brand online was over a third higher than it was in 2015.Footnote7 Without the 2016 Trump and Brexit “bumps” (see Bond Citation2017; Sweney Citation2017), which are likely to have increased both readership of, and engagement with, The Guardian, it is probable our results would have shown no change in the time spent with the title since the turn of the millennium, or even a small fall.
Like The Guardian, The Mail has also been relatively successful in distributing its content digitally. It was not online at the turn of the millennium, but by 2016 attracted more attention from British adults via PCs and mobile devices than any other title in our sample—a total of 19.4 billion minutes/year (see ), partly offsetting losses from its print editions. The popularity of DailyMail.co.uk is, in part, due to an editorial approach focused on entertainment and celebrity—very different in character from the more conservative stance taken in print—that has helped it to appeal to younger digital consumers (see, e.g., Bartlett Citation2012). Digital distribution has been less successful for two tabloids, The Sun and the Mirror. They suffered the biggest losses in attention between 1999/2000 and 2016 (see ), likely a result of steep declines in their print circulations and stiff competition from many digital-born sites that also package news content in amusing or entertaining ways.
This leaves two newspaper brands whose content was, in 2016, wholly or partially behind online paywalls: The Telegraph and The Times. Both suffered moderate losses in attention. The Times’s hard paywall has severely restricted the total time spent with the brand online given that very few people pay for online news in the United Kingdom (Fletcher and Nielsen Citation2016). The Telegraph’s soft paywall meant it was able to attract more attention online than The Times, but not enough to compensate for print losses. In both cases, a more conservative editorial stance and style has likely deterred many younger readers.
The chief methodological limitation with the findings presented here is the reliance on different techniques to measure the time spent reading newspapers in print and online. Though the passive measurement of online newspaper reading is commonplace, it is impractical to measure print use in the same way and at the same scale, hence the reliance on self-reporting. Some previous research on the accuracy of self-reported data has shown that people tend to overestimate the amount of time they spend online when passive measurement is used as the ground truth (e.g. Scharkow Citation2016). Similarly, Prior (Citation2009) found that people overestimate the frequency with which they watch television news, thus suggesting that overestimates are a feature of self-reported data for both online and offline media use. These studies have also shown that self-reporting error is non-random, with differences in over-reporting by demographic group and by the type of content and medium being viewed. Younger people are typically more prone to over-reporting. Shepherd-Smith (Citation1999) looked at overestimates of print readership based on self-reports, finding it was “less likely to occur for daily newspapers” and “worst with magazines”. However, other studies have found evidence of underestimates of online use from self-reported data, with the error smallest for news access (Pellegrini et al. Citation2015). We might also question the use of comScore and other passive tracking systems as a ground truth, given that their inner workings are mostly hidden from view, the data are collected for commercial purposes (Taneja Citation2016), and different systems produce different results (Thurman Citation2014). In the end, none of these studies speak directly to how we should interpret differences in time spent reading offline and time spent reading online when the practices are measured differently. However, it is possible that the 1999/2000 figures, particularly for the youngest age group, are inflated by their total reliance on self-reported data, with consequences for the size of the gap between them and the figures for 2016.
To return to the central issue at the heart of this paper: has online distribution altered previously observed intra-cohort change and cohort effects associated with newspaper use? Even keeping the various limitations in mind, this does not appear to be the case. In line with the predictions of previous studies (Lauf Citation2001; Peiser Citation2000), we have found that newspaper readership has continued to decline but, uniquely, have proved this to be the case even when newspapers’ online editions are accounted for and when the duration of reading sessions, not just their number and frequency, is analysed. However, although we believe that cohort replacement means the decline of newspaper brands has some way to go before it bottoms out, the courses followed by each individual outlet will not necessarily correspond to this general trajectory. As we have shown, differences in editorial and distribution strategies can have major effects, as can the tides of public interest in political news.
SUPPLEMENTAL DATA
Supplemental data for this article can be accessed at http://dx.doi.org/10.1080/1461670X.2017.1397532
Supplementary Materials
Download MS Word (47.6 KB)ACKNOWLEDGEMENTS
The authors would like to thank Wolfram Peiser, Alessio Cornia, and John Hobart for their useful comments.
DISCLOSURE STATEMENT
No potential conflict of interest was reported by the authors.
Additional information
Funding
Notes on contributors
Neil Thurman
Notes
1. For example, the proportion of readers of the Monday to Saturday editions of 10 of the most popular UK national newspapers who were aged between 15 and 24 fell from 14 per cent to 10 per cent in the seven years to 2015/2016 (NRS Citation2017a).
2. One of these four sources (TGI/TGI Clickstream) does measure the time spent with newspapers via PCs and mobile devices but not via their print editions.
3. Although the NRS did not begin to regularly collect data on time spent reading until 2007, data are available covering the period July 1999 to June 2000: the result of a one-off survey.
4. Our cut-off was N = 37.
5. Due to its distribution at urban transport hubs.
6. Due to an increase in the number of readers per copy (NRS Citation2017b).
7. Source: comScore.
Related Research Data
REFERENCES
- Aalberg, Torilm, and James Curran. 2013. How Media Inform Democracy: A Comparative Approach. New York: Routledge.
- Allen, Robert C. 1985. Speaking of Soap Operas. Chapel Hill: The University of North Carolina Press.
- Bartlett, Rachel. 2012. “Mail Online Publisher: ‘If You Don’t Listen to Your Users Then You’re Dead.’” Journalism.co.uk, 24 January. https://blogs.journalism.co.uk/2012/01/24/mail-online-publisher-if-you-dont-listen-to-your-users-then-youre-dead/.
- Birt, Hilary, Guy Consterdine, and Lynne Robinson. 1999. “The Quality of Reading Survey: An Instrument for Change.” Paper presented at the Worldwide Readership Research Symposium, Florence, Italy. Accessed June 6, 2017. https://www.pdrf.net/wp-content/uploads/2013/03/552.pdf.
- Bond, Shannon. 2017. “CNN and New York Times Boosted by ‘Trump Bump’.” Financial Times, 3 May. https://www.ft.com/content/99039bc0-3011-11e7-9555-23ef563ecf9a.
- Brock, George. 2013. Out of Print: Newspapers, Journalism, and Business of News in the Digital Age. London: KoganPage.
- Cagé, Julia. 2016. Saving the Media: Capitalism, Crowdfunding, and Democracy. Cambridge: Harvard University Press.
- comScore. 2013. “comScore Media Metrix Description of Methodology.” November 2013. http://www.journalism.org/files/2014/03/comScore-Media-Metrix-Description-of-Methodology.pdf.
- comScore. 2016. “comScore Facts at a Glance.” Accessed September 5, 2016. http://www.comscore.com/About-comScore/comScore-Facts-at-a-Glance.
- Costera Meijer, Irene, and Tim Groot Kormelink. 2015. “Checking, Sharing, Clicking and Linking: Changing Patterns of News Use Between 2004 and 2014.” Digital Journalism 3 (5): 664–679. doi: 10.1080/21670811.2014.937149
- Douglas, Torin. 2016. “Where Did the Advertising Go?”.” In Last Words? How Can Journalism Survive the Decline of Print?, edited by John Mair, Tor Clark, Neil Fowler, Raymond Snoddy, and Richard Tait, 110–116. Bury St Edmunds: Abramis Academic Publishing.
- Elvestad, Eiri, and Arild Blekesaune. 2008. “Newspaper Readers in Europe: A Multilevel Study of Individual and National Differences.” European Journal of Communication 23 (4): 425–447. doi: 10.1177/0267323108096993
- EMRO. 2016. “Emro Audience Survey Inventory (EASI) 2016.” Accessed February 3, 2017. http://www.emro.org/easi/easi2016.html.
- Fletcher, Richard, and Rasmus Kleis Nielsen. 2016. “Paying for Online News: A Comparative Analysis of Six Countries.” Digital Journalism 5 (9): 1173–1191. doi: 10.1080/21670811.2016.1246373
- Ford, Sam, Abigail de Kosnik, and C. Lee Harrington. 2011. “Introduction: The Crisis of Daytime Drama and What It Means for the Future of Television.” In The Survival of Soap Opera: Transformations for a New Media Era, edited by Sam Ford, Abigail de Kosnik, and C. Lee Harrington, 3–21. Jackson: University Press of Mississippi.
- Gilson, Michael. 2016. “The Decline of Journalism, the Democratic Deficit and Why It Should Concern Us All.” In Last Words? How Can Journalism Survive the Decline of Print?, edited by John Mair, Tor Clark, Neil Fowler, Raymond Snoddy, and Richard Tait, 200–205. Bury St Edmunds: Abramis Academic Publishing.
- GNM. 2011. “Guardian News & Media to Be a Digital-First Organisation.” 16 June. https://www.theguardian.com/gnm-press-office/guardian-news-media-digital-first-organisation.
- IPA. n.d. “TouchPoints.” Accessed January 27, 2017. http://www.ipa.co.uk/touchpoints.
- Jones, Tim. 1996. “Fans, Publishers Fear Death of an Icon.” Denver Post, 8 December, page I-12.
- Lauf, Edmund. 2001. “Research Note: The Vanishing Young Reader: Sociodemographic Determinants of Newspaper Use as a Source of Political Information in Europe, 1980–98.” European Journal of Communication 16 (2): 233–243. doi: 10.1177/0267323101016002005
- McGrath, Kristin. 1993. “Women and Newspapers.” Newspaper Research Journal 14 (2): 95–110. doi: 10.1177/073953299301400211
- Newman, Nic, Richard Fletcher, David A.L. Levy, and Rasmus Kleis Nielsen. 2016. Reuters Institute Digital News Report 2016. Oxford: Reuters Institute for the Study of Journalism.
- Nimrod, Galit. 2016. “Older Audiences in the Digital Media Environment.” Information, Communication & Society 20 (2): 233–249. doi: 10.1080/1369118X.2016.1164740
- NRS. 2015. “National Readership Survey DS-CAPI Protocol – July 2015.” Accessed December 14, 2016. http://www.nrs.co.uk/wp-content/uploads/2013/08/External-DS-CAPI-protocol_-July-2015.pdf.
- NRS. 2017a. “Readership Profiles July 2008–June 2009 and October 2015–September 2016.” NRS website, subscription only.
- NRS. 2017b. “Summary Tables January–December 2013–2016.” NRS website, subscription only.
- NRS. 2017c. “Source of Copy and Time Spent Reading January–December 2011–2016.” NRS website, subscription only.
- Ofcom. 2015a. “Time Spent Online Doubles in a Decade.” 11 May. https://www.ofcom.org.uk/about-ofcom/latest/media/media-releases/2015/time-spent-online-doubles-in-a-decade.
- Ofcom. 2015b. “News Consumption in the UK.” Data tables. Accessed February 3, 2017. https://www.ofcom.org.uk/_resources/documents/research-and-data/tv-radio-on-demand/tv-research/news5/news-consumption-UK-2015/news_consumption_in_the_uk_2015_data_tables.csv.
- Ofcom. 2016a. “Ofcom Media Tracker 2015.” Accessed February 3, 2017. Raw data files available from: https://www.ofcom.org.uk/__data/assets/file/0025/82816/ofcom_media_tracker_2015_data_tables_for_publication_csv.csv.
- Ofcom. 2016b. “Digital Day Media and Communications Diary.” Accessed February 3, 2017. http://www.digitaldayresearch.co.uk/.
- PDRF. 2015a. “Summary of Audience Research Worldwide 2015.” Accessed March 2, 2017. https://www.pdrf.net/wp-content/uploads/2015/10/PDRF-Excel-Summary-of-General-Population-Surveys-2015-151015.pdf.
- PDRF. 2015b. “United Kingdom, Target Group Index (TGI).” Accessed March 8, 2017. https://www.pdrf.net/survey-results-2015/results/survey-1-detail.php?id=143.
- Peiser, Wolfram. 2000. “Cohort Replacement and the Downward Trend in Newspaper Readership.” Newspaper Research Journal 21 (2): 11–22. doi: 10.1177/073953290002100202
- Pellegrini, Pat, Debbie Bradley, Karen Swift, and TraShawna Boals. 2015. “Cross Platform Media Measurement: Mobile and Desktop Online Measurement Comparisons.” Paper presented at the PDRF 2015 Symposium, London, October. https://www.pdrf.net/wp-content/uploads/2015/10/10_Syn43Pellegrini.pdf.
- Prior, Markus. 2009. “The Immensely Inflated News Audience: Assessing Bias in Self-Reported News Exposure.” Public Opinion Quarterly 73 (1): 130–143. doi: 10.1093/poq/nfp002
- Scharkow, Michael. 2016. “The Accuracy of Self-Reported Internet Use—A Validation Study Using Client Log Data.” Communication Methods and Measures 10 (1): 13–27. doi: 10.1080/19312458.2015.1118446
- Schlagheck, Carol. 1998. “Newspaper Reading Choices by College Students.” Newspaper Research Journal 19 (2): 74–87. doi: 10.1177/073953299801900206
- Shepherd-Smith, Neil. 1999. “The Ideal Readership Survey.” Paper presented at the Worldwide Readership Research Symposium, Florence, Italy. https://www.pdrf.net/wp-content/uploads/2013/03/560.pdf.
- Sweney, Mark. 2017. “Brexit Vote Boosts National Newspaper Sales.” The Guardian, 21 July. https://www.theguardian.com/media/2016/jul/21/brexit-vote-boosts-national-newspaper-sales.
- Taneja, Harsh. 2016. “Using Commercial Audience Measurement Data in Academic Research.” Communication Methods and Measures 10 (2–3): 176–178. doi: 10.1080/19312458.2016.1150971
- Thurlow, George L., and Katherine J. Milo. 1993. “Newspaper Readership: Can the Bleeding Be Stopped, or Do We Have the Wrong Patient?” Newspaper Research Journal 14 (3–4): 34–44. doi: 10.1177/073953299301400305
- Thurman, Neil. 2014. “Newspaper Consumption in the Digital Age: Measuring Multi-Channel Audience Attention and Brand Popularity.” Digital Journalism 2 (2): 156–178. doi: 10.1080/21670811.2013.818365
- Thurman, Neil. 2017. “Newspaper Consumption in the Mobile Age: Re-Assessing Multi-Platform Performance and Market Share Using ‘Time-Spent’.” Journalism Studies. Online First. http://doi.org/10.1080/1461670X.2017.1279028.
- Washington Post. 1996. “Marvel Entertainment Files for Bankruptcy Protection; Plan Would Boost Control of Investor Perelman.” Washington Post, 28 December, page D02.
- Westlund, Oscar, and Mathias A. Färdigh. 2011. “Displacing and Complementing Effects of News Sites on Newspapers 1998-2009.” International Journal on Media Management 13 (3): 177–194. doi: 10.1080/14241277.2011.595020