
ABSTRACT
News value research assumes that news factors may shift and diversify over time. Despite the technological and economic transformations of the media over the past decades, however, there has been little conceptual work on how journalistic news factors might be changing. This paper addresses how broader developments, such as digitization, datafication, and audience fragmentation, lead to changing news practices. One characteristic of the digital age is that attention is not only scarce and increasingly contested but also continuously measured and compared, leading to a heightened value around everything that seems to draw an exceptional response. Therefore, we introduce the news factor “public response” and argue that journalism increasingly covers those issues and actors that (are said to) have received broad or unexpected public attention. Using numerical, linguistic, and visual means, journalists explicitly tell their audience what many people are paying attention to. We demonstrate the significance of this news factor by pursuing two objectives: First, public response is presented conceptually and distinguished from other news factors. Second, we use the case of the 2016 US election campaign coverage to illustrate public response and derive suggestions for future measurements in qualitative and quantitative textual and visual content analysis.
Introduction
The news value approach is one of the most well-known and widely used concepts in communication studies and has been influenced, in large part, by European research (Eilders Citation2006; Kepplinger Citation2008; Preston Citation2016; Staab Citation1990). Although news factors have become more broadly differentiated and systematized since the ground-breaking study by Galtung and Ruge (Citation1965), the core of identified news factors has hardly changed over the last fifty years (Bednarek and Caple Citation2017; Eilders Citation2006; Harcup and O’Neill Citation2001; Kilgo et al. Citation2018; Preston Citation2016). At the same time, scholars have argued that news factors may shift and diversify over time (Kepplinger Citation2008; Wilke Citation1984), especially when considering the media change over the past decades due to digitization and the emergence of social media (Harcup and O’Neill Citation2017). However, research into news values has not sufficiently factored in the media change occurring in the last decades since the early studies were conducted (Joye, Heinrich, and Wöhlert Citation2015; Kilgo et al. Citation2018).
More recently, some scholars have observed that “‘Like’ and ‘Share’ metrics have become news factors” (von Nordheim, Boczek, and Koppers Citation2018, 807), with journalists increasingly reporting on “popular topics of conversation” (Anstead and O’Loughlin Citation2015, 208), as highlighted and ranked by social media platforms (McGregor Citation2019; Proferes and Summers Citation2019). In light of the public debate about the attendance and viewership numbers of President Trump's inauguration, Bakardjieva and Gehl (Citation2017, 215) also reflected on the increasing importance that journalists give to data related to collective attention: “Undoubtedly, we live in a time when metrics and analytics have taken on a life of their own.” These studies contain either no reference to news value research or only minor references. However, providing further elaboration, these recent observations could be used to enrich our understanding of journalistic news selection and news values. They support the notion that “public response” (Fürst Citation2013) can be regarded as a distinct news factor that increases in importance due to media change.
Public response sheds light on how journalism picks up on events and topics that are said to arouse public interest or are considered popular and pervasive. Due to the proliferation of media content and diversification of the public sphere (Schulz Citation1997; Webster Citation2014), topics that arouse broad or unexpected attention have been increasing in relevance. Journalists often illustrate the publicity and popularity of topics, events, and actors with figures, such as the number of Twitter followers or television viewers (audience metrics), the frequency of media coverage, or crowd sizes at events. Due to digitization and datafication (van Dijck and Poell Citation2013), such figures are increasingly accessible and can be used to heighten the newsworthiness of an issue or even turn an incident lacking in newsworthiness into an event (Gürsel Citation2016, 295–296; Molaei Citation2015). This paper addresses how broader developments in the media environment might lead to changing news practices and connects news value research with recent notions on the “attention economy” (Webster Citation2014, 49–53) and “metric society” (Mau Citation2019), in which attention is scarce, highly contested, valuable, and permanently counted and compared.
In the following sections, we first describe in greater depth what is understood by public response as a news factor and how this relates to changes in the media landscape. Following this theoretical conceptualization, the second part of the paper presents a proposal for the qualitative and quantitative operationalization of public response to make it suitable for news value research and lists of news factors and allow for future comparisons over time and across countries. The media coverage of Donald Trump and Hillary Clinton in the US election campaign in 2016 is used as a case study. This example is particularly interesting since many scholars consider Trump's high visibility in the news media and on Twitter as a decisive success factor (Chadwick Citation2017; Francia Citation2018; Lowe Citation2018; McNair Citation2018; Parks Citation2020; Woolley and Guilbeault Citation2019). Researchers have argued that the media attention that Trump attracted was largely triggered by his provocative and sometimes discriminatory statements, driven by the news factors of controversy, conflict, surprise, and entertainment (Chadwick Citation2017, 252–253; Francia Citation2018; Karpf Citation2017; Lowe Citation2018; McNair Citation2018, 138; Parks Citation2020; Patterson Citation2016). The massive news coverage is also attributed to the news factor of celebrity, especially because of Trump's many years as a reality TV star (Chadwick Citation2017, 258; Hearn Citation2016). What has been largely overlooked, however, is the fact that news media themselves reported on how Trump variously attracted public attention—meaning that Trump generated media attention by being perceived as triggering broad attention. As early as four weeks after Trump's candidacy was announced, the Washington Post, for instance, was already asking: “Why is Trump getting so much attention?” (Cillizza Citation2015). In her recent study on the 2016 US election coverage, McGregor also showed that various US news media reported on social media metrics, with many stories focusing “solely on a trending hashtag” (McGregor Citation2019, 1080). Therefore, we believe that the 2016 US election coverage offers a rich pool of material that could be used to elaborate on public response as a news factor.
Conceptualizing Public Response as a News Factor
For more than 20 years, the steady proliferation of new technologies and communication channels has been discussed by scholars in terms of audience fragmentation and the potential loss of a common ground for conversations (S. Maier Citation2010; Riles, Pilny, and Tewksbury Citation2018; Schulz Citation1997; Webster Citation2014). One school of thought considers the extensive use of digital media and, with it, the virtually limitless media choices as a further threat to the social functions of media. In this view, growing audience fragmentation could mark the “end of a common cultural forum” (Webster Citation2014, 98) and “imagined communities” (Anderson Citation1983).
In its central role of mediating public discourse, journalism addresses this problem by explicitly reporting on events and actors that are considered to have gained a strong or unexpected public response. This is to say that journalists tell their audience what “everyone” is talking about or what many people are paying attention to. As the competition for the scarce resource of attention steadily increases (S. Maier Citation2010; Webster Citation2014), the concentration of collective attention is accorded increased newsworthiness. Therefore, journalists make use of the growth in accessible usage data and meta-information, which have risen in the course of digitization (Gillespie Citation2016; Haim, Kümpel, and Brosius Citation2018; van Dijck and Poell Citation2013; Webster Citation2014). This includes publicly visible rankings of most-read or most-shared content, such as trending topics on Twitter (Beckers and Harder Citation2016; Gillespie Citation2016; Proferes and Summers Citation2019; Webster Citation2014). On the basis of such almost omnipresent and mostly nontransparent popularity metrics, individual content is highlighted and continuously compared to others (Webster Citation2014). The co-orientation among media users that this facilitates increases the attention given to content that is deemed popular and encourages herding and bandwagon behaviors, typically leading to self-reinforcing effects (Gillespie Citation2016, 60–61; Knobloch-Westerwick Citation2015; Proferes and Summers Citation2019; Webster Citation2014, 42, 84, 94). Apparently, media users and professionals conceive user data and rankings as indications about the general public and the cultural importance of media offerings (Colbjørnsen Citation2014; Gillespie Citation2016, 67; J. W. Kim Citation2018). As Mau (Citation2019, 11) put it, “Quantified measurements institutionalize certain ‘orders of worth’ which provide us with benchmarks and justifications for viewing and evaluating things in a particular way.”
This development is, of course, not completely new. Audience numbers have long been used in public discourse to raise attention by announcing attention records and hotspots (Bor Citation2013; Fürst Citation2020; Gillespie Citation2016). However, due to the growing omnipresence of metrics and quantifications (Beer Citation2016; Mau Citation2019; McGregor Citation2019), the increasing competition for attention, and the economic crisis of journalism, attention metrics and numbers have become more important in news selection and presentation. Such metrics make it easier for journalists to select a topic out of the overwhelmingly large amount of available content and topical issues. They also offer a time-effective option for journalistic research, particularly in the context of increasing economic pressure inside editorial offices that leads journalists to produce more content with fewer resources (Anstead and O’Loughlin Citation2015; Fürst and Schönhagen Citation2018; von Nordheim, Boczek, and Koppers Citation2018; Weaver, Willnat, and Wilhoit Citation2019). This means, for example, that content on Twitter listed as a trending topic has an increased chance of becoming a news story (Beckers and Harder Citation2016; Chadwick Citation2017, 256; Proferes and Summers Citation2019; van Dijck and Poell Citation2013). At the same time, journalists use available figures on public response to underscore fact-driven coverage and increase the acceptance and social utility of news (cf. Beer Citation2016; Mau Citation2019; McGregor Citation2019; Riles, Pilny, and Tewksbury Citation2018, 1417–1418; Roeh and Feldman Citation1984).
Analytically, we differentiate three dimensions of public response: audience response, media response, and event response. Audience response comprises reports referring to usage data and the degree of popularity. This could include articles on bestsellers in the book, music, and film markets (Colbjørnsen Citation2014; Gillespie Citation2016) and on measured or predicted television ratings (Bor Citation2013; Fürst Citation2020; Mertens Citation2006; Schlott Citation2013) that turn out to be high or low (see, e.g., Koblin Citation2020). Furthermore, metaphors and generalized descriptions are used to represent the participation of a broader public or community (e.g., “storm on Twitter,” Beckers and Harder Citation2016, 913). With the emergence of the Internet and social media, popularity cues and popularity rankings “have become much more common” (Knobloch-Westerwick Citation2015, 338; see also Haim, Kümpel, and Brosius Citation2018). Declared trends and the number of shares, likes, and followers can trigger news coverage or can be used to highlight the relevance of a report (Anstead and O’Loughlin Citation2015; Beckers and Harder Citation2016; Gillespie Citation2016; McGregor Citation2019; Proferes and Summers Citation2019). The number of audience clicks alone can tip the scales on whether or not something becomes newsworthy. As a journalist put it, “This decision depends not only on whether or not the video itself is journalistically important but whether its circulation itself is news. So the news might not be what's in the video but that this video is in wide circulation” (Gürsel Citation2016, 295–296; for similar statements from journalists, see McGregor Citation2019; Molaei Citation2015).
The dimension of media response contains explicit journalistic references to widespread attention across numerous media outlets (publicity). Diverse forms of information and verbal expressions are used, feeding the “construction of ‘the media’ as socially central” (Couldry Citation2011, 196). First, media response is illustrated by stating the amount of media stories published on a specific subject or event. Such reports might include quantifications, a listing of numerous reporting media, or generalized descriptions (e.g., “the media are reporting that … ”, Fürst Citation2013, 8). Second, media response is expressed by the (expected) number of journalists and camera teams attending an event (Schlott Citation2013). Again, such articles can be based on figures (Lang and Lang Citation1953) or generalized descriptions (e.g., “surrounded by television cameras and reporters from around the world,” Mertens Citation2006, 26). Third, media response is visually represented by showing a small or large crowd of journalists, cameras, or microphones (Caple and Bednarek Citation2016; Esser and D’Angelo Citation2003, 628–629; Lawson and McCann Citation2005; Schlott Citation2013).
The dimension of event response captures journalistic statements that contain numerical, linguistic, or visual cues concerning the quantity (e.g., specific number of participants) and quality (e.g., enthusiastic reactions of a group) of event participation. The number of participants in political and cultural events is commonly accepted as reflective of the importance of an event (Mann Citation1974). Therefore, the mere question of how many people attended an event can lead to controversial discussions and strong media coverage—the inauguration of Donald Trump and its unexpectedly low response is a case in point (Chadwick Citation2017, 242–249; Werber Citation2017). Similarly, in the case of demonstrations, there is often a struggle between police and organizers over the number of participants that should be released to and published by the press (Cammaerts Citation2012, 122; McPhail and McCarthy Citation2004). Studies have shown that demonstrations particularly meet journalistic criteria when they are assumed to draw large crowds (Ertl Citation2015, 316–317; McCarthy, McPhail, and Smith Citation1996; Wouters Citation2013). Furthermore, an early and seminal study revealed that people are more likely to attend an event when they expect a large or highly emotional response (Lang and Lang Citation1953). Consequently, many organizers publicly announce high numbers of expected participants beforehand (Ertl Citation2015, 300; Werber Citation2017). This strategy has been used, for example, by demonstrations proclaimed as a “million man march” (McPhail and McCarthy Citation2004) and has triggered a massive amount of news coverage—not least because it enables journalists to controversially discuss such expectations long beforehand (Watkins Citation2001). Moreover, event response is represented by visual cues. News media favor events and political speeches that allow for the visual depiction of large and enthusiastic crowds (Lawson and McCann Citation2005; Schlott Citation2013). Politicians, therefore, strive to create these types of images (Grabe and Bucy Citation2009; Muñoz and Towner Citation2017). Importantly, as Lang and Lang (Citation1953) have shown, the impression of a large and enthusiastic crowd of people can be staged with specific means of presentation.
These three dimensions of public response are analytically distinguished and can occur separately. However, events and actors are more likely to receive extensive media attention when all dimensions can be addressed in a news story (Fürst Citation2013).
Differentiating Public Response from Other News Factors
Public response is different from common news factors such as reach, relevance, impact, threshold, and magnitude. These news factors focus on the number of people or size of groups who are, will be, or could be affected by an issue (e.g., parts of a society, whole nations, or several countries), the extent of the consequences (whether or not the event endangers lives or the existence of a community), and the duration of the resulting consequences (whether or not they are permanent or could be reversed) (Araujo and van der Meer Citation2020, 643; Bednarek and Caple Citation2017, 55; Eilders Citation2006, 8; Harcup and O’Neill Citation2001, 273, 279; M. Maier et al. Citation2018, 61–62; Moernaut, Mast, and Temmerman Citation2019, 106; Schulz Citation1990, 133). The news factor of magnitude also includes “extreme behaviours or occurrences,” such as “a man dying in extreme temperatures in an oven” (Harcup and O’Neill Citation2017, 1479). Thus, these news factors are quite broad. They refer to actual or potential effects for a specific individual or social group(s) or the audience itself. Moreover, they typically capture events considered extreme or harmful.
The news factor of superlativeness, recently suggested by Bednarek and Caple (Citation2017, 64), includes the news factor threshold, magnitude, reach, and relevance, but adds a specific dimension: The event is constructed as a “‘more-ness’ in relation to a range of aspects.” Therefore, superlativeness is also a very broad news factor and comprises, for example, articles reporting that “a tsunami of crime” (80) has occurred or that “Putin has dramatically raised the stakes” (94). In contrast, the news factor of public response is measured by explicit statements about public attention. Due to the emergence of the “attention economy” (Webster Citation2014, 49–53) and “metric society” (Mau Citation2019), news is increasingly about informing one's audience about other audiences and publics.
Public response also differs from the news factor of continuity. The latter refers to the time period in which the media reported on a given topic (Eilders Citation2006; M. Maier et al. Citation2018, 150; Schulz Citation1990, 130), meaning that this news factor is not measured by what is said in the text but is derived by coders and is “not always easy to identify” (Harcup and O’Neill Citation2001, 273). In contrast, the dimension of media response is about explicit references to media attention across different channels or outlets. This media attention is often described as happening simultaneously or in a short period of time, thereby giving users an indication of hotspots of media attention and on what events and actors many people are presumably talking about (see the previous section on media response as part of public response).
A news factor that specifically addresses the transformations of the media environment—shareability—has recently been proposed by Harcup and O’Neill (Citation2017). However, the authors focused not on news reports about what is actually being shared by media users but on the anticipations of journalists regarding the shareability of their own reports once they are published: “Stories that are thought likely to generate sharing and comments via Facebook, Twitter and other forms of social media” (Harcup and O’Neill Citation2017, 1482). This news factor is, thus, according to the authors (Citation2017, 1481), “hard to define” and cannot be measured by means of content analysis.
Previous studies on news values have revealed that different news factors do sometimes have similarities and that, therefore, they often co-occur (Galtung and Ruge Citation1965, 69–71). This has been stated, for example, for the news factor of impact/relevance and its relation to negativity, superlativeness, and proximity (Bednarek and Caple Citation2017, 60; Eilders Citation2006, 15; Moernaut, Mast, and Temmerman Citation2019). Likewise, the news factor of public response can co-occur with that of magnitude (Harcup and O’Neill Citation2017, 1479), though not necessarily, as the reported public response can also be low or average (e.g., Chadwick Citation2017, 243; Koblin Citation2020). Moreover, many reports characterized by the news factor of magnitude have nothing to do with public response, such as in the above-mentioned case of a man dying in extreme temperatures. Thus, we consider public response to be a discrete news factor that should be measured in addition to other news factors.
Operationalizing Public Response: Linguistic, Numerical, and Visual Indicators
Since the news factor of public response has only recently been introduced conceptually, an established set of quantitative variables for measurement is not yet available. In a first step, qualitative indicators for the three dimensions of public response—audience, media, and event response—will be presented, described, and illustrated with the use of examples from the coverage of the 2016 US presidential candidates, Trump and Clinton. In a second step, we derive variables for quantitative measurements that could be used to integrate the news factor of public response into common lists of news factors.
Case Study: Public Response in the Media Coverage of the 2016 US Election
The textual analysis incorporated journalistic units addressing the public response to the presidential candidates, Clinton and Trump, in the coverage from April 12, 2015 (announcement of Clinton's candidacy) to November 8, 2016 (election day).Footnote1 We included three national newspapers (print and online editions): The New York Times (NYT), The Washington Post (WP), and USA Today. These newspapers were selected because both their online and print versions are still widely used as a source of political information in the United States (S. Maier Citation2010; Nelson Citation2020; Reuters Institute Citation2016, 32–33). Moreover, the NYT and WP have been found to influence the agenda of both social media and other news media (Y. Kim et al. Citation2016).
The research of articles was carried out using the LexisNexis database. Since this database does not archive images or graphics, the first part of the analysis focused on text. Due to the large number of articles published on the US election, the material in the full-text database was accessed using combinations of several search terms ().
Table 1. Search terms and parameters for identifying relevant articles.
These truncated search terms were derived from deductive reasoning in the context of the three dimensions of the news factor of public response and, inductively, on the basis of a preliminary search of the material for analysis. The terms represent only a small part of all possible search terms that capture public response. However, they offered rich material to conduct an exploratory study by means of qualitative content analysis (Scheufele Citation2008). The hit lists were reviewed separately for every search term combination. If articles were displayed for several search queries, duplicates were deleted. Duplicates were identified by matching the authors’ names, the headline of the article, and the date of publication. Whether an article was actually relevant for analysis was determined manually by reviewing the sections in which the selected search terms appeared as well as the preceding and subsequent paragraphs. Articles that, for example, only contained a call for participation in a Twitter debate initiated by a newspaper were removed.
Overall, 765 relevant articles were identified by two researchers as containing at least one reference to the presence or intensity of one of the three dimensions of public response to Trump or Clinton. The validity and reliability of the data collection were ensured by constant exchanges between the two researchers. Statements on audience response (n = 306) and event response (n = 302) occurred highly frequently, while references to media response (n = 208) occurred less frequently. In a second step, the NYT database (https://www.nytimes.com/search) was searched for “image slideshows” for the same period of analysis (using the search terms “Trump” and “Clinton”) in order to capture the visual representation of the news factor of public response. The NYT was chosen for this because it yielded the most hits in the text analysis. In what follows, examples of the three dimensions of public response are presented and discussed in the context of their significance to the election reporting in 2016.
Audience Response
Statements on the usage or popularity of content or actors in traditional or social media are conceived as indicators of audience response. As the case study revealed, audience response to Trump was covered quite frequently. Some articles highlighted such references in the headline, especially with respect to TV ratings. For example: “Record Numbers Watch Debates—With or Without Trump” (WP, October 16, 2015) and “84 Million: Debate Sets a Record for Viewers” (WP, September 28, 2016). Trump was often portrayed as someone who generally provided for especially high audience ratings. This was expressed, for example, by metaphorically calling him a “ratings machine,” “ratings boon,” “big ratings draw,” or “ratings bonanza” (WP, October 13, 2015; WP, December 4, 2015; NYT, May 5, 2016; NYT, May 19, 2016). Such descriptions also contained terms and attributions shaped by Trump himself, including superlatives with which Trump presented himself as the focus of society's attention: “That was an exciting evening for me folks,” he said, adding, “And it set the all time [sic] record for debates and maybe television, who knows” (NYT, September 28, 2016). With these very positive and constantly repeated self-portrayals regarding his audience response, Trump obviously influenced media coverage about himself.
Numerous reports provided numerical highlights of the response Trump generated on social media platforms. Most of these articles explicitly pointed to the high follower numbers of his Twitter and Facebook accounts, which were usually equated with a relevant power resource. This was particularly evident in metaphorical terms describing the audience as Trump's “legion” or “army of Twitter followers” and an image of Trump as the “king of Twitter, collecting 5 million followers” (NYT, January 28, 2016; WP, December 13, 2015; USA Today, December 22, 2015).
Conversely, news about Clinton rarely highlighted her audience response. Only a few articles depicted her response numerically by stating that she reached hundreds of thousands and millions of people through Twitter and Facebook, partly claiming that these channels were used deliberately by the Clinton campaign to influence or circumvent the media agenda. Some reports made direct comparisons with Trump, representing Clinton in subordinate terms. Trump's self-portrayals also triggered such coverage:
Campaigning via social media is ‘a very effective way of communication,’ Trump said on the Sunday debate, noting his 12.4 million Twitter followers and 11.3 million Facebook likes. Democrat Hillary Clinton has 9.7 million Twitter followers and more than 7 million likes to her page on Facebook. (USA Today, October 4, 2016)
‘The Nielsen ratings just came out,’ Donald J. Trump, the Republican presidential nominee, said with a smile on Friday in Colorado, hours after his Democratic opponent, Hillary Clinton, delivered her climactic convention speech. ‘We beat her by millions.’ Well, yes and no. (NYT, July 30, 2016)
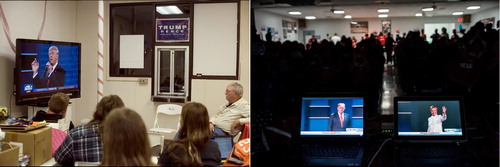
Since the media audience is a mediated, widely dispersed community, there are only limited means of visualization. However, one way to picture audience response is to look at public viewings or watch parties, which in the case of the US election campaign occurred during the presidential debates ().
Figure 1. Visualization of audience response: Public viewing of the televised debates. Photographs: Left: Wright (Citation2016), Right: Heissler (Citation2016).
Media Response
Media response refers to reports describing the extent to which a person, an organization, or event attracts attention across numerous media sources and, therefore, publicity. With respect to the coverage of the 2016 US election campaign, the headlines of some articles emphasized metaphorically and numerically Trump's success in creating publicity while also expressing a media-critical perspective, for example: “Trump Coverage Is Out of Control” (USA Today, August 25, 2015) and “The Media's $2 Billion Gift to Trump” (WP, March 16, 2016). Trump was called a “breakout media star” who creates “massive” or “significant” attention in the media (WP, September 11, 2016; USA Today, June 23, 2016; WP, June 1, 2016). Specific figures were used to illustrate, quantify, and thus objectify the extent of the journalistic attention: Some authors pointed to the amount of time devoted to Trump or the amount of money that would have been paid for the equivalence of purchased airtime (“earned media” in dollars). Such calculations, which stemmed from commercial media research, were repeatedly published during the run-up to the election, whereby Trump generated additional media coverage that presented him as the center of public attention. Most reports indicated that Trump received much more attention in the media than Clinton. This depicted attention was mostly seen as beneficial to Trump:
Despite spending little on advertising, Mr. Trump had a news media presence that dwarfed those of other candidates, with pervasive coverage of his campaign on television, in print and on social media. According to mediaQuant, Mr. Trump earned $639 million in free media in May—more than double Mrs. Clinton's $275 million. (NYT, June 22, 2016)
On Twitter, where he regularly regales his millions of followers with 140-character bursts of id, Mr. Trump's posts are mainlined and amplified by the rest of the media; with one or two tweets, he can dominate cable TV, the web, newspapers and talk radio for an entire day. (NYT, May 19, 2016)
By some estimates, Donald Trump has received the advertising equivalent of more than $4 billion in free media coverage, while Clinton has gotten little more than half that. Since the conventions, as his daily obnoxiousness and varied offenses against good politics continue, let me spitball that he gets 90% of the coverage to her 10%. (USA Today, August 22, 2016)
Event Response
With respect to event response—characterized by the amount of people or their collective reactions—the news coverage featured patterns that were similar to those identified in the other dimensions. Many articles dealt with the popularity of Trump's campaign events. One journalist even explicitly pointed to high numbers of participants as an indication of newsworthiness: “Were the cable networks wrong to carry live coverage of so many Trump rallies? Recall that the events themselves were newsworthy because of the extraordinary size of the crowds” (WP, March 29, 2016).
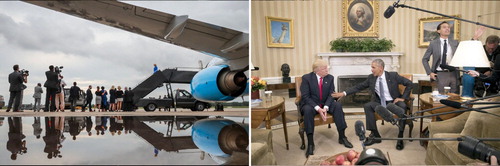
Figure 2. Visualizations of media response to Clinton and Trump. Photographs: Left: Mills (Citation2016), Right: Crowley (Citation2016).
The size and reactions of these crowds were often covered in detail. The reporting described, for example, how the participants reacted collectively to Trump's statements by chanting. According to many reports, Trump attracted “enormous,” “large, enthusiastic,” and “big, boisterous crowds” of 10,000 or “more than 15,000” participants (USA Today, February 1, 2016; WP, May 3, 2016; WP, January 12, 2016; NYT, October 15, 2016). Metaphorical and numerical references were also used in headlines, such as: “Trump Message Plays Well to Big Dallas Crowd” (WP, September 15, 2015), “Overflow Crowd for Trump in the Backyard of Sanders” (NYT, January 8, 2016), and “Trump's Crowds are Big, but His Counts Are Bigger” (WP, October 31, 2016). In some reports, Trump's rallies became newsworthy events ahead of time by emphasizing estimated participant numbers. Such reports claimed that thousands or tens of thousands of people were expected to attend the event, often including counter-demonstrators.
Some news articles reported that Trump strived to make the number of people at his rallies as visible as possible in the public eye. To achieve this strategic goal, Trump also made specific demands on journalists: “[H]e does what he routinely demands that television reporters do at his rallies: Show the crowds” (NYT, February 5, 2016). Moreover, some reports integrated quotes from Trump pointing out the success of his events, especially in comparison to other candidates.
Articles on the response to Clinton's events, however, often stated that they were comparatively small. During the first weeks of the electoral race, some reports noted that the campaign was focused on the organization of small events with specific target groups. This occasionally generated positive headlines for event response (“For Clinton, ‘Small’ Events Still Draw a Frenzy of Attention,” NYT, April 15, 2015), but it did not continue during the course of the campaign.
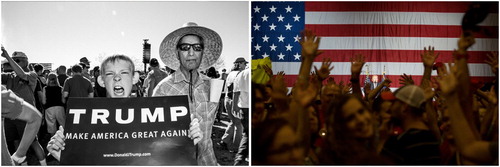
Photographs of cheering crowds with campaign posters were a common theme in election campaign coverage (see ), constituting visual indicators of event response.
Figure 3. Visualizations of event response to Trump. Photographs: Left: Yalkin (Citation2016), Right: Winter (Citation2016).
Qualitative Measurement of Public Response
As shown in the presentation of the case study, linguistic (descriptive, metaphorical), numerical, and visual indicators of the news factor of public response were present in news reports. These indicators can be used as the basis of categories for qualitative content analysis (Scheufele Citation2008) in order to further investigate this news factor. The following is an overview () of the individual categories, including examples.
Table 2. Qualitative categories for the analysis of public response.
The categories can refer to both individual and collective actors mentioned in media coverage (as in the case of Trump and Clinton) or to events (e.g., elections, demonstrations, royal weddings).
References to expected winners and losers or candidates’ chances of winning the election, mostly illustrated by opinion polls, are not considered indicators of the news factor of public response. These reporting patterns, which are analyzed within the framework of the horse race concept (Banducci and Hanretty Citation2014), focus on political opinions and decisions but do not contain information about the achieved or expected public response. However, news coverage of election campaigns can report on public response and connect these statements with discussions on who might win or lose an election (see McGregor Citation2019), which is interesting for future studies on horse race coverage.
Quantitative Measurement of Public Response
A large part of news value research is based on quantitative content analysis, where the presence or intensity of news factors is usually indicated in numerical values or codes (Eilders Citation2006; M. Maier et al. Citation2018). Galtung and Ruge (Citation1965) and Harcup and O’Neill (Citation2001) recorded the news factors they identified as dichotomous (presence/absence). Schulz (Citation1990) considered different intensity levels of news factors on a four-level scale, defined each level, and illustrated them with concrete indicators. For example, the lowest intensity level of the news factor of celebrity is coded only if ordinary people are mentioned in the reporting, while the highest intensity level is chosen if internationally known personalities, such as actors or singers, are mentioned. Eilders (Citation1997) varied the measurements of news factors and used dichotomous variables in addition to the four-level scales. Her measurements were used in subsequent studies (e.g., Wendelin, Engelmann, and Neubarth Citation2017). For the statistical analysis, however, it turned out that all the news factors needed to be dichotomized for reasons of reliability. Recently, the use of a three-level scale in news value research has shown good reliability (Araujo and van der Meer Citation2020, 643). Furthermore, some studies have quantitatively measured news factors in photographs (e.g., Rössler et al. Citation2011; Stengel Citation2013), where operationalizations of news factors derived from text analysis are transferred to visual content, including measurements capturing different intensity levels. For example, the intensity level of the news factor of personalization of a photo is coded with 0 if no one is recognizable in the image. The highest intensity level, 2, is coded if an individual is depicted in a private context (Stengel Citation2013).
These textual and visual analyses—mostly stemming from the European tradition of news value research—distinguish analytically and empirically between news factor and news value (Kepplinger Citation2008; M. Maier et al. Citation2018; Schulz Citation1990): While the former is measured by means of reported event characteristics, the latter is measured by the attention journalists give to these characteristics in their reporting in terms of length or placement (page number, mentioning in the headline, etc.). Therefore, the reference to a news factor in the headline or in the majority of an article is important for coding the news value, but it is not relevant for coding the intensity level of a news factor.Footnote2 However, it is conceptually assumed that the intensity of the news factor and the interplay of the intensities of several news factors typically influence the news value, meaning the way in which the news is reported (placement, scope, etc.).
In accordance with methodological developments in European news value research, we propose two quantitative operationalizations that would record both the existence and intensity of public response: First (option A), a differentiated analysis of public response is possible—especially at the level of statements (as the unit of analysis)—if each dimension (audience, media, and event response) is treated as an individual variable on a three-level scale ranging from no (code = 0) to low (code = 1) up to a high-intensity level (code = 2). The different intensity levels of the three variables can be determined by searching for and interpreting the corresponding linguistic, numerical, and/or visual indicators in the material of analysis, as illustrated in the previous section (see ). It seems unreasonable to suggest general rules regarding how the intensity levels should be coded or which numbers would indicate which intensity level. Instead, we propose that the coding of intensity levels depends on the object of analysis, its specific contexts, and the comparisons and evaluations prevalent in the news coverage. For example, an audience of 300 people for a local election event may be represented as a high event response, whereas it would indicate a rather low response for a national election event. It is important to note that these intensity levels of the three variables of the news factor of public response, as shown above for previous research, only reflect the ascribed characteristics of an event or actor mentioned in a report. In addition, the characteristics of the report itself are captured in rather formal and established variables, such as “mentioning in the headline” or “length of report,” and are used to measure the news value.
Second (option B), if the news factor of public response is to be measured in a single variable referring to the full report as the unit of analysis in line with the operationalization of other news factors, such as personalization, prominence, and damage, the following distinction between four intensity levels would be suitable. The four intensity levels here represent a sum index of the three dichotomously measured (presence/absence) dimensions of public response:
The lowest intensity level is coded if there is no indicator of public response in the report at all.
The second lowest intensity level is coded if only one dimension of public response (audience, media, or event response) is addressed in the report.
The second highest intensity level is coded if two of the three public response dimensions (audience, media, or event response) are addressed in the report.
The highest intensity level is coded if all three dimensions of public response (audience, media, and event response) are addressed in the report.
It can therefore be argued that an event receives extensive coverage when all dimensions of public response could be addressed (Fürst Citation2013), which is typically the case for media events (Fürst Citation2020). Their relevance is highlighted by reporting that they trigger an enormous response from the media audience, the news media, and the audience in situ. For example, the news coverage of papal funerals not only highlights that billions of people worldwide will watch the event but also includes pictures of journalists, cameras, and crowds of people in St. Peter's Square (Schlott Citation2013, 125, 202, 221). Such reports about the public response of media events are often based on estimations and speculations in the run-up to the event (Fürst Citation2020; Schlott Citation2013).
While the first operationalization (option A) allows a small-scale measurement of all dimensions of the news factor, the second operationalization (option B) can only provide generalized information on the news factor. However, the latter can be coded comparatively faster and more reliable due to the rather broad data collection approach.
Discussion and Conclusion
We argue that the significant media transformations of the last decades—including the growing economic pressures and competition for audience attention and the increase in information channels and availability of metrics—have also led to changes in the selection and presentation of news. Recently, some scholars (Anstead and O’Loughlin Citation2015; Bakardjieva and Gehl Citation2017; von Nordheim, Boczek, and Koppers Citation2018) and journalists (see Gürsel Citation2016, 295–296; McGregor Citation2019, 1079–1080; Molaei Citation2015) have observed that collective attention has become a news factor in itself, but further elaborations and conceptions in international research on news values were hitherto lacking. Existing lists (for an overview, see Eilders Citation2006; Harcup and O’Neill Citation2017; M. Maier et al. Citation2018) include news factors such as reach, relevance, threshold, and magnitude, with a focus on the consequences of an event or the number of people who are or could be affected by an issue. These factors are quite broad and typically capture extreme or harmful events, while other news factors, such as continuity, are generally not mentioned in the text but must be derived by coders. In contrast, the news factor of public response specifically accounts for the growing circulation of attention metrics and new, self-reinforcing dynamics of attention in the digital age (Webster Citation2014). It is driven by journalists explicitly telling their audience about attention hotspots and what “everyone” is talking about. This selection and presentation of topics, events, and actors that are said to attract a huge or unexpected public response and demand are not a completely new phenomenon but have gained prominence due to the media transformations of the last decades. The aim of this paper was to conceptualize, discuss, and empirically illustrate the characteristics of this news factor called public response.
The case study of the 2016 US presidential campaign indicates that public response plays a relevant role in news coverage: Indications of public response were based on generalized linguistic descriptions (“Trump can dominate cable TV, the web, newspapers and talk radio”), memorable metaphors such as “ratings machine” and “king of Twitter,” and the continuous provision of numbers (followers on social media, TV ratings, etc.) by social networks and commercial media research. Moreover, photos of the candidates being watched by media audiences and surrounded by journalists or cheering participants at campaign events constituted visual indications of audience, media, and event response. Trump was clearly portrayed as a candidate who arouses strong public response and who determines the course of public debate. In contrast, Clinton was often portrayed as not being able to draw attention to herself.
The news factor of public response does not only contribute to the analysis and explanation of journalistic news selection and presentation; it also points to two related critical developments in journalism: First, as the case study revealed, most reports did not reflect on how the public response they reported on was generated and what it could predicate. What occurs on Twitter, for example, would appear less significant if placed in the perspective of data on its use in the United States. During the 2016 campaign, less than 10% of Americans used Twitter at least once a week (Pew Research Center Citation2016, 20, Citation2017, 17). Even before the elections, it became known that there were many social bots, paid political trolls, and inactive accounts among Trump's followers (Chadwick Citation2017; Karpf Citation2017; Kollanyi, Howard, and Woolley Citation2016; Woolley and Guilbeault Citation2019). Thus, the actual response of Twitter followers or television viewers is not necessarily a decisive influence. Instead, it is crucial how audience response, but also media and event response, is counted, described, and discussed across various media channels in public discourse. Reports on media response, for instance, were often based on data from media research companies, which according to Chadwick (Citation2017, 259) operated on a questionable and partly non-transparent basis. However, once these measurements and claims of attention hotspots exist and are circulated in the hybrid media system (Chadwick Citation2017), they can lead to more media coverage and self-reinforcing effects, eventually establishing the idea among media users that a particular topic or actor dominates everyone's attention and has high “conversational value” (Atkin Citation1972, 189)—which in turn leads to more users looking for and clicking on such content (Gillespie Citation2016; Knobloch-Westerwick Citation2015; Webster Citation2014).
Second, the analysis also revealed that the very messages that Trump himself often postulated in his campaign events were spread widely, often unchallenged, by news media. Trump's campaign staff have acknowledged that the primary objective was to strategically influence the media agenda, for example, by creating a false impression of the response in online media (Woolley and Guilbeault Citation2019). The organization of few but large campaign events was also aimed at attracting media attention (Chadwick Citation2017, 266; Cosgrove Citation2018, 58–59; Lowe Citation2018, 288–289). Studies on news selection and agenda building have found that politicians and political parties seek to strategically adapt their messages to journalistic selection criteria (Francia Citation2018; McNair Citation2018; Parmelee Citation2014). Future research could, therefore, investigate how actors from politics, the economy, and civil society emphasize their public response in strategic communication and agenda-building efforts, for instance, by analyzing press materials, speeches, and social media accounts.
The analysis at hand is a first step at exploring the news factor of public response and its importance. Future research could investigate the full coverage of presidential campaigns or other topics in order to assess the significance of public response in relation to other news factors. Such studies could address the complementarity hypothesis (Galtung and Ruge Citation1965) and examine whether a high intensity level of public response could compensate for the lack of other news factors. It would be further interesting to analyze television as it does not only promise useful insights with respect to the interplay of text and images (Bednarek and Caple Citation2017; Grabe and Bucy Citation2009; Stengel Citation2013) but is also a very important and widely used news source (Pew Research Center Citation2016, Citation2017; Reuters Institute Citation2016). Such studies would contribute to news value research and broaden our understanding of the metric society and its specific dynamics.
Disclosure Statement
No potential conflict of interest was reported by the author(s).
Notes
1 Parts of this case study have previously been published in German (Fürst and Oehmer Citation2018).
2 This approach contrasts with conceptualizations that normatively define news value as something that should be reported (Strömbäck, Karlsson, and Hopmann Citation2012, 719).
References
- Anderson, B. 1983. Imagined Communities: Reflections on the Origin and Spread of Nationalism. London: Verso.
- Anstead, N., and B. O’Loughlin. 2015. “Social Media Analysis and Public Opinion: The 2010 UK General Election.” Journal of Computer-Mediated Communication 20 (2): 204–220.
- Araujo, T., and T. G. L. A. van der Meer. 2020. “News Values on Social Media: Exploring What Drives Peaks in User Activity about Organizations on Twitter.” Journalism 21 (5): 633–651.
- Atkin, C. 1972. “Anticipated Communication and Mass Media Information-Seeking.” Public Opinion Quarterly 36 (2): 188–199.
- Bakardjieva, M., and R. W. Gehl. 2017. “Critical Approaches to Communication Technology – The Past Five Years.” Annals of the International Communication Association 41 (3–4): 213–219.
- Banducci, S., and C. Hanretty. 2014. “Comparative Determinants of Horse-Race Coverage.” European Political Science Review 6 (4): 621–640.
- Beckers, K., and R. A. Harder. 2016. ““Twitter Just Exploded”: Social Media as Alternative Vox Pop.” Digital Journalism 4 (7): 910–920.
- Bednarek, M., and H. Caple. 2017. The Discourse of News Values: How News Organizations Create Newsworthiness. New York: Oxford University Press.
- Beer, D. 2016. Metric Power. London: Palgrave Macmillan.
- Bor, S. E. 2013. “Lucy’s Two Babies: Framing the First Televised Depiction of Pregnancy.” Media History 19 (4): 464–478.
- Cammaerts, B. 2012. “Protest Logics and the Mediation Opportunity Structure.” European Journal of Communication 27 (2): 117–134.
- Caple, H., and M. Bednarek. 2016. “Rethinking News Values: What a Discursive Approach Can Tell Us about the Construction of News Discourse and News Photography.” Journalism 17 (4): 435–455.
- Chadwick, A. 2017. The Hybrid Media System: Politics and Power. 2nd ed. New York: Oxford University Press.
- Cillizza, C. 2015. Why Is Trump Getting So Much Attention? Washington Post, July 13, A02.
- Colbjørnsen, T. 2014. “The Construction of a Bestseller: Theoretical and Empirical Approaches to the Case of the Fifty Shades Trilogy as an EBook Bestseller.” Media, Culture & Society 36 (8): 1100–1117.
- Cosgrove, K. 2018. “Trump and the Republican Brand Refresh.” In Political Marketing in the 2016 U.S. Presidential Election, edited by J. Gillies, 49–64. Cham: Palgrave Macmillan.
- Couldry, N. 2011. “Making Populations Appear.” In The Politics of Reality Television: Global Perspectives, edited by M. M. Kraidy and K. Sender, 194–206. Abingdon: Routledge.
- Crowley, S. 2016. “President Obama and Mr. Trump Met in the Oval Office.” New York Times, November 8.
- Eilders, C. 1997. Nachrichtenfaktoren und Rezeption. Eine empirische Analyse zur Auswahl und Verarbeitung politischer Information [News Factors and Reception: An Empirical Analysis of Selection and Processing of Political Information]. Opladen: Westdeutscher Verlag.
- Eilders, C. 2006. “News Factors and News Decisions: Theoretical and Methodological Advances in Germany.” Communications 31 (1): 5–24.
- Ertl, S. 2015. Protest als Ereignis. Zur medialen Inszenierung von Bürgerpartizipation [Protests as Events: On the Orchestration of Citizen Participation in the Media]. Bielefeld: Transcript.
- Esser, F., and P. D’Angelo. 2003. “Framing the Press and the Publicity Process: A Content Analysis of Meta-Coverage in Camapign 2000 Network News.” American Behavioral Scientist 46 (5): 617–641.
- Francia, P. L. 2018. “Free Media and Twitter in the 2016 Presidential Election: The Unconventional Campaign of Donald Trump.” Social Science Computer Review 36 (4): 440–455.
- Fürst, S. 2013. “Öffentlichkeitsresonanz als Nachrichtenfaktor—Zum Wandel der Nachrichtenselektion” [Public Response as a News Factor—Exploring Changes of News Selection Criteria]. Medien Journal 37 (2): 4–15.
- Fürst, S. 2020. ““The Whole World Watching”? How News Media Create the Myth of an Audience of Billions and Foster Imagined Communities.” International Journal of Communication 14: 1524–1541.
- Fürst, S., and F. Oehmer. 2018. “„Twitter-Armies“, „Earned Media“ und „Big Crowds“ im US-Wahlkampf 2016: Zur wachsenden Bedeutung des Nachrichtenfaktors Öffentlichkeitsresonanz” [“Twitter-Armies”, “Earned Media”, and “Big Crowds” in the 2016 US Election Campaign: On the Growing Importance of the News Factor Public Response]. In Strategische Politische Kommunikation im digitalen Wandel. Interdisziplinäre Perspektiven auf ein dynamisches Forschungsfeld [Strategic Political Communication in the Digital Transformation: Interdisciplinary Perspectives on a Dynamic Field of Research], edited by M. Oswald, and M. Johann, 35–61. Wiesbaden: Springer VS.
- Fürst, S., and P. Schönhagen. 2018. “Lückenhafte Selbstregulierung der Medien—Herausforderungen durch die Ökonomisierung am Fallbeispiel Schweiz” [Deficient Self-Regulation of the Swiss Media—Ethical Challenges in the Face of Commercialisation]. Studies in Communication and Media (SCM) 7 (3): 271–337.
- Galtung, J., and M. H. Ruge. 1965. “The Structure of Foreign News: The Presentation of the Congo, Cuba and Cyprus Crisis in Four Norwegian Newspapers.” Journal of Peace Research 2 (1): 64–90.
- Gillespie, T. 2016. “#Trendingistrending: When Algorithms Become Culture.” In Algorithmic Cultures: Essays on Meaning, Performance and New Technologies, edited by R. Seyfert and J. Roberge, 52–75. New York: Routledge.
- Grabe, M. E., and E. P. Bucy. 2009. Image Bite Politics: News and the Visual Framing of Elections. New York: Oxford University Press.
- Gürsel, Z. D. 2016. Image Brokers: Visualizing World News in the Age of Digital Circulation. Oakland: University of California Press.
- Haim, M., A. S. Kümpel, and H.-B. Brosius. 2018. “Popularity Cues in Online Media: A Review of Conceptualizations, Operationalizations, and General Effects.” Studies in Communication and Media (SCM) 7 (2): 188–207.
- Harcup, T., and D. O’Neill. 2001. “What Is News? Galtung and Ruge Revisited.” Journalism Studies 2 (2): 261–280.
- Harcup, T., and D. O’Neill. 2017. “What Is News? News Values Revisited (Again).” Journalism Studies 18 (12): 1470–1488.
- Hearn, A. 2016. “Trump’s “Reality” Hustle.” Television & New Media 17 (7): 656–659.
- Heissler, T. 2016. “The Culinary Workers Union in Las Vegas Hosted a Debate Watch Party.” New York Times, October 20.
- Joye, S., A. Heinrich, and R. Wöhlert. 2015. “50 Years of Galtung and Ruge: Reflections on Their Model of News Values and Its Relevance for the Study of Journalism and Communication Today.” Communication and Media 11 (36): 5–28.
- Karpf, D. 2017. “Digital Politics After Trump.” Annals of the International Communication Association 41 (2): 198–207.
- Kepplinger, H. M. 2008. “News Values.” In The International Encyclopedia of Communication, edited by W. Donsbach, Vol. 7, 3281–3286. Malden: Blackwell.
- Kilgo, D. K., S. Harlow, V. García-Perdomo, and R. Salaverría. 2018. “A New Sensation? An International Exploration of Sensationalism and Social Media Recommendations in Online News Publications.” Journalism 19 (11): 1497–1516.
- Kim, J. W. 2018. “Rumor Has It: The Effects of Virality Metrics on Rumor Believability and Transmission on Twitter.” New Media & Society 20 (12): 4807–4825.
- Kim, Y., W. J. Gonzenbach, C. J. Vargo, and Y. Kim. 2016. “First and Second Levels of Intermedia Agenda Setting: Political Advertising, Newspapers, and Twitter During the 2012 U.S. Presidential Election.” International Journal of Communication 10: 4550–4569.
- Knobloch-Westerwick, S. 2015. Choice and Preference in Media Use: Advances in Selective Exposure Theory and Research. New York: Routledge.
- Koblin, J. 2020. “Grammy Awards Hit 12-Year Low in TV Viewers.” New York Times, January 27. https://www.nytimes.com/2020/01/27/business/media/grammy-awards-ratings.html.
- Kollanyi, B., P. N. Howard, and S. C. Woolley. 2016. Bots and Automation over Twitter during the U.S. Election. https://tinyurl.com/Kollanyi-et-al-2016.
- Lang, K., and G. E. Lang. 1953. “The Unique Perspective of Television and Its Effect: A Pilot Study.” American Sociological Review 18 (1): 3–12.
- Lawson, C., and J. A. McCann. 2005. “Television News, Mexico’s 2000 Elections and Media Effects in Emerging Democracies.” British Journal of Political Science 35 (1): 1–30.
- Lowe, B. M. 2018. Moral Claims in the Age of Spectacles: Shaping the Social Imaginary. New York: Palgrave Macmillan.
- Maier, S. 2010. “All the News Fit to Post? Comparing News Content on the Web to Newspapers, Television, and Radio.” Journalism & Mass Communication Quarterly 87 (3–4): 548–562.
- Maier, M., J. Retzbach, I. Glogger, and K. Stengel. 2018. Nachrichtenwerttheorie [News Value Theory]. Baden-Baden: Nomos.
- Mann, L. 1974. “Counting the Crowd: Effects of Editorial Policy on Estimates.” Journalism & Mass Communication Quarterly 51 (2): 278–285.
- Mau, S. 2019. The Metric Society: On the Quantification of the Social. Cambridge: Polity.
- McCarthy, J. D., C. McPhail, and J. Smith. 1996. “Images of Protest: Dimensions of Selection Bias in Media Coverage of Washington Demonstrations, 1982 and 1991.” American Sociological Review 61 (3): 478–499.
- McGregor, S. C. 2019. “Social Media as Public Opinion: How Journalists Use Social Media to Represent Public Opinion.” Journalism 20 (8): 1070–1086.
- McNair, B. 2018. An Introduction to Political Communication. 6th ed. Abingdon: Routledge.
- McPhail, C., and J. McCarthy. 2004. “Who Counts and How: Estimating the Size of Protests.” Contexts 3 (3): 12–18.
- Mertens, M. 2006. “‘Der Rummel wuchs und kumulierte’—Über den Prozess des Medienereignisses” [‘The Hype Grew and Accumulated’—On the Development of a Media Event]. In Wettbewerbsspiele. Die Inszenierung von Sport und Politik in den Medien [Games of Competition: The Staging of Sport and Politics in the Media], edited by J. Schwier and C. Leggewie, 20–41. Frankfurt a. M.: Campus.
- Mills, D. 2016. “Hillary Clinton Disembarking Her Plane.” New York Times, September 9.
- Moernaut, R., J. Mast, and M. Temmerman. 2019. “All Climate Stories Worth Telling: Salience and Positionality at the Intersection of News Values and Frames.” Discourse, Context & Media 28: 93–111.
- Molaei, H. 2015. “Discursive Opportunity Structure and the Contribution of Social Media to the Success of Social Movements in Indonesia.” Information, Communication & Society 18 (1): 94–108.
- Muñoz, C. L., and T. L. Towner. 2017. “The Image is the Message: Instagram Marketing and the 2016 Presidential Primary Season.” Journal of Political Marketing 16 (3–4): 290–318.
- Nelson, J. L. 2020. “The Enduring Popularity of Legacy Journalism: An Analysis of Online Audience Data.” Media and Communication 8 (2): 40–50.
- Parks, P. 2020. “The Ultimate News Value: Journalism Textbooks, the U.S. Presidency, and the Normalization of Donald Trump.” Journalism Studies 21 (4): 512–529.
- Parmelee, J. H. 2014. “The Agenda-Building Function of Political Tweets.” New Media & Society 16 (3): 434–450.
- Patterson, T. E. 2016. News Coverage of the 2016 General Election: How the Press Failed the Voters. Retrieved from http://tinyurl.com/coverage2016election.
- Pew Research Center. 2016. The 2016 Presidential Campaign—A News Event That’s Hard to Miss. Retrieved from http://tinyurl.com/campaign-hard-to-miss.
- Pew Research Center. 2017. Trump, Clinton Voters Divided in Their Main Source for Election News. Retrieved from http://tinyurl.com/main-source-election.
- Preston, P. 2016. “News Values.” In The International Encyclopedia of Political Communication, edited by G. Mazzoleni, Vol. 2, 872–877. Chichester: John Wiley & Sons.
- Proferes, N., and E. Summers. 2019. “Algorithms and Agenda-Setting in Wikileaks’ #Podestaemails Release.” Information, Communication & Society 22 (11): 1630–1645.
- Reuters Institute. 2016. Digital News Report 2016. https://www.digitalnewsreport.org/survey/2016/.
- Riles, J. M., A. Pilny, and D. Tewksbury. 2018. “Media Fragmentation in the Context of Bounded Social Networks: How Far Can It Go.” New Media & Society 20 (4): 1415–1432.
- Roeh, I., and S. Feldman. 1984. “The Rhetoric of Numbers in Front-Page Journalism: How Numbers Contribute to the Melodramatic in the Popular Press.” Text & Talk 4 (4): 347–368.
- Rössler, P., J. Bomhoff, J. F. Haschke, J. Kersten, and R. Müller. 2011. “Selection and Impact of Press Photography: An Empirical Study on the Basis of Photo News Factors.” Communications 36 (4): 415–439.
- Scheufele, B. 2008. “Content Analysis, Qualitative.” In The International Encyclopedia of Communication, edited by W. Donsbach, 967–972. Malden: Blackwell.
- Schlott, R. 2013. Papsttod und Weltöffentlichkeit seit 1878: Die Medialisierung eines Rituals [Papal Death and Worldwide Attention since 1878: The Mediatization of a Ritual]. Paderborn: Ferdinand Schöningh.
- Schulz, W. 1990. Die Konstruktion von Realität in den Nachrichtenmedien. Analyse der aktuellen Berichterstattung [The Construction of Reality in the News Media: Analysis of the Current Coverage]. 2nd ed. Freiburg: Alber.
- Schulz, W. 1997. “Changes of Mass Media and the Public Sphere.” Javnost – The Public 4 (2): 57–69.
- Staab, J. F. 1990. “The Role of News Factors in News Selection: A Theoretical Reconsideration.” European Journal of Communication 5 (4): 423–443.
- Stengel, K. 2013. Bilder in der Krisen- und Konfliktberichterstattung. Relevanz von Fotonachrichtenfaktoren für die Analyse der visuellen Nachrichtenberichterstattung über Konflikte, Krisen und Kriege [Images in Crisis and Conflict Coverage: Relevance of Photo News Factors for the Analysis of Visual News Coverage of Conflicts, Crises, and Wars]. Retrieved from https://tinyurl.com/Stengel-2013.
- Strömbäck, J., M. Karlsson, and D. N. Hopmann. 2012. “Determinants of News Content: Comparing Journalists’ Perceptions of the Normative and Actual Impact of Different Event Properties When Deciding What’s News.” Journalism Studies 13 (5–6): 718–728.
- van Dijck, J., and T. Poell. 2013. “Understanding Social Media Logic.” Media and Communication 1 (1): 2–14.
- von Nordheim, G., K. Boczek, and L. Koppers. 2018. “Sourcing the Sources: An Analysis of the Use of Twitter and Facebook as a Journalistic Source over 10 Years in The New York Times, The Guardian, and Süddeutsche Zeitung.” Digital Journalism 6 (7): 807–828.
- Watkins, S. C. 2001. “Framing Protest: News Media Frames of the Million Man March.” Critical Studies in Media Communication 18 (1): 83–101.
- Weaver, D. H., L. Willnat, and G. C. Wilhoit. 2019. “The American Journalist in the Digital Age: Another Look at U.S. News People.” Journalism & Mass Communication Quarterly 96 (1): 101–130.
- Webster, J. G. 2014. The Marketplace of Attention: How Audiences Take Shape in a Digital Age. Cambridge: MIT Press.
- Wendelin, M., I. Engelmann, and J. Neubarth. 2017. “User Rankings and Journalistic News Selection: Comparing News Values and Topics.” Journalism Studies 18 (2): 135–153.
- Werber, N. 2017. “Trumps Twittern. Der populäre Donald Trump (II)” [Trump’s Tweeting: The Popular Donald Trump (II)]. POP. Kultur und Kritik 6 (2): 39–44.
- Wilke, J. 1984. Nachrichtenauswahl und Medienrealität in vier Jahrhunderten. Eine Modellstudie zur Verbindung von historischer und empirischer Publizistikwissenschaft [News Selection and Media Reality in Four Centuries: A Study on the Connection of Historical and Empirical Journalism Studies]. Berlin: Walter de Gruyter.
- Winter, D. 2016. “At Donald J. Trump’s Encouragement.” New York Times, July 15.
- Woolley, M., and D. R. Guilbeault. 2019. “United States: Manufacturing Consensus Online.” In Computational Propaganda: Political Parties, Politicians, and Political Manipulation on Social Media, edited by M. Woolley and P. N. Howard, 185–211. New York: Oxford University Press.
- Wouters, R. 2013. “From the Street to the Screen: Characteristics of Protest Events as Determinants of Television News Coverage.” Mobilization: An International Quarterly 18 (1): 83–105.
- Wright, T. 2016. “People at a Party for the Debate.” New York Times, October 10.
- Yalkin, D. 2016. “Donald Trump Supporters at a Rally in Fountain Hills.” New York Times, April 17.