
ABSTRACT
The existing literature suggests that individual differences in attachment may be associated with differential trajectories of structural brain development. In addition to maturation during infancy and childhood, developmental trajectories are characteristic of adolescence, a period marked by increasingly complex interpersonal relationships and significant neurostructural and functional plasticity. It remains to be examined whether attachment prospectively relates to neurostructural developmental trajectories during adolescence. In this longitudinal study, we investigated whether self-reported attachment dimensions of anxiety (AX) and avoidance (AV) could predict elements of cortical thickness (CT) and subcortical volume (SV) trajectories in 95 typically developing adolescents (12–19 years old at study baseline). Self-reported scores of AX and AV were obtained at study baseline, and neurostructural development was assessed at baseline and three timepoints over the four following years. Self-reported AX and AV were associated with steeper CT decreases in prefrontal cortical and cortical midline structures as well as anterior temporal cortex, particularly in participants younger at study baseline. Regarding SV, preliminary differential associations were observed between developmental trajectories and attachment dimensions. Our study suggests that interindividual differences in attachment contribute to shaping neurodevelopmental trajectories for several cortical and subcortical structures during adolescence and young adulthood.
1. Introduction
The maturational phase of adolescence is marked by cognitive, neurobiological, and social changes, all of which create a prominent dilemma in youths’ attachment relationships. While adolescents are increasingly drawn to exploring relationships with their peers (Harris, Citation1995; Moretti & Peled, Citation2004), they still aim at maintaining connection with their parents that were continuously built from early infancy (Moretti & Peled, Citation2004). Unlike in infancy, adolescent attachment is characterized by mental, so-called internal working models (IWMs) of the self and others, rather than more specific behavioral dispositions with the principal attachment figure(s) (Main et al., Citation1985). Recently, attachment during adolescence is attracting increased attention, mainly for two reasons: 1) In the context of significant neural plasticity associated with brain development during adolescence, interpersonal experiences with significant others, – especially through attachment bonds – may durably contribute to sculpting neuroarchitecture and influence social behavior (Vrtička et al., Citation2014); 2) Recent research provides neuroscientific evidence against a common misconception portraying attachment as either being adaptive (secure) versus maladaptive (insecure); the contemporary evidence further suggests that (almost) all individual differences in attachment correspond to meaningful adaptations that reflect the nature and availability of social resources ((Main, Citation1981); Fonagy et al., Citation2021). Examining the relationships between individual differences in attachment and adolescent brain morphology (Teicher & Samson, Citation2016) may thus inform on key patterns of bio-behavioral adaptations to social environments during adolescence.
Individual differences in attachment are most commonly assessed via observational measures of behavior (e.g. Strange Situation Procedure, Attachment Q-Sort), semi-structured interviews (e.g. Child or Adult Attachment Interview), or self-reports. The current study examined self-reported attachment via the Relationships Scales Questionnaire (RSQ; Griffin & Bartholomew, Citation1994), a cost- and time-effective approach that nonetheless yields reliable attachment measures along two dimensions: anxiety (AX) and avoidance (AV). Secure attachment during adolescence is grounded in a reliable and flexible relationship with parents that allows for cognitive and emotional autonomy with other significant attachment figures in peer groups and the wider social context (i.e. other adults) (Allen et al., Citation1994). In turn, and according to Brennan et al. (Citation1998), while AX maps anxiety and vigilance concerning rejection and abandonment within close relationships, AV corresponds to discomfort with closeness and dependency, or reluctance to be intimate with others. These descriptions of AX and AV map onto the model of self- and other-dimensions initially proposed by Bartholomew (Citation1990) and Bartholomew and Horowitz (Citation1991), which are generally associated with different underlying mental representations of the self (to have the capacity and efficiency to elicit help when needed) and others (to be available and responsive when needed) (Mikulincer & Shaver, Citation2007). Along these lines, AX is associated with a negative self-image, an excessive need for approval and support from others, and a fear of rejection and abandonment. Conversely, AV is described by a negative image of others, excessive need for self-reliance, and a reluctance of depending on others (Cassidy & Shaver, Citation2008).
In addition to behavioral, physiological, and interpersonal considerations, recent attachment models are also incorporating neurodevelopmental and biological levels of analyses. The adolescent developmental period is marked by significant modifications in neural circuits underpinning affective, psychological, and relational functioning (Newman et al., Citation2015). Because the human brain develops within an interpersonal context, the emerging structural and functional networks are strongly influenced by the availability and quality of social interactions – we are wired to connect with others (Cacioppo & Berntson, Citation1992). Environmental influences during adolescence – and most notably interpersonal relationships – thus critically contribute to shaping brain development, and may yield long-term effects on psychological and emotional functioning (Atzil et al., Citation2018; Shore, Citation1996). The inclusion of neurodevelopmental evidence into models of attachment theory can therefore improve understanding of the bio-behavioral adaptation taking place as the social environment changes during adolescence and young adulthood.
Emerging structural neuroimaging studies examining attachment point to specific associations between insecure attachment profiles and circumscribed brain regions, particularly involving the amygdala, hippocampus, insula, and prefrontal and temporal cortices (Acosta et al., Citation2018; Leblanc et al., Citation2017; Moutsiana et al., Citation2015; Quirin et al., Citation2010). While these studies layd out important preliminary evidence for associations between attachment and brain structure, many findings were restricted to preselected regions of interest, samples were often cross-sectional, and when longitudinal, the initial attachment assessment was performed mainly during infancy. In addition, most previous studies focused on gray matter (GM) volume and specifically subcortical volumes (SV) of the amygdala and hippocampus, leaving much to discover regarding the effects of attachment on the development of particularly cortical brain structure during adolescence.
The present study aimed to advance understanding of the role of attachment experiences in relation to neurodevelopment in adolescents. To this end, we examined how attachment assessed at study baseline predicted neurodevelopmental trajectories over the subsequent 4 years, during which participants were scanned up to four times. Cortical thickness (CT) was assessed as the main measure of brain structure, as it is known to undergo important changes throughout adolescence (Brenhouse & Andersen, Citation2011) and can provide more anatomically specific estimates of age-related structural maturation processes, like cortical thinning, than, for example, volumetric measures (Brown & Jernigan, Citation2012; Lemaitre et al., Citation2012). Volumes of subcortical brain structures (SV) were assessed as secondary outcomes. Based on the above considerations, and a recent functional neuro-anatomical model of human attachment (NAMA) that is situated at the crossroads between neuroanatomy, function, and cognition (Long et al., Citation2020), we hypothesized that AV and AX would be associated with differential neurodevelopmental trajectories during adolescence. As this study was the first to employ a whole-brain longitudinal approach in an adolescent sample, we took an exploratory approach and did not define a-priori predictions pertaining to particularly associated cortical or subcortical brain areas.
2. Methods
2.1. Participants
Ninety-five typically developing adolescents (48 males, 47 females) were included in the present study. At the first timepoint of data collection (study baseline), they were between 12 and 19 years old (mean = 15.9; SD = 1.83). Recruitment was conducted by word of mouth and through advertisement in youth community centres around the canton of Geneva as part of an ongoing longitudinal study. All participants were French-native speakers and received financial compensation. Written informed consent was provided either by adult participants themselves or by the adolescent participants’ legal guardian following study protocols approved by the local ethics commission (Commission Centrale d’éthique de la Recherche des Hôpitaux Universitaires de Genève). To control for normative intellectual functioning (assessed via Wechsler Scales of Intelligence, see 2.3 Measures), volunteers with estimated IQ scores more than 1 standard deviation below the developmental norm were not included in the study; we excluded 4 participants based on these criteria from the initial sample of 99.
2.2. Study design
The present study followed a longitudinal within-subject design. Attachment was assessed at study baseline. MRI scans and covariate measures were acquired at one to four visits per participant over the course of 4 years, with the following intervals: 1 year between baseline and second visit (T0 and T1), 1 year between the second and third visit (T1 and T2), and 2 years between the third and fourth visit (T2 and T3) due to the funding schedule. The number of assessments varied between participants: a total of 272 scans were acquired, comprising 26 adolescents with one, 18 with two, 26 with three, and 33 with four scans. Overall, the longitudinal sample consisted of 95 participants at T0 (mean age = 15.9), 71 participants at T1 (mean age = 17.1), 56 at T2 (mean age = 18.2) and 50 at T3 (mean age = 20.8) see and Supplementary Figure S1.
Table 1. Descriptive statistics of demographic and questionnaire measures at all four measurement timepoints.
2.3. Measures
2.3.1. Questionnaires and neuropsychological tests
We used the Relationship Scales Questionnaire (RSQ; Griffin & Bartholomew, Citation1994) in a validated French translation (Guédeney et al., Citation2010) to measure attachment at the first visit (study baseline). This self-report questionnaire consists of 30 affirmations that participants rated using a 5-point Likert scale. For the purpose of our study, we used a two-dimensional model consisting of AX and AV. Scores for each scale were calculated following Simpson and colleagues’ model (Model 3b in (Kurdek, Citation2002) with AV derived from 8 items (10, 12, 13, 15, 20, 24, 29, 30) and AX from 5 items (11, 18, 21, 23, 25). Mean scores for the AV and AX dimensions were created by averaging all 8 or 5 items, respectively, yielding internal consistency (Cronbach’s alpha values) of 0.651 for AV and 0.762 for AX. Details on the usage of RSQ in adolescent populations can be found in Supplementary methods A.
Adaptive functioning and problems were assessed at each measurement timepoint using the Youth Self Report questionnaire (YSR, Bordin et al., Citation2013) and Adult Self Report (ASR, Mahr et al., Citation2018). Thereby obtained internalizing (withdrawal, anxiety, depression, and somatic complaints) and externalizing (attention problems, aggressive behaviors, and delinquency) scores were used as covariates of no interest to further isolate the specific contribution of attachment.
Estimated IQ scores were calculated at each timepoint based on the average of standardized scores of the Block Design and Vocabulary subtest of the Wechsler Scales of Intelligence for children (WISC-IV; W. D. Wechsler, Citation2003) or the Wechsler Adult Intelligence Scale (WAIS-IV; D. Wechsler, Citation1997) and termed “Wechsler_av.”
2.3.2. MRI measures
2.3.2.1. MRI acquisition
All structural magnetic resonance imaging (MRI) scans were acquired on a 3-Tesla Siemens Trio scanner, located either at the University Hospital of Geneva (HUG, N = 215), or at the Brain Behavioral Laboratory at the University of Geneva (BBL, N = 77). The only scanner difference was location. Out of the 95 participants included in the study, 15 were scanned only at the BBL at all timepoints, and 60 were scanned only at the HUG at all timepoints. For the remaining 20 participants, some scans were performed at BBL and some at HUG. Attachment scores did not differ between these participant groups (see Supplementary analysis 2) and scanner location was added as a covariate of no interest to all analyses to control for potential unforeseeable confounds associated with scanning site. At both study sites, the 3D volumetric MRI pulse sequence was acquired with identical parameters: TR = 2500 ms, TE = 3 ms, flip angle = 8 degree, acquisition matrix = 256 x 256, slice thickness = 1.1 mm, field of view = 22 cm. The number of anatomical T1 slices acquired was 192.
2.3.2.2. MRI data preprocessing
Preprocessing was conducted using FreeSurfer software version 6 (http://surfer.nmr.mgh.harvard.edu) and following the pipeline for fully automated preparation for three-dimensional cortical model images in line with previously described steps (Dale et al., 1999; Fischl et al., 1999). For each participant, white matter and pial surfaces were visually checked and manually corrected if necessary. A longitudinal processing step was included to reduce within-subject variability by creating a within-subject unbiased template and an average image using inverse consistent registration (see Supplementary methods B for details).
2.3.2.3. Extraction of cortical thickness (CT) and subcortical volume (SV)
Cortical thickness (CT) was calculated across the whole outer surface of the brain as the shortest distance between the white-matter and pial surfaces in mm, computed at each vertex bilaterally, and smoothed using a full width at half maximum (FWHM) kernel of 15 mm. Left and right thalamus, lateral ventricle, pallidum, accumbens, caudate, putamen, hippocampus, and amygdala as well as intracranial volumes (ICVs) were obtained from the preprocessed scans (see above) by following the Enigma protocol for extraction of volumes values (enigma.usc.edu; Stein et al., Citation2012). Lateral ventricles can provide an indirect estimate of loss of GM volume and continuously enlarge during the lifespan, starting in adolescence (Dima et al., Citation2021). For quality control, all regions of interest (ROIs) with a volume larger than or <1.5 times the interquartile range were identified and visually inspected by overlaying their segmentation on the subjects’ anatomical images. ROI data for which segmentation was judged accurate were included in statistical analyses, no scans had to be excluded. Freesurfer segmentation of SV is shown in .
2.4 Statistical analyses
2.4.1. General considerations
Linear mixed effect models (LMMs) (Bates et al., Citation2015) were used for all analyses. Neurodevelopmental trajectories of CT and SV were modelled through the influence of a variable “time” that indicated the number of years passed since baseline assessment. In preparation for our main attachment analyses, we first tested for the presence of normative linear and non-linear (i.e. quadratic term of time) trajectories of neurodevelopment. We additionally explored interactions with participant age (i.e. time by age), as neurodevelopmental trajectories may have different cadences depending on participant age at baseline, which spanned a relatively large range in this sample. Subsequently, interactions between significant linear and non-linear neurodevelopmental trajectories of CT and SV and attachment were examined. These attachment models were first calculated with the variables AX, AV, and time, the covariates outlined further below, and a random intercept for subject. Subsequently, the robustness of outcomes was examined by repeating all analyses with added covariates for intelligence and internalizing and externalizing, as well as random slopes for the effect of time to account for subject-level variation in the trajectories (see 2.4.5 Full statistical model).
Each measure of attachment (AV, AX) and outcome (whole-brain CT, SV) addressed a separate hypothesis, such that the corresponding analyses were considered part of different test families. In a first step, we assessed the evidence for a main effect of attachment on outcome measures across all timepoints. For each of the four test families, we then examined the two hypothesized associations between brain structure and attachment: interaction between attachment and linear as well as non-linear neurodevelopmental trajectories. Since this study took an exploratory approach, all statistical tests were two-tailed.
2.4.2. Cortical thickness
For the assessment of neurodevelopmental trajectories of CT, we performed whole-brain LMM analyses using SurfStat for Matlab (version 9.7.0) (Worsley et al., Citation2009). Within SurfStat, statistical results were corrected for multiple comparisons according to random field theory, using a cluster-determining threshold (CDT) of p < .005 and familywise error corrections (FWE) of p < .05 (2-tailed). This corresponds to the recommended CDT threshold for the analysis of surface-based CT data smoothed with FWHM >10 mm (Greve & Fischl, Citation2018). Effect sizes were calculated as effect size correlations r through the following formula: r = t/√ (t2 + df)) (Rosnow et al., Citation2000).
2.4.3. Subcortical volumes
For the evaluation of SV, left and right hemispheres were analyzed jointly by taking the sum of volumetric estimates of each of eight ROIs by using the statistical software R (version 3.6.3). The association of attachment with neurodevelopmental trajectories in SV was evaluated by comparing the fit of a full model with a reduced model that lacked only the term of interest (see below). Comparisons were computed by means of likelihood ratio tests (Dobson, Citation2002). The main terms of interest were interactions between the time variable and either AX or AV.
Since we took an exploratory approach to the relation between attachment and SV, we did not formulate differential hypotheses regarding associations with the various ROIs. As such, the analysis of each ROI addressed the same test family of an association between either avoidant or anxious attachment with subcortical brain structure. To correct for the resulting multiple comparisons within attachment analyses, we examined whether results would hold after a false discovery rate (FDR; Benjamini & Hochberg, Citation1995) correction was applied.
2.4.4. Covariates
To differentiate between the influence of the related attachment dimensions, AV was included as a control variable in models of AX, and vice versa. In each analysis, age was added as an essential covariate of interest and sex and MRI scanner location as covariates of no interest (see Supplementary methods C for details on covariate inclusion). In follow-up analyses to significant results, we examined whether results would hold when controlling for current internalizing and externalizing scores as well as intellectual functioning (average between Wechsler’s WISC/WAIS-IV Block Design and Vocabulary standardized score; Wechsler_av). All covariates were entered in the model as standardized variables (mean-centered and scaled across the sample).
2.4.5. Full statistical model
According to the above, the full LMM for a linear neurodevelopmental trajectory in CT or SV included the following terms:
CT/SVij = ß0 + ß1*timej + ß2*AXi + ß3*AVi + ß4*agei + ß5*sexi + ß6*sitei + ß7*timej*(AXi/AVi)
+ [ß8*Wechsler_avi + ß9*externalizingi + ß10*internalizingi]
+ ß11*age*(AXi/AVi) + ß12*time*age*(AXi/AVi)
+ rand(subj)i + rand(timej|subj)i
where ß0 is the intercept, i = subject, j = timepoint of measurement, and rand(subj) and rand (time|subj) are the random intercept and slope, respectively. Square brackets indicate parts of the full model only used in follow-up analyses to significant results. Age interactions (third row) were added in a second analysis step.
3. Results
3.1. Descriptive statistics
Descriptives of demographic and questionnaire measures at all timepoints are summarized in . Exclusions and dropouts across all timepoints are presented in Supplementary Table S1 (Supplementary analysis 3 reveals no evidence that attrition affected overall sample characteristics). Supplementary Table S2 shows the correlations between the demographic data and attachment dimensions (AX, AV). Raw SV values per ROI and timepoint are provided in Supplementary Table S3.
3.2. Cortical thickness
The preparatory LMMs of normative ageing-dependent neurodevelopment trajectories revealed widespread linear cortical thinning throughout the cortex (mean values across significant clusters: t(267) = −6.55, p < .001, r = .372; , A1). In almost all affected regions, the cadence of these negative trajectories depended on participant age (mean t(266) = 3.19, p < .001, r = .192), with less pronounced CT decrease at older ages (, A2). Detailed results of these analyses are presented in Supplementary analysis 1).
Figure 1. Neurodevelopmental trajectories of cortical thickness and associations with age and attachment.
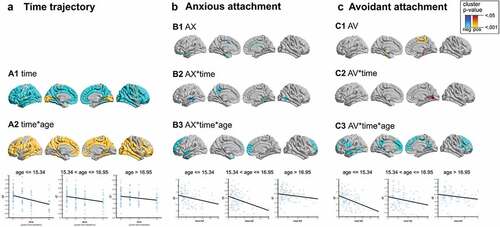
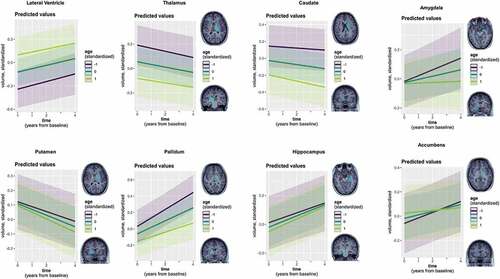
Figure 2. Linear neurodevelopmental trajectories of subcortical volumes as a function of age.
Regarding associations of attachment dimensions with CT trajectories, a main negative effect of AX on CT (across all timepoints) was found in parts of the left anterior temporal lobe (mean t(262) = −2.16, p = .016, r = .132; , B1). AV, in contrast, was positively associated with CT across all timepoints in the medial temporal lobe and in parts of the right precuneus (mean t(262) = 2.20, p = .014, r = .135; , C1).
When subsequently examining associations between attachment and linear CT trajectories (i.e. interaction between AX/AV and the factor time), for AX, significant negative effects emerged bilaterally in the medial temporal lobes and in the left precuneus (mean t(261) = −2.27, p = .012, r = .139). For AV, a single positive association was identified in the right medial posterior temporal lobe (mean t(261) = 2.26, p = .012, r = .139). Relative to the predominant time-dependent cortical thinning, these interactions indicated stronger decrease in CT for participants with higher AX scores, and attenuated decrease for those with higher AV scores in the, respectively, identified clusters (, B2 and C2).
Finally, there were significant interactions of AX as well as AV with time and participant age at baseline. For AX, this interaction was more strongly localized in the prefrontal cortex (mean t(258) = −2.43, p = .008, r = .150). For AV, the interaction was more widespread across the prefrontal cortex, and included parts of the temporal lobe and precuneus (mean t(258) = −2.28, p = .012, r = .141). Visual depiction of these associations by means of three separate scatter plots according to age at baseline suggested that the (negative) association between attachment and CT was more pronounced in the lower two age ranges (, B3 and C3).
All above-described results on the association between attachment and CT are based on models that controlled for the additional covariates of intellectual ability and internalizing and externalizing, which did not affect any of the results. While less widespread non-linear neurodevelopmental trajectories in CT were found (Supplementary Figure S2), these showed no significant interactions with attachment.
3.3. Subcortical volumes
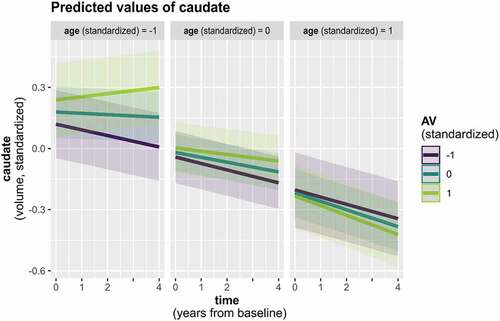
Preparatory LMMs of normative neurodevelopment revealed positive as well as negative trajectories in SV depending on the examined ROI, three of which again depended on participant age (; for details see Supplementary analysis 1 and Supplementary Tables S4 and S5). As done for CT, we subsequently assessed associations with attachment via 1) a main effect of attachment, 2) interaction of attachment and time, and 3) interaction of attachment, time, and participant age (in the three ROIs showing normative time by age interactions). Across all timepoints, a main negative effect of AX was only observed in the caudate, associating higher AX scores with generally smaller caudate volume (Supplementary Table S6). In the accumbens area, we furthermore found an interaction with time and AX ( and Supplementary Table S7). Both results turned marginal following FDR correction (p < .10). Finally, an interaction with time, age, and AV emerged in the caudate ( and Supplementary Table S8). However, this result did not hold after FDR correction was applied (p = .12). Results on the influence of attachment were comparable when controlling for the additional covariate measures of intellectual functioning (Wechsler_av) and internalizing and externalizing behaviors. All models’ residuals displayed satisfactory approximation to normal distribution, despite a tendency to slight left skew in the caudate models.
Figure 3. Accumbens area volume trajectory by AX.
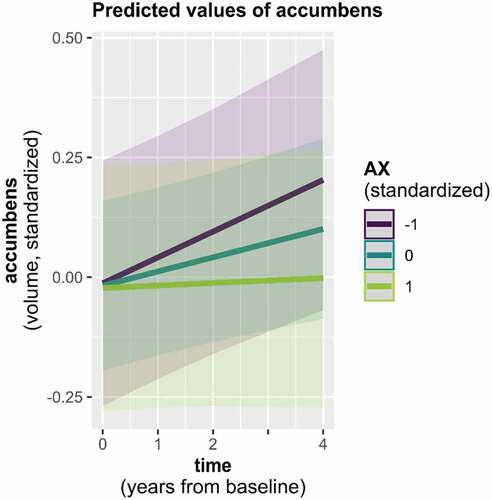
Figure 4. Caudate volume trajectory by age and AV.
4. Discussion
The present study examined the associations between self-reported attachment anxiety (AX) and avoidance (AV) at baseline and prospective neurodevelopmental trajectories in cortical thickness (CT) and subcortical volume (SV) in a group of typically developing adolescents enrolled at ages 12 to 19 years. In line with evidence from previous neurodevelopmental studies (Brouwer et al., Citation2020; Herting et al., Citation2018; Mills et al., Citation2016; Tamnes et al., Citation2017a), we found that CT decreased with ageing overall, and more strongly so for participants who were younger at study baseline. Interestingly, SV showed a somewhat different pattern, with both volumetric decreases and increases with ageing; the latter pattern was also partially influenced by participant age at study baseline (Supplementary analysis 1). With regards to prospective associations between self-reported attachment and brain development trajectories, both AX and AV were associated with steeper CT decreases in prefrontal cortical and cortical midline structures as well as anterior temporal cortex, particularly in participants younger at study baseline. For SV, a similar but less robust association emerged for AX in the accumbens and AV in the caudate. Below, these results are discussed in detail and in reference to studies focusing on GM volume. Despite the unique properties of CT, both measures are comparable, since volumetric measures are determined by a combination of cortical thickness and surface area, and the dominant contributor to volume reductions during adolescence is cortical thinning (Tamnes et al., Citation2017a).
4.1. Main effects of AX and AV
We observed a negative effect of AX on CT, specifically in the anterior temporal lobe. AV was associated with greater CT, specifically in medial temporal lobe and parts of the right precuneus. This negative effect of AX on CT is consistent with Benetti and colleagues’ study (Benetti et al., Citation2010), reporting that AX was negatively correlated with GM volume in middle and inferior temporal gyri. In the same study a positive association at trend level in the superior temporal gyrus was also reported. On the contrary, Zhang et al. (Citation2018) described a negative correlation between AV and GM volumes in the middle and superior temporal gyri and the temporal pole. Such discrepancies may emanate from different methodologies; we used a longitudinal design, while both above-mentioned studies applied cross-sectional approaches. Moreover, both previous studies measured attachment in adults, whereas we used measures at the beginning of adolescence. Overall, observing distinct neural correlates for AX and AV corroborates psychological models that suggest two affective dimensions that may represent distinct early influences on brain morphology and function (Gillath et al., Citation2005; Vrtička et al., Citation2008). However, it appears that trajectories of brain maturation, as we will see below, do not necessarily reveal the same opposite directions of influence of AX and AV.
4.2. Associations between cortical thickness, attachment, and age
Our longitudinal analyses revealed more pronounced decrease in CT in younger participants in association with both AX and AV and thus insecure attachment more generally. Such pattern was particularly prominent in prefrontal cortical areas, and further extended to parts of the temporal lobe and precuneus for AV.
Evidence for links between normative variations in attachment and brain development is scarce, as almost all relevant previous studies investigated parental behavior rather than the child-parent relationship by taking child attachment into account – as we did here. Regarding the prefrontal cortex, the presence of more positive maternal behavior was associated with accelerated prefrontal cortical thinning in adolescents (Whittle et al., Citation2014). In turn, negative aspects of parental behavior (i.e. aggression) were related to attenuated cortical thinning in right superior frontal gyrus during adolescence (Whittle et al., Citation2016). In the opposite direction, maltreated children exhibited reduced CT in an extended cluster including the superior frontal gyrus and orbitofrontal cortex (Kelly et al., Citation2013). Furthermore, a longitudinal study reported that parental sensitivity in infancy (observed at child age between 1 and 4 years) was associated with larger total GM volume as well as thicker cortex in the middle frontal gyri at child age 8 years (Kok et al., Citation2015). Discrepancies between these previous results and our data may be linked to participant age and measures employed in each study. In Kelly and colleagues’ study, the authors used documented experiences of maltreatment in a sample of children. In Kok and colleagues’ study, the authors looked at early caregiving (in terms of maternal and paternal sensitivity). Conversely, in the present study, we measured adolescent’s self-reported attachment.
Participant age may be key to interpreting the available data in the literature. In our study, AV was also associated with steeper CT decline in parts of the temporal lobe, and AX with steeper CT decline in the medial temporal lobe, both in combination with participant age at baseline. Our findings may be linked to previously reported decreases in GM volume in the temporal pole and inferior temporal gyrus in adult participants scoring high on AX, as assessed with the ECR attachment self-report questionnaire (Benetti et al., Citation2010). AX was also correlated negatively with GM volume of the anterior temporal pole in another study (Acosta et al., Citation2018). Our results pertaining to AX thus suggest attachment-related variations of GM maturation in regions implicated in emotion and stress regulation (Benetti et al., Citation2010; Quirin et al., Citation2010). Accordingly, the same association possibly emerged for AV, which is at odds with a previous report associating AV positively with GM volume in the anterior temporal pole (Benetti et al., Citation2010). It should, however, be noted that this previously reported association did not survive corrections for multiple comparisons. In line with our argumentation pertaining to AX above, decreased CT in parts of the temporal lobe may also be indicative of altered emotion and stress regulation processes associated with AV – as noted by the recently developed functional neuro-anatomical model of human attachment (NAMA, Long et al., Citation2020).
Our findings also revealed a link between AV and CT in posterior cingulate cortex (PCC), again in association with participant age at baseline. This may hint to the nature of the structure–function relationship over development, as indeed we observed a decreasing pattern of CT in the PCC, with higher AV associated with steeper rate of thinning along adolescence. From the standpoint of the NAMA model (Long et al., Citation2020), the PCC, in association with the precuneus, is included in the mental state representation module, which is associated with the maintenance of representations of internally focused information about others (Murray et al., Citation2015). This module is also linked with the development of internal working models (IWMs) of attachment. Our results could thus be interpreted to reflect how differences in AV influence this module and internal representation during adolescence. Further research combining structure-function measures prospectively during adolescence would be necessary to test this working hypothesis.
4.3. Associations between subcortical volume, attachment, and age
We observed preliminary associations between AX and SV development in the accumbens, and between AV and SV in the caudate. Within the NAMA model, these two structures are both part of the approach module (Long et al., Citation2020). The functional roles most commonly attributed to the accumbens implicate cognitive processing and motor planning in the context of rewarding activities (Mannella et al., Citation2013). Research in youths with reactive attachment disorder revealed a modification of the dopaminergic signaling pathway (Takiguchi et al., Citation2015), implying atypical reward processing in relation to insecure attachment, and particularly AV. Atypical reward signaling may also affect the intrinsically rewarding value attributed to peer and social relationships (Luyten et al., 2020), and social feedback processing in adolescents related to attachment (Vrtička et al., Citation2014). From a structural brain maturation point of view, our prospective results may suggest the ways in which, over the adolescent years, reward is processed and may gradually sculpt the adolescent brain morphology in specific areas. Altogether, our results seem to provide evidence for the hypothesis of Teicher and Samson (Citation2016), who propose that individual differences in attachment might be associated with the trajectory of brain development over time, rather than brain structure at one specific period of development.
4.4. Summary
In this study, we depict the developmental aspects of potential brain-attachment associations in a healthy adolescent sample. Specifically, our results suggest that AX and AV may be related to brain maturation processes in several brain areas and systems. Most associations were found with prospective cortical thinning and depended on participant age. Thus, our data tentatively suggest that the two attachment dimensions are more strongly associated with brain development in early adolescence. While we find age-dependent relations between AX and CT within areas of the prefrontal cortex, AV was associated with CT in wider parts of the prefrontal cortex, as well as the temporal cortex and precuneus. We additionally report preliminary evidence for differential relations of subcortical volumes with attachment that will, however, require replication: AX was related to the developmental trajectory of the accumbens area early in adolescence, and AV to caudate development during this same developmental window. We conclude that adolescent attachment experiences likely shape brain development in regions involved in social, cognitive, and emotional functioning. For instance, repeated experiences of a lack of others’ availability, continuity, and quality in meaningful relationships during a period of increased dependency on social resources may associate with insecure attachment dimensions. Adolescent insecure attachment potentially exerts a selective pressure to adopt a style of socio-relational functioning that more rapidly consolidates to tackle the environmental challenges as sampled by the teenager (Fonagy et al., Citation2021). These novel results motivate future research specifically assessing associations between attachment and brain development during adolescence and not only focus on earlier (childhood: 0–12 years old) and later (young adults: 23–30 years old) time windows. New insights may thus be gained in the study of both resilience and risk factors for psychopathology during the first three decades of life, a period during which almost all mental illnesses emerge.
4.5. Limitations
The current results should be interpreted in the context of some limitations. First, we investigated developmental differences only during adolescence. Future work should ideally investigate brain maturation comprehensively during childhood, adolescence, and early adulthood – as mentioned in section 4.4. For example, it would be of interest to replicate our findings with inclusion of a younger population (i.e. starting at child age 8 years) and further along the third decade of life, where individuals engage in active social roles and build their own family systems. Second, although our study design and statistical analysis approach principally allowed for the directional interpretation that attachment measured at study baseline predicts subsequently observed structural development, we cannot rule out that unmeasured confounding factors influenced baseline attachment scores and/or following neurodevelopmental trajectories. Notably, neurodevelopmental processes occurring before study baseline might have affected how youth reported on attachment during adolescence. Finally, an additional potential limitation is the use of a self-report measure to derive individual differences in attachment. There is ongoing discussion about similarities versus discrepancies of narrative versus self-report measures of attachment on both a theoretical (Roisman, Citation2009) as well as applied neuroimaging (Yaseen et al., Citation2016) level. Future studies should ideally include a range of attachment measures and compare their associations with brain maturation trajectories.
Author contributions
M. Debbané initiated and secured all funding for the project. M. Derome processed and prepared and L. Puhlmann analysed the data. M. Debbané, L. Puhlmann, M.Derome, and P. Vrtička drafted and all authors critically revised the manuscript, and approved its final version for publication. All authors contributed to the interpretation of the data.
Supplemental Material
Download PDF (614.1 KB)Acknowledgments
We wish to thank all the participants who kindly volunteered for this study as well as Elodie Toffel, Valentina Dergun, and Deborah Badoud, for their help in data collection. The authors have declared that there are no conflicts of interest in relation to the subject of this study.
Disclosure statement
No potential conflict of interest was reported by the author(s).
Data availability statement
The data that support the findings of this study are available on request from the corresponding author, M. Debbané. The data are not publicly available due to their containing information that could compromise the privacy of research participants.
Supplementary material
Supplemental data for this article can be accessed https://doi.org/10.1080/14616734.2021.1993628.
Additional information
Funding
References
- Acosta, H., Jansen, A., Nuscheler, B., & Kircher, T. (2018). A voxel-based morphometry study on adult attachment style and affective loss. Neuroscience, 392, 219–229. https://doi.org/10.1016/j.neuroscience.2018.06.045
- Allen, J. P., Hauser, S. T., Bell, K. L., & O’Connor, T. G. (1994). Longitudinal assessment of autonomy and relatedness in adolescent-family interactions as predictors of adolescent ego development and self-esteem. Child Development, 65(1), 179. https://doi.org/10.2307/1131374
- Atzil, S., Gao, W., Fradkin, I., & Barrett, L. F. (2018). Growing a social brain. Nature Human Behaviour, 2(9), 624–636. https://doi.org/10.1038/s41562-018-0384-6
- Bartholomew, K. (1990). Avoidance of intimacy: An attachment perspective. Journal of Social and Personal Relationships, 7(2), 147–178. https://doi.org/10.1177/0265407590072001
- Bartholomew, K., & Horowitz, L. M. (1991). Attachment Styles among Young Adults: A Test of A Four-Category Model, 61(2), 226–244.
- Bates, D., Mächler, M., Bolker, B., & Walker, S. (2015). Fitting linear mixed-effects models using lme4. Journal of Statistical Software, 67(1). https://doi.org/10.18637/jss.v067.i01
- https://doi.org/10.1177/0963721419837670
- Benetti, S., McCrory, E., Arulanantham, S., De Sanctis, T., McGuire, P., & Mechelli, A. (2010). Attachment style, affective loss and gray matter volume: A voxel-based morphometry study. Human Brain Mapping, 31(10), 1482–1489. https://doi.org/10.1002/hbm.20954
- Benjamini, Y., & Hochberg, Y. (1995). Controlling the false discovery rate: A practical and powerful approach to multiple testing. Journal of the Royal Statistical Society: Series B (Methodological), 57(1), 289–300. https://doi.org/10.1111/j.2517-6161.1995.tb02031.x
- Bordin, I. A., Rocha, M. M., Paula, C. S., Teixeira, M. C. T. V., Achenbach, T. M., Rescorla, L. A., & Silvares, E. F. M. (2013). Child Behavior Checklist (CBCL),Youth Self-Report (YSR) and Teacher’s Report Form(TRF): An overview of the development of the original and Brazilian versions. Cadernos De Saúde Pública, 29(1), 13–28. https://doi.org/10.1590/S0102-311X2013000100004
- Brenhouse, H. C., & Andersen, S. L. (2011). Developmental trajectories during adolescence in males and females: A cross-species understanding of underlying brain changes. Neuroscience & Biobehavioral Reviews, 35(8), 1687–1703. https://doi.org/10.1016/j.neubiorev.2011.04.013
- Brennan, K. A., Clark, C. L., & Shaver, P. R. (1998). Self-report measurement of adult attachment: An integrative overview. In Attachment theory and close relationships (pp. 46–76). The Guilford Press.
- Brouwer, R. M., Schutte, J., Janssen, R., Boomsma, D. I., Hulshoff Pol, H. E., & Schnack, H. G. (2020). The speed of development of adolescent brain age depends on sex and is genetically determined. Cerebral Cortex, bhaa296. https://doi.org/10.1093/cercor/bhaa296
- Brown, T. T., & Jernigan, T. L. (2012). Brain development during the preschool years. Neuropsychology Review, 22(4), 313–333. https://doi.org/10.1007/s11065-012-9214-1
- Cacioppo, J. T., & Berntson, G. G. (1992). Social psychological contributions to the decade of the brain: Doctrine of multilevel analysis. American Psychologist, 47(8), 1019–1028. https://doi.org/10.1037/0003-066X.47.8.1019
- Cassidy, J., & Shaver, P. R. (Eds.). (2008). Handbook of attachment: Theory, research, and clinical applications (2nd ed.). Guilford Press.
- Dima, D., Modabbernia, A., Papachristou, E., Doucet, G. E., Agartz, I., Aghajani, M., Akudjedu, T. N., Albajes‐Eizagirre, A., Alnæs, D., Alpert, K. I., Andersson, M., Andreasen, N. C., Andreassen, O. A., Asherson, P., Banaschewski, T., Bargallo, N., Baumeister, S., Baur‐Streubel, R., & Bertolino, A.; Karolinska Schizophrenia Project (KaSP). (2021). Subcortical volumes across the lifespan: Data from 18,605 healthy individuals aged 3–90 years. Human Brain Mapping, 1-18, . https://doi.org/10.1002/hbm.25320
- Dobson, A. J. (2002). An introduction to generalized linear models (2nd ed.). Chapman & Hall/CRC.
- https://doi.org/10.1002/ab.20396
- https://doi.org/10.1111/jcpp.12302
- Fonagy, P., Campbell, C., Constantinou, M., Higgitt, A., Allison, E., & Luyten, P. (2021). Culture and psychopathology: An attempt at reconsidering the role of social learning. Development and Psychopathology, 1–16. https://doi.org/10.1017/S0954579421000092
- Gillath, O., Bunge, S. A., Shaver, P. R., Wendelken, C., & Mikulincer, M. (2005). Attachment-style differences in the ability to suppress negative thoughts: Exploring the neural correlates. NeuroImage, 28(4), 835–847. https://doi.org/10.1016/j.neuroimage.2005.06.048
- Greve, D. N., & Fischl, B. (2018). False positive rates in surface-based anatomical analysis. NeuroImage, 171, 6–14. https://doi.org/10.1016/j.neuroimage.2017.12.072
- Griffin, D., & Bartholomew, K. (1994). Models of the Self and Other: Fundamental Dimensions Underlying Measures of Adult Attachment, 67(3), 430–445.
- Guédeney, N., Fermanian, J., & Bifulco, A. (2010). La version française du Relationship Scales Questionnaire de Bartholomew (RSQ, Questionnaire des échelles de relation): Étude de validation du construit. L’Encéphale, 36(1), 69–76. https://doi.org/10.1016/j.encep.2008.12.006
- Harris, J. R. (1995). Where Is the Child’s Environment? A Group Socialization Theory of Development, 32.
- Herting, M. M., Johnson, C., Mills, K. L., Vijayakumar, N., Dennison, M., Liu, C., Goddings, A.-L., Dahl, R. E., Sowell, E. R., Whittle, S., Allen, N. B., & Tamnes, C. K. (2018). Development of subcortical volumes across adolescence in males and females: A multisample study of longitudinal changes. NeuroImage, 172, 194–205. https://doi.org/10.1016/j.neuroimage.2018.01.020
- Kelly, P. A., Viding, E., Wallace, G. L., Schaer, M., De Brito, S. A., Robustelli, B., & McCrory, E. J. (2013). Cortical thickness, surface area, and gyrification abnormalities in children exposed to maltreatment: Neural markers of vulnerability? Biological Psychiatry, 74(11), 845–852. https://doi.org/10.1016/j.biopsych.2013.06.020
- Kok, R., Thijssen, S., Bakermans-Kranenburg, M. J., Jaddoe, V. W. V., Verhulst, F. C., White, T., van IJzendoorn, M. H., & Tiemeier, H. (2015). Normal variation in early parental sensitivity predicts child structural brain development. Journal of the American Academy of Child & Adolescent Psychiatry, 54(10), 824–831.e1. https://doi.org/10.1016/j.jaac.2015.07.009
- Kurdek, L. A. (2002). On being insecure about the assessment of attachment styles. Journal of Social and Personal Relationships, 19(6), 811–834. https://doi.org/10.1177/0265407502196005
- Leblanc, É., Dégeilh, F., Daneault, V., Beauchamp, M. H., & Bernier, A. (2017). Attachment security in infancy: A preliminary study of prospective links to brain morphometry in late childhood. Frontiers in Psychology, 8, 2141. https://doi.org/10.3389/fpsyg.2017.02141
- Lemaitre, H., Goldman, A. L., Sambataro, F., Verchinski, B. A., Meyer-Lindenberg, A., Weinberger, D. R., & Mattay, V. S. (2012). Normal age-related brain morphometric changes: Nonuniformity across cortical thickness, surface area and gray matter volume? Neurobiology of Aging, 33(3), 617.e1–617.e9. https://doi.org/10.1016/j.neurobiolaging.2010.07.013
- Long, M., Verbeke, W., Ein-Dor, T., & Vrtička, P. (2020). A functional Neuro-Anatomical Model of Human Attachment (NAMA): Insights from first- and second-person social neuroscience. Cortex, S0010945220300356. https://doi.org/10.1016/j.cortex.2020.01.010
- Mahr, S., Petot, J. M., Camart, N., & Zebdi, R. (2018). Structure factorielle et qualités psychométriques de la version française du questionnaire d’auto-description pour adultes (adult self-report) d’Achenbach et Rescorla. Psychologie Française, 63(1), 23–36. https://doi.org/10.1016/j.psfr.2016.12.001
- Main, M. (1981). Avoidance in the service of attachment: A working paper. Behavioral Development: The Bielefeld Interdisciplinary Project, New York: Cambridge University Press, 651–693.
- Main, M., Kaplan, N., & Cassidy, J. (1985). Security in infancy, childhood, and adulthood: A move to the level of representation. Monographs of the Society for Research in Child Development, 50(1/2), 66. https://doi.org/10.2307/3333827
- Mannella, F., Gurney, K., & Baldassarre, G. (2013). The nucleus accumbens as a nexus between values and goals in goal-directed behavior: A review and a new hypothesis. Frontiers in Behavioral Neuroscience, 7. https://doi.org/10.3389/fnbeh.2013.00135
- Mikulincer, M., & Shaver, P. R. (2007). Attachment in adulthood: Structure, dynamics, and change. Guilford Press.
- Mills, K. L., Goddings, A.-L., Herting, M. M., Meuwese, R., Blakemore, S.-J., Crone, E. A., Dahl, R. E., Güroğlu, B., Raznahan, A., Sowell, E. R., & Tamnes, C. K. (2016). Structural brain development between childhood and adulthood: Convergence across four longitudinal samples. NeuroImage, 141, 273–281. https://doi.org/10.1016/j.neuroimage.2016.07.044
- Moretti, M. M., & Peled, M. (2004). Adolescent-parent attachment: Bonds that support healthy development. Paediatrics & Child Health, 9(8), 551–555. https://doi.org/10.1093/pch/9.8.551
- Moutsiana, C., Johnstone, T., Murray, L., Fearon, P., Cooper, P. J., Pliatsikas, C., Goodyer, I., & Halligan, S. L. (2015). Insecure attachment during infancy predicts greater amygdala volumes in early adulthood. Journal of Child Psychology and Psychiatry, 56(5), 540–548. https://doi.org/10.1111/jcpp.12317
- Murray, R. J., Debbané, M., Fox, P. T., Bzdok, D., & Eickhoff, S. B. (2015). Functional connectivity mapping of regions associated with self- and other-processing: self & other functional connectivity mapping. Human Brain Mapping, 36(4), 1304–1324. https://doi.org/10.1002/hbm.22703
- Newman, L., Sivaratnam, C., & Komiti, A. (2015). Attachment and early brain development – Neuroprotective interventions in infant–caregiver therapy. Translational Developmental Psychiatry, 3(1), 28647. https://doi.org/10.3402/tdp.v3.28647
- https://doi.org/10.1016/j.cortex.2014.02.010
- Quirin, M., Gillath, O., Pruessner, J. C., & Eggert, L. D. (2010). Adult attachment insecurity and hippocampal cell density. Social Cognitive and Affective Neuroscience, 5(1), 39–47. https://doi.org/10.1093/scan/nsp042
- Roisman, G. I. (2009). Adult attachment: Toward a rapprochement of methodological cultures. Current Directions in Psychological Science, 18(2), 122–126. https://doi.org/10.1111/j.1467-8721.2009.01621.x
- Rosnow, R. L., Rosenthal, R., & Rubin, D. B. (2000). Contrasts and correlations in effect-size estimation. Psychological Science, 11(6), 446–453. https://doi.org/10.1111/1467-9280.00287
- . https://doi.org/10.1016/j.neuropsychologia.2017.02.010
- Shore, B. (1996).
- Stein, J. L., Medland, S. E., Vasquez, A. A., Hibar, D. P., Senstad, R. E., Winkler, A. M., Toro, R., Appel, K., Bartecek, R., Bergmann, Ø., Bernard, M., Brown, A. A., Cannon, D. M., Chakravarty, M. M., Christoforou, A., Domin, M., Grimm, O., Hollinshead, M., & Holmes, A. J., & for the Enhancing Neuro Imaging Genetics through Meta-Analysis (ENIGMA) Consortium. (2012). Identification of common variants associated with human hippocampal and intracranial volumes. Nature Genetics, 44(5), 552–561.
- Takiguchi, S., Fujisawa, T. X., Mizushima, S., Saito, D. N., Okamoto, Y., Shimada, K., Koizumi, M., Kumazaki, H., Jung, M., Kosaka, H., Hiratani, M., Ohshima, Y., Teicher, M. H., & Tomoda, A. (2015). Ventral striatum dysfunction in children and adolescents with reactive attachment disorder: Functional MRI study. BJPsych Open, 1(2), 121–128. https://doi.org/10.1192/bjpo.bp.115.001586
- Tamnes, C. K., Herting, M. M., Goddings, A.-L., Meuwese, R., Blakemore, S.-J., Dahl, R. E., Güroğlu, B., Raznahan, A., Sowell, E. R., Crone, E. A., & Mills, K. L. (2017a). Development of the cerebral cortex across adolescence: A multisample study of inter-related longitudinal changes in cortical volume, surface area, and thickness. The Journal of Neuroscience, 37(12), 3402–3412. https://doi.org/10.1523/JNEUROSCI.3302-16.2017
- . https://doi.org/10.1523/JNEUROSCI.3302-16.2017
- Teicher, M. H., & Samson, J. A. (2016). Annual research review: Enduring neurobiological effects of childhood abuse and neglect. Journal of Child Psychology and Psychiatry, 57(3), 241–266. https://doi.org/10.1111/jcpp.12507
- Vrtička, P., Andersson, F., Grandjean, D., Sander, D., & Vuilleumier, P. (2008). Individual attachment style modulates human amygdala and striatum activation during social appraisal. PLoS ONE, 3(8), e2868. https://doi.org/10.1371/journal.pone.0002868
- Vrtička, P., Sander, D., Anderson, B., Badoud, D., Eliez, S., & Debbané, M. (2014). Social feedback processing from early to late adolescence: Influence of sex, age, and attachment style. Brain and Behavior, 4(5), 703–720. https://doi.org/10.1002/brb3.251
- Wechsler, D. (1997). Manual of the Wechsler adult intelligence scale—Fourth edition (WAIS–IV). Psychological Corporation.
- Wechsler, W. D. (2003). Intelligence Scale for Children WISC-IV technical and interpretive manual. Psychological Corporation.
- Whittle, S., Simmons, J. G., Dennison, M., Vijayakumar, N., Schwartz, O., Yap, M. B. H., Sheeber, L., & Allen, N. B. (2014). Positive parenting predicts the development of adolescent brain structure: A longitudinal study. Developmental Cognitive Neuroscience, 8, 7–17. https://doi.org/10.1016/j.dcn.2013.10.006
- Whittle, S., Vijayakumar, N., Dennison, M., Schwartz, O., Simmons, J. G., Sheeber, L., & Allen, N. B. (2016). Observed measures of negative parenting predict brain development during adolescence. PLOS ONE, 11(1), e0147774. https://doi.org/10.1371/journal.pone.0147774
- Worsley, K., Taylor, J., Carbonell, F., Chung, M., Duerden, E., Bernhardt, B., Lyttelton, O., Boucher, M., & Evans, A. (2009). SurfStat: A Matlab toolbox for the statistical analysis of univariate and multivariate surface and volumetric data using linear mixed effects models and random field theory. NeuroImage, 47, S102. https://doi.org/10.1016/S1053-8119(09)70882-1
- Yaseen, Z. S., Zhang, X., Muran, J. C., Winston, A., & Galynker, I. I. (2016). Comparison of brain activity correlating with self-report versus narrative attachment measures during conscious appraisal of an attachment figure. Frontiers in Human Neuroscience, 10. https://doi.org/10.3389/fnhum.2016.00090
- Zhang, X., Deng, M., Ran, G., Tang, Q., Xu, W., Ma, Y., & Chen, X. (2018). Brain correlates of adult attachment style: A voxel-based morphometry study. Brain Research, 1699, 34–43. https://doi.org/10.1016/j.brainres.2018.06.035