Abstract
Falling real incomes, rising utility prices and the historically poor thermal quality of the housing stock are some of the main factors that have driven the rise of systemic injustices surrounding energy poverty in the post-communist states of Eastern and Central Europe (ECE). We undertake a socio-spatial and temporal assessment of energy poverty in Hungary, the Czech Republic and Poland, using Household Budget Survey micro-data and the consolidated national results of the EU Survey of Income and Living Conditions. Our results indicate that increases in domestic energy prices and expenditures during the last decade have not been offset by purchasing power gains or energy efficiency improvements, resulting in sustained and growing levels of energy poverty. Capital city regions have fared better than rural areas even if traditional macroeconomic performance indicators do not easily match domestic energy deprivation metrics. We thus question policy approaches that favour income-based solutions and fail to recognise housing- and demography-related vulnerabilities.
Introduction
It is well known that processes of post-communist economic and political transformation have led to increased levels of social inequality, injustice and poverty throughout the states of Eastern and Central Europe (ECE) and the Former Soviet Union (FSU). The introduction of market-based reforms in the early 1990s was associated with economic shocks leading to industrial closures and contractions. This, in turn, augmented levels of unemployment and precarity while driving down wages. Universal social assistance schemes and price subsidies were abolished in favour of more targeted programmes throughout the region. While such trends have slowed down in ECE during the last 15 years – partly as a result of the benefits brought about by EU accession and economic growth – rates of poverty and material deprivation in many countries within the region remain stubbornly high. What is more, the last 25 years have also seen rising rates of inter- and intra-regional inequality, with capital cities and locations of new industrial activity faring better than agricultural hinterlands or resource peripheries. There have also been increasing levels of social polarisation and segregation within the social and built fabric of cities and neighbourhoods, as a result of processes of gentrification and suburbanisation.
The spatial embeddedness of post-communist inequalities is particularly visible in the case of energy poverty – a condition commonly understood as the inability of households to access socially- and materially-necessitated levels of domestic energy services, such as space heating and cooling, lighting, cooking and information technology (Bouzarovski & Petrova, Citation2015). Falling household incomes and rising energy prices are some of the key causes of energy poverty, as they decrease the affordability of fuels purchased by households. But earnings and tariffs are only one part of the equation, as energy poverty is disproportionately present in homes that are poorly thermally insulated or equipped with inefficient appliances and heating systems. All of these circumstances are common in post-communist countries, which inherited an inefficient housing stock from the centrally planned economy while being forced to increase energy tariffs against the background of rising deprivation levels. ECE states in particular have been recognised as one of the ‘hotspots’ of energy poverty in the EU, with countries such as Bulgaria, Romania, Poland and Lithuania being characterised by record numbers of people reporting that they cannot keep their homes adequately warm.
The distinct body of ECE-based research on this topic has offered insights into the political and institutional underpinnings of inadequate energy services in the home (Chelcea & Pulay, Citation2015; Gerbery & Filčák, Citation2014), their impacts on everyday life and well-being (Kovačević, Citation2004; Petrova, Gentile, Makinen, & Bouzarovski, Citation2013), as well as the strategies employed by households to address and contest domestic energy deprivation (Hegedüs, Citation2011; Lampietti & Meyer, Citation2002). At the same time, EU- and ECE-level studies have explored the general socio-demographic extent of the condition within the context of broader regional trends (Bouzarovski, Citation2014; Bouzarovski & Tirado Herrero, Citation2015; Healy, Citation2004; Thomson & Snell, Citation2012). But there is little knowledge of the manner in which energy poverty both affects and is reflected in household consumption practices, as well as existing forms of social inequality at the national scale. With the exception of Fankhauser and Tepic (Citation2007), comparative studies that would take into account the specific circumstances of ECE states are few and far between. Also, it remains unclear how the spatial patterns of energy poverty map onto regional inequalities within post-communist countries, in light of the dual economic and infrastructural embeddedness of the condition.
In light of such knowledge gaps, this article aims to determine the principal socio-demographic and geographic features of energy poverty in three ECE states, via a comparative analysis of micro-data from official national-scale Household Budget Surveys (HBS) undertaken in Poland, the Czech Republic and Hungary, as well as the EU’s Survey on Income and Living Conditions (SILC). These three countries contain 56% of the total population of the post-socialist ECE Member States of the EU (12% of the EU population) and despite their common recent history exhibit significant differences in composition of their primary energy supply and the regulatory environment in which domestic energy provision systems operate (Bouzarovski, Citation2009; Ürge-Vorsatz, Miladinova, & Paizs, Citation2006). The article has three more specific aims within its overarching goal: first, we explore how the extent of energy poverty has changed over time, as evidenced by some of the common measures used to describe the condition. Second, the article examines the structure of energy poverty across various social, demographic and spatial cleavages. The third aim of the article entails an exploration of the regional differences that characterise domestic energy deprivation. Underpinning all three aims is a broader argument that the inequalities generated by the post-communist transformation have a strong geographical component, as they involve spatial and material formations in addition to income deprivation. We also contend that the multidimensional nature of energy poverty makes it difficult to capture the phenomenon via a single indicator, thus suggesting that existing measures can only depict individual facets and experiences associated with the predicament.
The analyses undertaken in the article are based on a review of income and energy inequality trends in ECE, presented in the next section. This part of the article allows existing conceptualisations of energy poverty to provide a framework for approaching post-communist transformation-induced domestic energy deprivation via a customised set of analytical tools. The article then moves on to a description of the data and methods used in the study, as well as a discussion of the principal trends in energy poverty indicators that can be observed in the case study countries. These two sections are followed by an exploration of the manner in which domestic energy deprivation shapes: (i) antecedent and new social vulnerabilities; and (ii) intra- and inter-regional inequalities within the three study countries. The conclusion highlights the broader theoretical and policy implications of interpreting the rise of energy poverty within the wider systemic context of socio-economic deprivation and spatial differentiation in post-communism.
The rise of inequality, unemployment and energy poverty in post-communist countries
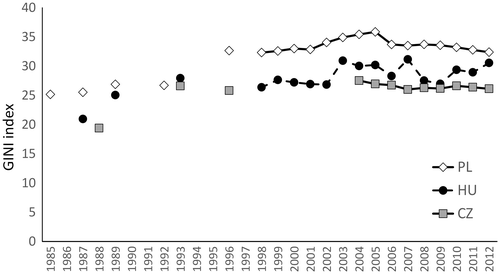
The expansion of poverty during the post-communist transition is well documented in the relevant literature. The early 1990s, in particular, saw rapid increases in inequalities of income and rates of material deprivation throughout the region, thus reversing the relatively egalitarian distribution of wealth that existed during the centrally planned economy. ECE states have generally fared better in this regard than their FSU neighbours to the East, following a rapid increase in income inequality indicators (such as the Gini coefficient) during the early 1990s (Figure ). Even though income disparity increases started to decelerate in the 2000s (Večerník, Citation2012), this trend has not been uniformly pronounced throughout the region (Nowotny, Citation2015). As a result, there is now a significant level of variation both within and among countries: while Poland, Hungary and some of the Baltic states have emerged at the top of the inequality league, recording Gini coefficient levels well above the EU average, other societies are much more egalitarian, with Slovenia and the Czech Republic characterised by Scandinavian degrees of income distribution. Current discrepancies, however, should be seen within the context of economic imbalances arising during and before the post-communist transformation: even though Poland and Hungary currently have similar levels of inequality, the Gini coefficient of the former has been relatively stable during the last decade, while income inequality in the latter has increased at relatively rapid pace since the early 2000s (Figure ).
Figure 1. Evolution of the Gini index in Hungary, the Czech Republic and Poland. Source: World Bank.
Unemployment is often singled out as one of the key drivers of income inequality in post-communism: the swift introduction in the early 1990s of neoliberal policies – in economies that had been operating under the principles of communist central planning for decades – resulted in a significant downsizing of the labour force, with millions of workers being either laid off, or moved onto lower paid and less stable jobs. Unemployment levels thus increased rapidly during the 1990s and stayed high in subsequent years, especially in economically disadvantaged regions (Bornhorst & Commander, Citation2006). While self-employment, private entrepreneurship, retirement, employment opportunities in new economic sectors and out-migration to Western European states have all helped drive down joblessness, a relatively stable core of long-term unemployed people is still present throughout ECE. Post-1990 economic reforms – particularly following the 1998 Russian crisis and the post-2008 financial crisis (Paci, Sasin, & Verbeek, Citation2004) – have triggered additional rounds of workforce restructuring in order to curtail falling profitability, while shrinking wages and increasing wage arrears. The problem of the ‘working poor’, therefore, has become a typical feature of former Eastern bloc economies (Stenning, Smith, Rochovská, & Świątek, Citation2010).
Income inequalities in the region have also increased as a result of consumer price inflation, particularly in the early 1990s when price growth was rapid and universal (Milanović, Citation1998). Another important factor has been the removal of social assistance and subsidy schemes, which explains why many governments in the region were reluctant to dismantle the generous social benefit systems inherited from the centrally planned economy – as evidenced by the child poverty effects associated with the reforms of family benefits in the Czech Republic, Hungary and Poland during the mid-1990s (Forster & Toth, Citation2001). Indeed, it has been shown that government tax and transfer policies have reduced rises in the inequality of income throughout the ‘EU-8’Footnote1 group of post-communist countries in ECE (Zaidi, Citation2009). Even though the share of taxes in disposable income has been relatively low in this region, fiscal systems have, in general, exerted a progressive effect even in states with a flat tax rate. At the same time, benefits have constituted a significant part of disposable income for households in all EU-8 countries, playing an even more pronounced progressive role than taxes although ‘households in the top income decile receive a non-negligible share of incomes in the form of benefits, which in turn helps explain why these programs enjoy such widespread public support in all countries’ (Zaidi, Citation2009, p. 12). Poland is an outlier in this regard, as its tax shares have been traditionally higher than the rest of the region, with benefits playing a less important role in the incomes of the poorest parts of the population.
In addition to labour force participation, there is evidence to suggest that educational attainment is a key driver of income inequality in the EU-8. But the benefits of higher levels of schooling have been more pronounced in the Czech Republic than in Poland, due to the more polarised educational structure present in the latter. Households of a larger size, a lower number of active earners and a higher number of dependent children have generally been shown to be more prone to income poverty, even though ‘the dependence of household income on the number of active earners decreased considerably in the first phase of the transition in the Czech Republic and Poland, somewhat less in Hungary until 2004’ (Večerník, Citation2012, p. 36). Gender also determines income inequality in the EU-8 and ECE more broadly, as a result of in-work salary differentials (Mysíková, Citation2012), inadequate provisions for parental leave (Fodor & Kispeter, Citation2014) as well as insufficient access to the labour market more broadly (Noelke, Gebel, & Kogan, Citation2012). It has been established that the gender wage gap is higher in the Czech Republic than in Poland and Hungary (Mysíková, Citation2012), with the latter two countries managing to reduce gender-related differences in pay at a higher pace during the post-communist transformation. In addition, inequality is pronounced along ethnic lines in a number of ECE states: the structural discrimination faced by the Roma minority in countries like Hungary and the Czech Republic is well documented in the literature, especially in situations where this group’s economic disadvantage is coupled with instances of spatial marginalisation and ghettoisation (Bouzarovski, Tirado Herrero, Petrova, & Ürge-Vorsatz, Citation2015; Schwarcz, Citation2012). At the same time, standards of living vary significantly among regions, although it has been argued that such differences may stem from demographic and educational attributes at the household scale, rather than place-specific infrastructural features or amenities (Zaidi, Citation2009).
Countries with higher levels of income inequality are generally characterised by increased degrees of material deprivation, which involves a wider range of dimensions that define participation in society – from the inability to access basic goods and services (including energy), to the absence of key transport, technological and housing amenities (Whelan & Maître, Citation2012). An individual’s health status, the quality of his or her neighbourhood environment, as well as the ability to access public facilities, are also commonly included within such measures. ECE states have recorded significantly higher rates of material deprivation compared to the EU average, especially when it comes to the enforced lack of basic requirements and necessities (Matković, Šućur, & Zrinščak, Citation2007). Here, once again, it is possible to observe significant differences at the international scale, with Bulgaria and Romania located at the lower end of the distribution, and the Czech Republic and Slovenia faring better than most. These cleavages can be attributed to the role of past socio-economic legacies, some of which predate the Second World War. Nevertheless, the patterning of income inequalities in ECE is more diverse than indicators of material deprivation, where post-communist states form a more coherent group within the EU (Aidukaite, Citation2011).
Post-communist energy poverty can be considered a form of material deprivation, as it involves difficulties in securing a needed level of socio-technical amenities within the home (Buzar, Citation2007). As such, it is closely linked to the legacies of infrastructure development and provision stemming from the centrally planned economy. ECE countries inherited a regulatory environment characterised by the dominance of state structures in the planning and operation of energy sector activities. The horizontal and vertical integration of electricity and gas utilities was accompanied by the construction of technological networks that locked ECE economies in a persistent state of hydrocarbon dependence on the former Soviet Union. The post-communist landscape of energy provision and demand was also underpinned by the widespread presence of fossil-fuel powered district heating networks in urban areas (Bouzarovski, Sýkora, & Matoušek, Citation2016), as well as the predominance of coal in the energy consumption mix. There was a focus on the expansion of supply infrastructures – high levels of electrification and gasification were typical – even if the quality of final services was poor and intermittent. At the same time energy prices for households were kept low via a system of indirect subsidies on electricity and gas bills in particular. Metering devices were almost absent, particularly in the case of district heating. The emphasis on heavy industry combined with low energy tariffs to generate unusually high energy intensities in the economy, and a culture in which energy was seen as a freely available good rather than a service associated with a unit price (Bouzarovski, Citation2009, 2010).
The post-communist transformation brought about an abrupt end to such practices. The adoption of neoliberal principles of economic and social organisation was associated with deep implications on the management of the energy sector, where services such as electricity and gas became quickly commodified and subjected to market relations. Centralised utility companies established during communism were legally and functionally unbundled into separate entities responsible for the generation, transmission, distribution and commercial supply of energy. This was accompanied by efforts to open energy markets so as to allow for competition and free trade. The liberalisation of the energy sector also led to the removal of universal price subsidies and social protection mechanisms for household consumers. While such reforms have not been pursued universally throughout the post-communist space – with some countries being more reluctant than others to adopt neoliberal policies and regulation – they have exerted significant impacts on patterns of energy demand. Electricity, gas and district heating price increases, in particular, have combined with the broader expansion of income poverty to push growing numbers of households into energy poverty. This situation has been further exacerbated by the systematic lack of programmes to support the energy efficiency of the housing stock – a concern that was almost completely neglected during communism. Overall, therefore, energy poverty in ECE is a relatively recent phenomenon, resulting from a complex interplay between patterns of material deprivation, on the one hand, and the broader governance of energy and housing infrastructures, on the other.
Data and methods
As pointed out in the introduction, the methodological basis of this article consists of analyses of quantitative data sourced from two types of official surveys: the HBS micro-data generated by national statistical offices, and a set of published indicators provided by the EU’s SILC. In the EU, Household Budget Surveys are undertaken at the national level on an annual basis, mainly for the purpose of estimating the weights of different goods and services in consumer price indices, in addition to National Accounts calculations and obtaining an up-to-date picture of micro-scale socio-economic trends and living conditions (European Communities, Citation2004). They focus on the demographic and social characteristics of the population, levels of monthly incomes and expenditures, the possession of selected durable goods, as well as the consumption of food products. The surveys contain a number of questions relevant to energy poverty and material deprivation, albeit these do not always have the same wording and are not universally present via harmonised methodologies. The Polish HBS involves a sample of approximately 37,000 households, selected via a random probability method: the country has a geographically stratified two-stage sample, with a different selection probability at the first stage (Central Statistical Office, Citation2014). The Czech Republic uses purposive quota sampling, comprising 3000 households in the basic sample, in addition to a ‘supplementary sample’ of 400 low-income households. Stratified two-stage probability sampling is used in Hungary, with a total sample size of 10,000 households. As for SILC, it is an instrument co-ordinated by Eurostat, involving the collection of comparable multidimensional micro-data on issues such as social exclusion, housing, labour, education and health across the EU.Footnote2 Despite a number of shortcomings surrounding the representativeness of data in particular (e.g. see Thomson & Snell, Citation2012), SILC is the only source of pan-European energy poverty-related statistics. For the purposes of this article, consolidated national SILC results retrieved from Eurostat’s online datasets and SILC micro-data included in the Household Budget Surveys of Poland (for the period 2010–2012) and Hungary (only for 2011) were used.
In line with the conceptual principles that underpin energy poverty approaches, we have used household energy expenditure as a proxy for estimating the extent of domestic energy deprivation within a given society (there are no direct data on the condition, as it is multidimensional and measuring it on a house-by-house basis is impractical). A key metric in this context is the ‘energy burden’, which captures the share of energy costs in a household’s total budget. A high energy burden means that households prioritise energy over other less essential expenses, and are therefore more likely to face hardship (Emmel, Lee, Cox, & Leech, Citation2010). We have also relied on a ‘low income high cost’ (LIHC) indicator, based on the principles outlined by the Hills fuel poverty review in the UK (Hills, Citation2012). The LIHC is calculated via a two step process that first establishes the number of households who face energy costs higher than the median, and then determines whether the residual income available to them would push such families below the relative poverty line set at 60% of the median equivalised annual income. In addition to such expenditure-based measures, we have also investigated self-reported figures sourced from HBS and SILC datasets. These include subjective measures such as the inability to afford keeping the home adequately warm in winter or comfortably cool in summer, as well as more ‘objective’ indicators about the presence of damp and mould in the house, or the inability to pay energy bills on time. While such ‘consensual’ measures offer a number of advantages due to their direct correspondence with the consequences of energy poverty, they should be interpreted with caution due to the culturally-specific and contextual nature of energy services (Healy, Citation2004; Petrova, Gentile, Mäkinen, & Bouzarovski, Citation2013).
The analyses that we undertook are based on equivalised income and expenditure figures. Income has been equivalised in line with OECD factors, and expenditure is equivalised following the British LIHC methodology applied to each country based on the median energy expenditure of households with different sizes.Footnote3 Both equivalisation scales use a one-person household as a reference frame, unlike the British LIHC method according to which energy expenditures are equivalised taking a two-person household as a reference. Several indicators are calculated on the basis of the median given that energy poverty patterns do not follow a normal distribution and therefore means (averages) are systematically above medians. Also, energy expenditure data recorded by the HBS exclusively refer to actual consumption, unlike the official British methodology that estimates the level of consumption required to maintain a certain level of domestic energy services. Under-consumption of energy services among low-income deciles has an unknown impact on the scores of indicators. It should be pointed out that the income component in the LIHC calculation has been applied without deducting housing costs, given that an after-housing-costs statistic cannot be easily computed for all countries and years. This most likely reduces energy poverty scores for urban households, where housing is often more expensive than in rural areas. It also overestimates energy poverty levels for households that do not have to pay a mortgage or a rent for the dwelling where they live – a potentially significant figure in the case of owner-occupiers, particularly pensioners who bought their home privately after 1989.
Energy poverty trends in transition
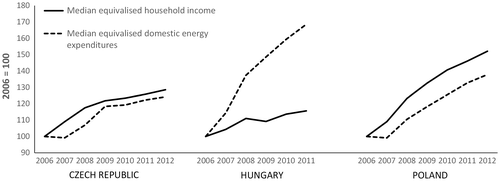
It is widely acknowledged that energy price increases during the past 25 years have been one of the key drivers of energy poverty in ECE. The geographically uneven implications of price increases on domestic energy expenditures are evidenced in median equivalised annual energy expenditure figures. While in 2006 these amounted to 426, 695 and 512 euros in Poland, the Czech Republic and Hungary, respectively, they reached 565, 850 and 864 euros for the corresponding three countries in 2011. This represents a rise of 33% for Poland, 22% for the Czech Republic and 69% for Hungary. It also means that Polish median energy expenditure numbers are currently significantly lower than the ones recorded in both the Czech Republic and Hungary, the latter of which also increased at a much faster rate during the reference period. At the same time, median annual equivalised incomes were 3446, 6078 and 4292 euros for Poland, the Czech Republic and Hungary, respectively, in 2006, and 5033, 7645 and 4964 euros in 2011. In relative terms, this translates into income increases of 46, 26 and 16% for Poland, the Czech Republic and Hungary.
While maintaining the highest relative position within the group of study countries, Czech median incomes have increased at a rate that has both outpaced the rise in energy expenditures and dwarfed income growth in Poland and Hungary. This is despite the fact that Polish median incomes have also risen above median energy expenditure levels in that country. Trends in Hungary are possibly the most alarming in energy poverty terms – the rift between incomes and energy expenditure becomes even more apparent when considering the nominal changes in these indicators on a per-country basis, taking 2006 as a base year (Figure ). Even though such statistics also incorporate general inflation trends (and therefore caution is advised when comparing trends across the three countries), nominal values are thought to provide a more accurate representation of the temporal evolution in both income and energy expenditure levels. They amalgamate broader trends in the economy, and may be a function of the higher share of coal in the Polish energy mix, the ability of Czech and Polish consumers to benefit from markets with higher rates of liberalisation and market competitions, as well as their lower rates of income inequality and higher levels of income growth compared to Hungary (Večerník, Citation2012).
Figure 2. Evolution of median household income and domestic energy expenditures in Hungary, the Czech Republic and Poland (2006=100). Source: Authors’ own analysis of HBS data.
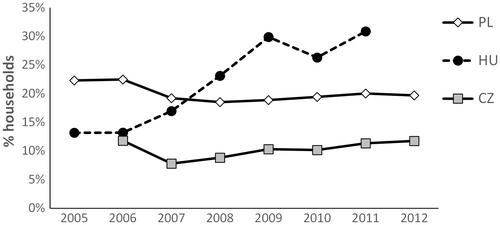
The observed numbers are consistent with trends in the ‘energy burden’, which amounted to 10.8% in Poland and 11% in the Czech Republic in 2011. Such values are relatively similar to the 11.6 and 11.2% recorded in, respectively, Poland and the Czech Republic in 2006. Energy burdens dropped to nearly 10% in both countries in 2007 and 2008 – possibly due to weather-related factors – and have been gradually increasing since. The slight drop in the Czech energy burden stands in stark contrast to the Hungarian situation, where energy burdens have been increasing rapidly: from 11.6% in 2005 to 16.9% in 2011. While the figures for Hungary point to the pervasive presence of energy poverty across the country, both Poland and the Czech Republic nevertheless face difficult circumstances in this regard – the literature on the subject considers energy burdens near 10% as a sign of hardship (Boardman, Citation1991; Fankhauser & Tepic, Citation2007). At the same time, significant numbers of households in all three countries are characterised by energy burdens above 20% (which roughly corresponds to twice the median ‘energy burden’ in the mid-2000s, otherwise a threshold at which deprivation has been hypothesised to exist – see Boardman, Citation1991). This is where the comparatively greater size of the problem in Poland becomes more visible, as does the significant recent increase of the population affected by domestic energy deprivation in Hungary (Figure ). In more general terms, it becomes apparent that post-communist energy sector reforms undertaken in all three countries – as well as the ability of nations like Poland to maintain GDP growth after the post-2008 financial crisis – have not translated into decreased energy costs or burdens for the general population and vulnerable groups alike.
Figure 3. Percentages of households with an energy burden above 20%. Source: Authors’ own analysis of HBS data.
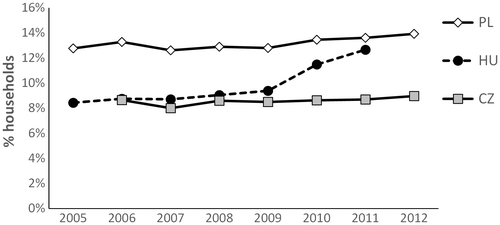
A very different picture can be seen in the case of the LIHC indicator, where Poland reports a significantly greater proportion of households with low incomes and high energy costs (Figure ). But the very moderate increases of LIHC scores for both this country and the Czech Republic in the 2006–2011 period are dwarfed by the rise experienced by Hungary. A more detailed analysis of both components of the LIHC indicator (i.e. households with low incomes and households with high costs) may be necessary to understand the evolution of this indicator. Experience from the UK has shown that the LIHC measure often omits significant numbers of energy-poor households of a smaller size – particularly pensioners (Moore, Citation2012; Walker, Liddell, McKenzie, Morris, & Lagdon, Citation2014). These groups typically face high energy burdens and may account for a larger proportion of the domestic energy deprivation demographic in Hungary and the Czech Republic. The LIHC statistic is also believed to provide a more effective method of capturing the structural depth of energy poverty than less sophisticated expenditure-based statistics (Hills, Citation2012). Transferring this general principle to the values observed in the Czech Republic, Poland and especially Hungary suggests that the inability to afford adequate energy services has become more pervasive since 2006. It should be noted that our calculations are based on actual energy costs, which are likely to underestimate the size of the problem due to the poor inclusion of low-income households. Even with such a calculation, the recorded values for two of the case study countries (Poland and Hungary) are currently well above those of the UK, where a required-fuel-costs LIHC statistic estimated that 10.9% of all households were energy poor in 2011 (Department of Energy & Climate Change, Citation2013).
Figure 4. Percentages of households in the LIHC category. Source: Authors’ own analysis of HBS data.
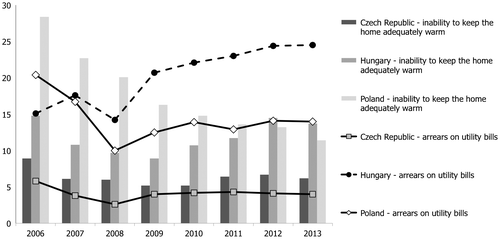
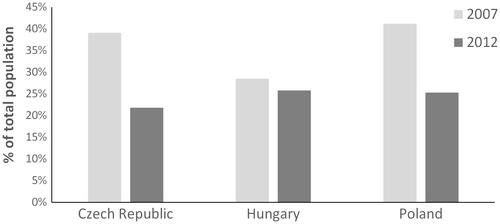
The SILC survey offers a third set of indicators relevant to this discussion, even if its topics and methods of data collection are very different from expenditure- and income-based metrics. SILC data reveal that the reported financial inability to keep the home warm has decreased or at least remained stable in all three countries, with Poland reporting a particularly dramatic drop (Figure ). But Hungary has seen a significant rise in the numbers of people who could not pay their utility bills on time – a statistic much more in line with trends seen in the energy burden and LIHC indicators. SILC data also emphasise the hardship experienced in relation to energy services other than heating: a specialised module on housing conditions undertaken in 2007 and 2012 showed that significant number of people across all three countries lived in uncomfortably cool dwellings in summer (Figure ). While such numbers decreased in Poland and the Czech Republic during the relatively fresher summer of 2012, they nevertheless encompassed between a fifth and a quarter of the total population in all three study countries. This trend provides further evidence to support the claim that energy poverty is a multidimensional problem whose adequate description requires a wide array of indicators.
Energy-related social, demographic and housing vulnerabilities
Efforts to alleviate energy poverty have often involved support targeted at specific demographic groups that are deemed vulnerable by virtue of their social, family or household arrangements. Previous research on the subject has singled out pensioners, households with children and households headed by or containing unemployed adults as some of the primary groups of people who may be susceptible to energy-related hardship in the home (Buzar, Citation2007; Freund & Wallich, Citation1996). But our analyses of HBS data for the three study countries reveal a less clear picture (see Table ). As a whole, households with children do not necessarily exhibit above-average levels of vulnerability to higher energy prices and burdens, or a self-reported lack of adequate heating or cooling services, perhaps because having children in ECE is in itself an indication of an increased level of material well-being (Balcerzak-Paradowska, Citation2005). This is less true of pensioners, whose household shares are above the nationwide means in all but one instance for the four energy poverty indicators considered in our analyses. The proportion of Czech pensioners with low incomes and high energy costs is particularly striking, as is the Hungarian share of people within this group who face high energy burdens. A yet more contrasting picture emerges in the case of households who rely on benefits for all or most of their income, as well as households headed by poorly-educated individuals. In the case of benefit recipients, vulnerabilities are particularly pronounced in the Polish LIHC and energy burden statistics, while the association between energy poverty and low educational attainment can be strongly discerned in the Czech and Hungarian high energy burden group, the Czech LIHC cohort, as well as Hungarian households who reported that their dwelling is insufficiently warm in winter.
Table 1. Socio-demographic indicators of vulnerability to energy poverty. In the table, ‘category’ refers to the share of households who are considered vulnerable to the given indicator within the specific socio-demographic category; ‘total’ refers to the cumulative share of households in the sample (i.e. as a proportion of all households) who are considered vulnerable to the given indicator. Above-average values of the ‘category’ shares are italicised.
Other than space cooling, low incomes seem to be a defining vulnerability factor for all three indicators, as evidenced by the disproportionately high shares of households with high energy costs and poor thermal comfort conditions. The same applies to the group of respondents in Hungary and Poland who perceived themselves to be in difficult financial circumstances. Notably, households who reported that their dwellings were insufficiently warm in winter or cool in summer are significantly more likely to describe themselves as having a very poor financial status. All of this suggests that energy poverty in the Czech Republic is concentrated within a relatively tight stratum of people, as both the LIHC and energy burden indicators in this country have a strong income dimension. This is in contrast to Hungary, where significant numbers of households across a wide range of demographic and income categories seem to be struggling not only with high energy costs but poor domestic energy services as well. The Polish HBS paints a similar picture, albeit the relationship between subjective energy poverty indicators and low incomes appears to be stronger in its case.
The fact that the nature and levels of income may matter more than the demographic features of the household in the Polish case is also confirmed by HBS-based energy poverty indicators for specific groups (Table ). The shares of households with high energy burden and LIHC values are particularly high among groups who rely on informal sources for the bulk of their income, while the proportion of those who reported living in an insufficiently warm dwelling reaches nearly double the average for this category. The values of all four surveyed indicators also exceed the mean value for pensioners, while farmers also struggle with high energy costs. Conversely, Czech energy poverty seems to have a much stronger socio-demographic and gender component, as evidenced by the proportions of extended families (both without and with children) under the LIHC category, as well as the extent to which single people and households headed by women are overrepresented within the high-energy-burden and LIHC groups alike (Table ). It is important to note the significant share of large Czech households in the LIHC group, which confirms earlier indications that this metric favours families as opposed to pensioners. The strong socio-demographic concentration of Czech energy poverty is further accentuated by the fact that 26% of households with unemployed heads were identified as vulnerable by the LIHC score; this is triple the size of the 9% national mean. The analogous proportion in the case of high energy burdens was 31%, versus a mean of 20%.
Table 2. Energy poverty indicators for selected demographic groups in Poland (expressed as shares of households in the relevant category within all households). Above-average values are italicised.
Table 3. Energy poverty indicators for selected demographic groups in the Czech Republic (expressed as shares of households in the relevant category within all households). Above-average values are italicised.
HBS data also allow for energy-related vulnerabilities to be explored in relation to housing practices and infrastructure indicators (Table ). One third of Polish households who stated that their home was insufficiently warm in winter rely on solid or liquid fuels to heat their homes; this is nearly three times the mean share of all households in the relevant category. At the same time, solid or liquid fuels are associated with elevated ratios of households in the LIHC and high energy burden categories in all three study countries; this may be a function of the low-income status of such groups, although the overrepresentation of poor self-reported indoor warmth also suggests that technical and energy efficiency factors may be at play. A similar situation exists in the case of households who rely on electricity for heating; with the exception of the Polish LIHC statistic they constitute above-average shares of the total households deemed vulnerable under all four indicators. This is directly opposite to the shares of energy-poor households connected to the district heating network, who are less represented in all but one of the categories studied (‘dwelling insufficiently cool in summer’). The latter is likely related to the characteristics of pre-fabricated panel apartment blocks in suburban areas – the building typology most often supplied by district heating where high levels of summertime thermal discomfort are suspected (Tirado Herrero & Ürge-Vorsatz, Citation2012).
Table 4. Housing-related indicators of vulnerability to energy poverty. In the table, ‘category’ refers to the share of households who are considered vulnerable to the given indicator within the specific socio-demographic category; ‘total’ refers to the cumulative share of households in the sample (i.e. as a proportion of all households) who are considered vulnerable to the given indicator. Above-average values of the ‘category’ shares are italicised.
The significance of the technical characteristics of the built stock is also highlighted by the disproportionate presence of energy-poor households in older dwellings – particularly notable is the share of self-reported insufficient domestic warmth in Polish houses constructed before 1945.Footnote4 While living in rental housing itself does not seem to be associated with elevated rates of exposure to energy poverty factors – with the exception of insufficient space cooling and heating in Hungary – significant numbers of households in Poland and Hungary who live in free or low rent accommodation reported domestic thermal discomfort; to a lesser extent, the same applies to the LIHC indicator in Poland and the Czech Republic. There is also evidence to suggest that the inhabitants of detached individual homes face elevated levels of vulnerability to domestic energy deprivation; 12% of Czech and 18% of all Polish households in this category were classified as LIHC in 2011, while 18% and 26%, respectively, had energy burdens above 20% in the same year.Footnote5 This may be attributed to the relative absence of state or private sector support for energy efficiency improvements in this part of the dwelling stock; in the Czech Republic, Hungary and Poland alike, government-led housing improvement programmes have principally been targeted towards the retrofit of apartment buildings (Bouzarovski, Citation2015). Demographic and income factors may also be at play; single family housing in all three countries is predominantly concentrated in rural and low-income areas despite dynamics of suburbanisation during the last 25 years (Petrova, Posova, House, & Sýkora, Citation2013).
The spatial distribution of energy poverty
Micro-scale social and residential typologies of energy poverty aggregate across broader spaces and scales to produce specific geographical patterns of vulnerability. Thus, HBS data for Hungary show that households with high energy burdens and LIHC values are disproportionately concentrated in suburban areas, villages and areas with ‘poor housing’ as defined by the national statistical office (Table ). This confirms previous indications about the prevalence of domestic energy deprivation in rural areas. With the exception of the ‘poor housing’ category, self-reported inadequate domestic heating and cooling rates diverge from such metrics, as evidenced by the above-average concentration of households experiencing such conditions in urban and industrial areas, as well as suburbs in the case of heating and apartment blocks in the case of cooling. Overall, this points to the influence of housing stock characteristics in influencing the quality of the final energy services received by households. The spatial distributions of above 20%-energy-burden and LIHC household shares in Poland and the Czech Republic exhibit similar spatial patterns, with areas of low and medium population density hosting above-average numbers of families experiencing such difficulties (Table ). Inadequately cool and warm homes in these two countries, however, are generally more present in high density regions, possibly pointing to the urban character of such circumstances.
Table 5. Energy poverty indicators for selected housing typologies in Hungary (expressed as shares of households in the relevant category within all households). Above-average values are italicised.
Table 6. Energy poverty indicators for selected housing typologies in Hungary (expressed as shares of households in the relevant category within all households). Above-average values of the ‘category’ shares are italicised.
Energy deprivation indicators also point to different forms of geographical variation within the three study countries. Capital city regions in the Czech Republic, Hungary and Poland alike are notable for the low concentrations of households with high LIHC scores or energy burdens (Figure ). The share of households experiencing energy burdens above 20% follows a clear east–west gradient in Hungary – with the predominantly agricultural and economically under-developed eastern parts of the country registering record percentage levels of this indicator. A more concentric pattern (focusing on Prague) seems to be present in the Czech Republic, with the thinly populated resource periphery of the Zlín region ranking the highest according to this statistic. The north eastern and south eastern parts of Poland are more vulnerable than the rest of the country, especially the rural Podkarpackie region at the border with Ukraine and Slovakia. The relatively privileged position of capital cities can also be seen in the regional patterns of LIHC household shares (Figure ), even if a more differentiated picture emerges at the national scale: the highest values can be found in south eastern Hungary (the northeast seems to be faring relatively better) as well as a number of regions in central, north eastern and north western Poland. This is despite the fact that the far southeast still has the highest percentages of households with LIHC. The Zlín region is still the most vulnerable in the Czech Republic in LIHC terms, albeit this statistic also identifies two neighbouring Northern Moravia regions as well as the far northwest Karlovy Vary region as susceptible to the condition.
Figure 7. Regional variation in the shares of households who experienced energy burdens above 20%. Source: Authors’ own analysis of 2012 Czech, 2012 Polish and 2011 Hungarian HBS data.
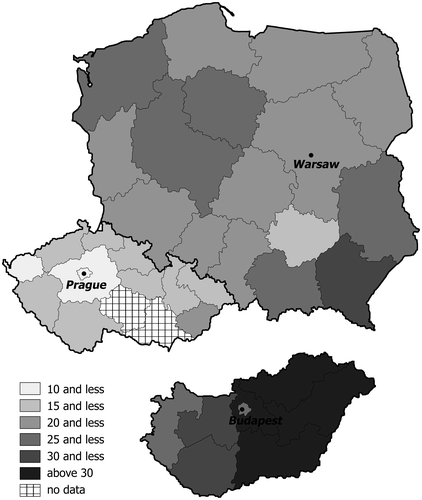
Figure 8. Regional variation in the shares of households who were energy poor according to the LIHC indicator. Source: Authors’ own analysis of 2012 Czech, 2012 Polish and 2011 Hungarian HBS data.
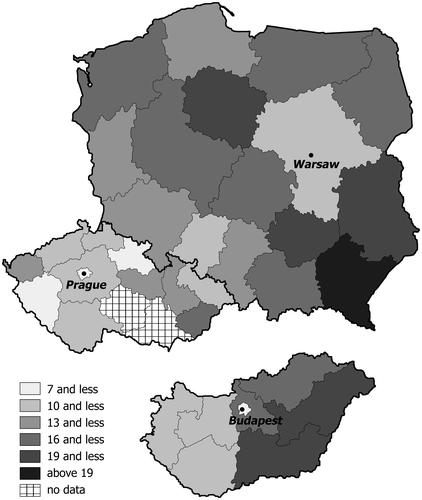
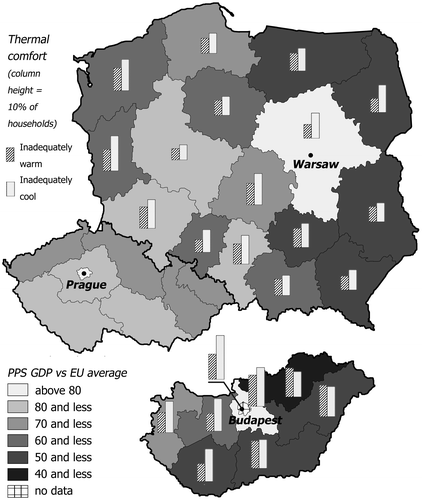
It is important to note the lack of a direct correspondence between above-average household percentages of the energy burdens and LIHC indicators, on the one hand, and per capita GDP values, on the other. Thus, the lowest levels of per capita economic output can be found in the Hungarian northeast, even if LIHC percentages are highest in the southeast (Figure ). The deprived northwest and northeast regions of the Czech Republic do not appear to concentrate above average numbers of energy-poor households. The discrepancy between more conventional patterns of economic inequality and domestic energy deprivation indicators is also apparent in Poland, where, for example, the relatively underdeveloped Opolskie and Lubuskie Voivodeships close to, respectively, the Czech and German borders rank relatively low on the energy burden and LIHC scores; the same applies to the entire northeast of the country, where GDP per capita levels are even lower. The picture becomes even more complex if self-reported levels of inadequate domestic heating or cooling are explored at the regional scale (Figure ). Polish regions hosting larger urban centres (e.g. Warsaw, Wroclaw Lodz and Szcecin) appear to be more vulnerable according to these measures. In Hungary, some of the highest values have been reported for the capital Budapest and its surroundings. Notably, three eastern Hungarian regions are characterised by higher or equal percentages of households who feel their home is poorly heated, when compared to being poorly cooled – a trend that diverges from the remainder of their host country, and all of Poland. When considered together with the values of expenditure-based indicators for the three regions in question, this trend may point to the severity of energy poverty in the eastern part of Hungary as a whole.
Figure 9. Regional variation in the shares of households who experienced inadequately warm or cool homes, mapped against PPP-adjusted GDP per capita figures. Thermal comfort data are not available for the Czech Republic. Source: Authors’ own analysis of 2012 Czech, 2012 Polish and 2011 Hungarian HBS data.
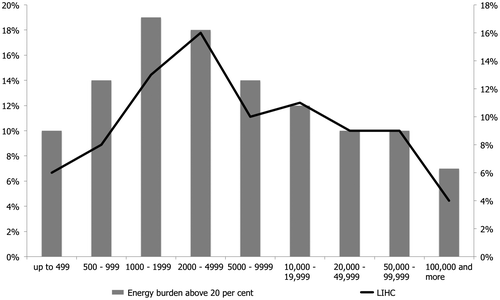
Czech data on the relationship between settlement size, on the one hand, and LIHC or high energy burden household shares, on the other, may help explain the broader geographical distribution of energy poverty indicators in this country (Figure ). The highest proportions of households with high energy burdens and costs can be found in small- to medium-sized towns. Such areas have been marginalised in housing refurbishment programmes while facing a range of issues surrounding the legal and technical restructuring of the housing stock (Bouzarovski et al., Citation2015). The prevalence of medium- and small-sized settlements in regions like Zlín or Karlovy Vary – as opposed to the economically more deprived but also more urbanised north western and north eastern parts of the country – may explain the configurations of regional inequality described above. At the same time, fuel prices and availability may have played a role in the geographical distribution of energy poverty indicators in Poland and Hungary; regions where biomass and coal are more abundant perform better on the LIHC and energy burden despite the low incomes of the population. This may be due to wider price effects as our analyses have also shown an increased incidence of the LIHC and high energy burden indicators in households who use solid fuels as the main source of warmth (Table ). As a whole, the reviewed evidence suggests that the demand-side fuel mix and the condition of the housing stock have combined with existing patterns of deprivation to produce new spatial distributions of energy poverty at the sub-national level.
Conclusion
This article has sought to examine how patterns of domestic energy deprivation vary across time and space in the post-communist states of ECE. In doing so, we have been primarily interested in uncovering the underlying relationship between wider forms of material deprivation, on the one hand, and the process of infrastructural reforms undertaken in ECE during the past 25 years, on the other. We have argued that this link has resulted in the emergence of new household vulnerabilities that extend beyond the confines of existing conceptual frameworks and measurement matrices, creating a systemic landscape of ‘energy in justice’ (Bickerstaff, Walker, & Bulkeley, Citation2013). The non-conformity of energy poverty with conventional statistical indicators has also influenced the investigations and outcomes associated with the article itself: our analyses have been highly inferential and indirect in character due to the lack of customised data, even if we have utilised sources of information that have rarely been employed towards the study of inadequate energy services in the home.
In response to the first aim of the article (about the changes in the prevalence of energy poverty during the post-communist transformation), the reviewed evidence points to a clear expansion of domestic energy deprivation in Hungary, and a stagnation in Poland and the Czech Republic since 2006. At the same time, the values of energy poverty-relevant indicators for all three countries are much higher than equivalent measures for Western European or North American countries – thus reflecting a pattern that is present in the ECE region as a whole. While some of the surveyed indicators for Poland point to a possible decrease of energy poverty in recent years, it is clear that the combination of post-1990s economic and income growth, energy sector reforms and housing refurbishment programmes has failed to deliver substantive benefits in terms of the ability of households to secure adequate levels of energy services in the home. What is more, there is evidence to suggest that energy poverty in Hungary is expanding at an alarming rate, while encompassing populations well beyond the low-income bracket. This is unlike the Czech Republic and Poland, where domestic energy deprivation seems to be predominantly concentrated among specific socio-demographic groups – farmers, pensioners, individuals living on their own and low-income households more generally. Thus, and in relation to the second aim of the article, it can be said that the ability to capture energy poverty via the lens of income-based indicators is less meaningful in contexts where difficulties in securing adequate levels of energy services in the home are common within the general population. As for the third aim of the article, our analyses have uncovered the presence of a distinct geographic distribution of domestic energy deprivation, whereby the socio-spatial underpinnings of the condition are aggregated with wider patterns of economic inequality and injustice. In all three countries, there is a tendency for domestic energy deprivation to be concentrated in rural and peripheral regions with poor-quality housing and decreased access to affordable fuels (reflecting a broader situation across the region; e.g. see Kovačević, Citation2004; Miazga & Owczarek, Citation2015; Petrova, Citation2016).
Overall, the outcomes of our study point to the need for a deeper understanding of the manner in which material deprivation both arises out of and affects the consumption of energy services within the home. This would necessitate a more nuanced theorisation of the institutional and spatial contexts that shape energy-related demographic and residential vulnerabilities. The manner in which restructuring processes in the energy and housing sectors have interacted at the regional and local scales deserves particular attention in this context. Also of importance is the nature of policy recognition afforded to groups who are susceptible to the condition but remain outside the focus of present policy measures, due to the state’s failure to detect the specific age, gender and locational profiles of energy-poor households. Since it has become apparent that energy poverty cannot be addressed via standard income- or economic development-based approaches, a more comprehensive conceptualisation of the condition can potentially lead to the development of improved detection and measurement frameworks throughout the post-communist space. The benefits of such an effort could extend beyond the ECE space to parts of Europe, Asia and even America where the relationship between rising energy prices and poverty levels may become a more pressing political and economic issue in the future.
Disclosure statement
No potential conflict of interest was reported by the authors.
Acknowledgments
The research leading to this paper has received funding from the European Research Council under the European Union’s Seventh Framework Programme (FP7/2007–2013)/ERC grant agreement number 313478. Stefan Bouzarovski is also an External Professor at the Institute of Geography at the University of Gdansk, Poland, and a Visiting Professor at the Department of Geography at the University of Bergen, Norway.
Notes
1. These states joined the EU in 2004: Estonia, Latvia, Lithuania, Poland, the Czech Republic, Slovakia, Hungary and Slovenia.
3. OECD income equivalisation factors are the same for the three countries. Country-specific expenditure equivalisation factors were calculated as an average of annual factors in the Czech Republic for 2006–2012, in Hungary for 2006–2011 and in Poland for two periods: 2005–2008 and 2009–2012.
4. Our analyses showed that buildings after 1960 are much less affected, but these statistics have been omitted due to space constraints.
5. These figures include only owner-occupied homes in the case of the Czech Republic.
References
- Aidukaite, J. (2011). Welfare reforms and socio-economic trends in the 10 new EU member states of central and Eastern Europe. Communist and Post-Communist Studies, 44, 211–219.
- Balcerzak-Paradowska, B. (2005). Poland’s population and demographic changes. In: S. Golinowska, K. Getka, & A. Kierzkowska-Tokarska (Eds.), The social report: Poland (pp. 55–76). Warsaw: Friedrich Ebert Foundation.
- Bickerstaff, K., Walker, G. P., & Bulkeley, H. (2013). Energy justice in a changing climate: Social equity and low-carbon energy. London: Zed Books.
- Boardman, B. (1991). Fuel poverty: From cold homes to Affordable Warmth. London: Bellhaven.
- Bornhorst, F., & Commander, S. (2006). Regional unemployment and its persistence in transition countries1. Economics of Transition, 14, 269–288.
- Bouzarovski, S. (2009). East-Central Europe’s changing energy landscapes: A place for geography. Area, 41, 452–463.
- Bouzarovski, S. (2010). Post-socialist energy reforms in critical perspective: Entangled boundaries, scales and trajectories of change. European Urban and Regional Studies, 17, 167–182.
- Bouzarovski, S. (2014). Energy poverty in the European Union: Landscapes of vulnerability. Wiley Interdisciplinary Reviews: Energy and Environment, 3, 276–289.
- Bouzarovski, S. (2015). Retrofitting the city: Residential flexibility, resilience and the built environment. London: IB Tauris.
- Bouzarovski, S., & Petrova, S. (2015). A global perspective on domestic energy deprivation: Overcoming the energy poverty–fuel poverty binary. Energy Research & Social Science, 10, 31–40.10.1016/j.erss.2015.06.007
- Bouzarovski, S., & Tirado Herrero, S. (2015). The energy divide: Integrating energy transitions, regional inequalities and poverty trends in the European Union. European Urban and Regional Studies. doi:10.1177/0969776415596449
- Bouzarovski, S., Tirado Herrero, S., Petrova, S., Frankowski, J., Matoušek, R., & Maltby, T. (2015). Multiple transformations: The emergence of post-communist energy vulnerability as a socio-spatial formation. Unpublished manuscript.
- Bouzarovski, S., Tirado Herrero, S., Petrova, S., & Ürge-Vorsatz, D. (2015). Unpacking the spaces and politics of energy poverty: Path-dependencies, deprivation and fuel switching in post-communist Hungary. Local Environment, http://www.tandfonline.com/doi/abs/10.1080/13549839.2015.1075480
- Bouzarovski, S., Sýkora, L., & Matoušek, R. (2016). Locked in Post-Socialism: Rolling path-dependencies in Liberec’s district heating system. Eurasian Geography and Economics. doi:10.1080/15387216.2016.1250224
- Buzar, S. (2007). When homes become prisons: The relational spaces of post-socialist energy poverty. Environment and Planning A, 39, 1908–1925.10.1068/a38298
- Central Statistical Office. (2014). Household budget survey in 2013. Warsaw: Central Statistical Office.
- Chelcea, L., & Pulay, G. (2015). Networked infrastructures and the ‘local’: Flows and connectivity in a postsocialist city. City, 19, 344–355.
- Department of Energy and Climate Change. (2013). Fuel poverty report – updated august 2013. London: DECC.
- Emmel, J. M., Lee, H.-J., Cox, R. H., & Leech, I. (2010). Low-income households’ response to higher home energy costs. Family and Consumer Sciences Research Journal, 38, 372–386.
- European Communities. (2004). Household budget survey in the candidate countries. Luxembourg: Office for Official Publications of the European Communities.
- Fankhauser, S., & Tepic, S. (2007). Can poor consumers pay for energy and water? An affordability analysis for transition countries. Energy Policy, 35, 1038–1049.
- Fodor, E., & Kispeter, E. (2014). Making the ‘reserve army’ invisible: Lengthy parental leave and women’s economic marginalisation in Hungary. European Journal of Women’s Studies, 21, 382–398.
- Forster, M. F., & Toth, I. G. (2001). Child poverty and family transfers in the Czech Republic, Hungary and Poland. Journal of European Social Policy, 11, 324–341.
- Freund, C. L., & Wallich, C. I. (1996). The welfare effects of raising household energy prices in Poland. The Energy Journal, 17, 53–77.
- Gerbery, D., & Filčák, R. (2014). Exploring multi-dimensional nature of poverty in Slovakia: Access to energy and concept of energy Poverty. Ekonomickỳ časopis, 18, 579–597.
- Healy, J. D. (2004). Housing, fuel poverty and health: A pan-european analysis. Aldershot: Ashgate.
- Hegedüs, J. (2011). Social safety nets, the informal economy and housing poverty-experiences in transitional countries. European Journal of Homelessness, 5, 15–26.
- Hills, J. (2012). Getting the measure of fuel poverty: Final Report of the fuel poverty review. London: LSE.
- Nowotny, Ewald (2015). Macroeconomic imbalances and economic inequality in CESEE. In: E. Nowotny, D. Ritzberger-Grünwald, & H. Schuberth (Eds.), The challenge of economic rebalancing in Europe: Perspectives for CESEE countries (pp. 112–130). Cheltenham: Elgar.10.4337/9781784719807
- Kovačević, A. (2004). Stuck in the past: Energy, environment and poverty in Serbia and Montenegro. Belgrade: United Nations Development Programme.
- Lampietti, J., & Meyer, A. (2002). When heat is a Luxury: Helping the urban poor of Europe and Central Asia Cope with the Cold. Washington, D.C.: World Bank.
- Matković, T., Šućur, Z., & Zrinščak, S. (2007). Inequality, poverty, and material deprivation in new and old members of European Union. Croatian medical journal, 48, 636–652.
- Miazga, A., & Owczarek, D. (2015). It’s cold inside – energy poverty in Poland. Warsaw: Institute for Structural Research.
- Milanović, B. (1998). Income, inequality, and poverty during the transition from planned to market economy. Washington D.C: The World Bank.
- Moore, R. (2012). Definitions of fuel poverty: Implications for policy. Energy Policy, 49, 19–26.
- Mysíková, M. (2012). Gender wage gap in the Czech Republic and Central European Countries. Prague Economic Papers, 21, 328–346.
- Noelke, C., Gebel, M., & Kogan, I. (2012). Uniform inequalities: Institutional differentiation and the transition from higher education to work in post-socialist central and Eastern Europe. European Sociological Review, 28, 704–716.
- Paci, P., Sasin, M. J., & Verbeek, J. (2004). Economic growth, income distribution and poverty in Poland during transition. Rochester, NY: Social Science Research Network, SSRN Scholarly Paper No. ID 643241.
- Petrova, S. (2016). Communities in transition: Protected nature and local people in Eastern and Central Europe. London: Routledge.
- Petrova, S., Gentile, M., Mäkinen, I. H., & Bouzarovski, S. (2013). Perceptions of thermal comfort and housing quality: Exploring the microgeographies of energy poverty in Stakhanov, Ukraine. Environment and Planning A, 45, 1240–1257.
- Petrova, S., Posova, D., House, A., & Sykora, L. (2013). Discursive framings of low carbon urban transitions: The Contested Geographies of ‘Satellite Settlements’ in the Czech Republic. Urban Studies, 50, 1439–1455.
- Schwarcz, G. (2012). Ethnicizing poverty through social security provision in rural Hungary. Journal of Rural Studies, 28, 99–107.
- Stenning, A., Smith, A., Rochovská, A., & Świa̧tek, D. (2010). Domesticating neo-liberalism: Spaces of economic practice and social reproduction in post-socialist cities. Malden/Oxford/Chichester: Wiley-Blackwell.10.1002/9781444325409
- Thomson, H. R., & Snell, C. (2012). Quantifying the prevalence of fuel poverty across the European Union, Unpublished manuscript.
- Tirado Herrero, S., & Ürge-Vorsatz, D. (2012). Trapped in the heat: A post-communist type of fuel poverty. Energy Policy, 49, 60–68.
- Ürge-Vorsatz, D., Miladinova, G., & Paizs, László (2006). Energy in transition: From the iron curtain to the European Union. Energy Policy, 34, 2279–2297.
- Večerník, J. (2012). Earnings disparities and income inequality in CEE Countries. Eastern European Economics, 50, 27–48.
- Walker, R., Liddell, C., McKenzie, P., Morris, C., & Lagdon, S. (2014). Fuel poverty in Northern Ireland: Humanizing the plight of vulnerable households. Energy Research & Social Science, 4, 89–99.
- Whelan, C. T., & Maître, B. (2012). Understanding material deprivation: A comparative European analysis. Research in Social Stratification and Mobility, 30, 489–503.
- Zaidi, S. (2009). Main drivers of income inequality in Central European and Baltic Countries - some insights from recent household survey data. Washington DC: The World Bank.

