
 ?Mathematical formulae have been encoded as MathML and are displayed in this HTML version using MathJax in order to improve their display. Uncheck the box to turn MathJax off. This feature requires Javascript. Click on a formula to zoom.
Abstract
It is estimated that one in seven couples in the UK experience infertility, though just over half of those affected by it seek professional help. Previous studies pointed to potential socioeconomic barriers in accessing assisted reproduction; however, less is known about geographic accessibility to fertility treatment and the way it is associated with measures of deprivation. In this study, we used publicly available data on fertility clinics, combined with official statistics for 315 local authorities in England, to create a standardized measure of geographic accessibility to fertility services. In addition, using a negative binomial regression model, we estimated the link between socioeconomic measures at the local authority level and availability of fertility services. We found that geographic accessibility to assisted reproduction is significantly higher in the most advantaged local authorities in terms of average household income and level of deprivation. This may lead to reduced opportunities for realizing fertility aspirations among those suffering from infertility in more deprived areas. Taking into account both socioeconomic and geographic barriers to accessing fertility treatment can contribute to a better understanding of help-seeking patterns for infertility, likelihood of achieving a live birth and inform policy to equalise opportunities in access to infertility treatment.
Introduction
Infertility has been recognized by the World Health Organization as a global public health issue, which has far-reaching consequences on health and well-being (Vayena et al., Citation2002). Developments in Assisted Reproductive Technologies (ARTs) over the past decades revolutionized the treatment in infertility, with in vitro fertilization (IVF) being a key method used in assisted reproduction (Chambers et al., Citation2016; Präg & Mills, Citation2017). In the United Kingdom, it is estimated that infertility affects one in seven heterosexual couples (National Institute for Health and Care Excellence, Citation2014), yet, just over half of those affected by infertility have sought medical or professional help (Datta et al., Citation2016).
The usage rate of assisted reproductive technologies in the United Kingdom is relatively low compared to other European countries, which can be attributed in part to limited public funding (Präg & Mills, Citation2017). Previous studies have pointed to existing economic barriers in accessing infertility treatment in the United Kingdom; for example, Datta et al. (Citation2016) have shown that those with higher status occupations and higher level of qualifications in Britain are more likely to seek professional help when experiencing infertility than those from lower socioeconomic strata. In addition, lower education was found associated with extended delays in seeking medical help for infertility (Bunting & Boivin, Citation2007).
While previous research on access to fertility treatment focussed mainly on socioeconomic disparities, less is known about the role of geographic accessibility to assisted reproduction, including distance to the nearest fertility clinic, number of fertility clinics per population in a given area and differential access to treatment by area of residence. Geographic differences in access to healthcare have been documented in other research in the United Kingdom. Examples include geographic disparity in access to cardiovascular care, mental health services and dementia support (Asthana et al., Citation2016), as well as in access to orthopaedic surgery procedures, including knee or hip replacement (Appleby et al., Citation2011). In addition, Price et al. (Citation2020) found regional variations in the referral for young people with attention-deficit hyperactivity disorders with higher referral rates in London and the South East compared to the South West and other regions. So far, however, there has not been a systematic analysis of disparities in geographic accessibility to fertility treatment in the United Kingdom.
Limited geographic accessibility is particularly challenging in the context of ARTs, as these treatments typically involve multiple consultative appointments and imaging, invasive procedures and partner-based care (Harris et al., Citation2017; Mikhael et al., Citation2021). Therefore, the absence of a local fertility clinic is likely to raise economic costs of treatment through added expenses for travel and work absences. Furthermore, patients who travel long distances for fertility treatment may have reduced social support, by being far away from their network of family and friends, or face longer appointment waiting times (Harris et al., Citation2017).
While the prevalence of infertility in the United Kingdom does not vary significantly by regional socioeconomic indicators (Datta et al., Citation2016; Dhalwani et al., Citation2013), the likelihood of help seeking, as well as treatment outcomes, have been found associated with area-level deprivation (Datta et al., Citation2016; Richardson et al., Citation2019). According to Datta et al. (Citation2016), women from the most deprived areas in the UK are less likely to seek professional help when experiencing infertility. Furthermore, Richardson et al. (Citation2019) have found that IVF patients from more deprived areas in England had significantly lower rates of clinical pregnancy and live birth following a single first cycle of embryo transfer. Therefore, it is important to understand the variation in geographic accessibility to fertility treatment and the extent to which it is linked with area-specific socioeconomic factors.
In this study, we focus on geographic accessibility to fertility treatment in England, which has the lowest proportion of treatment cycles funded by the National Health Service (NHS), amongst the four nations comprising the United Kingdom (Human Fertilisation and Embryology Authority, Citation2021a)Footnote1. Therefore, issues of accessibility to fertility treatment may be particularly pronounced in this region. According to Boyle et al. (Citation2010), access to healthcare should be assessed using a multi-dimensional perspective, taking into consideration different domains of accessibility, including physical access, timely access and the extent of choice. Therefore, we constructed a measure of geographic accessibility to fertility treatment using a combined rate, which incorporates both distance and availability of fertility clinics per women in reproductive ages. Using this measure, we estimate the geographic distribution of fertility clinics in England as well as the number of women in reproductive ages with limited access to fertility services. In addition, we use a multiple regression analysis to estimate how socioeconomic measures at the local authority level are linked with the clinics accessibility rate.
Materials and methods
Data and measures
In order to assess geographic accessibility to fertility treatment across local authorities in England, we have compiled publicly available records of fertility clinics and their location, together with sociodemographic information at the local authority level. Information on fertility clinics was extracted from the Human Fertilization and Embryology Authority (HFEA) (www.hfea.gov.uk), which holds publicly available information on all licensed fertility clinics in the United KingdomFootnote2. The data were collected in June 2020 and included name of the clinic, clinic’s location using postcode, whether IVF treatment is offered and patients’ funding sources, for example, NHS and/or privately funded patients. This information was recorded for all clinics providing fertility treatment and consultation services. This includes satellite clinics, which form an extension to a larger clinic and provide a limited range of services. However, research and storage only clinics are excluded from the analysis. As of 2020, there are 92 main fertility clinics and 52 satellite clinics in England. The information on local authorities was drawn from national official statistics. Local authorities are made up of district councils, Unitary Authorities, Metropolitan Areas, and London Boroughs, resulting in 315 local authorities included in the analysisFootnote3. The measures obtained for each local authority in our sample include:
The data on the number of women of reproductive ages (18–50) in each local authority in 2019 was drawn from the Office for National Statistics’ population estimates by sex and age (Office for National Statistics, Citation2020a).
We used the Rural-Urban Classification of English Local Authority Districts (RUCLAD2011) to determine degree of urbanisation. This classification includes the following categories: 1 = mainly rural (80% or more of the population is rural), 2 = largely rural (population 50–79% rural), 3 = urban with significant rural (population 26–49% rural), 4 = urban with city and town, 5 = urban with minor conurbation, 6 = urban with major conurbation. Where in the latter three categories, less than 26% of the population is rural (see: Bibby & Brindley, Citation2016). Since there are only few local authorities in category 5, we merged urban with minor and major conurbation into a single category, resulting in five categories used for the analysis.
Gross disposable household income (GDHI) per head refers to the amount of money available to all individuals in the household sector, after tax deductions and received benefits (Office for National Statistics, Citation2020b). To facilitate comparison across local authorities, the GDHI per head is estimated for the entire population in a given local authority, with the most recent available data from 2017Footnote4. For the purpose of the analysis, we use the log transformation of the GDHI per head.
Index of Multiple Deprivation (IMD) is the official measure of relative deprivation for small areas in England. The IMD incorporates seven different weighted domains of deprivation, including income, employment, education, health, crime, barriers to housing, and services and living environment (McLennan et al., Citation2019). In this study, we used the population weighted average rank of IMD for local authority districts from 2019. For ease of data presentation, we calculated IMD quintiles for each local authority, where 1 is the most deprived and 5 is the least deprived.
Since available means of transportation are another key factor in accessibility to healthcare services (Boyle et al., Citation2010), we have added a measure of average number of cars per household for each local authority. This was estimated using data on licenced cars per local authority in 2018 (Department for Transport, Citation2021), divided by the number of households from the same year (Office for National Statistics, Citation2020c).
Clinics accessibility rate was calculated using the number of fertility clinics within a 25 km radius from the centre of each local authority, divided by the number of eligible women and multiplied by 10,000. This measure represents the rate of fertility clinics per 10,000 eligible women (aged 18-50). The advantage of this rate is that it incorporates both distance and number of clinics available, while allowing comparison across local authorities with different population sizes. In addition, this measure overcomes the problem of crossing administrative boundaries (see Bauer et al., Citation2018), as the nearest clinic might be in a different local authority from where the patient lives. Finally, it allows flexibility in modelling different types of clinics, including clinics accepting NHS patients or clinics offering IVF treatment.
The number of IVF cycles performed by IVF providing clinics in 2019 ranges from 46 to 3,023 (Human Fertilisation and Embryology Authority, Citation2021b). To address these disparities, we created a weighting system, where clinics are classified as ‘small’ (<411 cycles), ‘medium’ (411-900 cycles) or ‘large’ (>900 cycles), with the respective weights of 1, 2 and 3. While some of the satellite clinics provide a limited number of IVF cycles on site, there is no information on the exact number. Therefore, these were classified as ‘small’. The sample characteristics for the data used in this study is presented in .
Table 1. Summary statistics for local authorities in England (N = 315).
Statistical analyses
Clinics’ locations are plotted using their longitude and latitude coordinates derived from their postcode. The digital boundaries for the regions and local authorities of England are obtained from the ONS Open Geography Portal, using Regions (December 2019) Boundaries EN GBC (Office for National Statistics, Citation2020d) and Local Authority Districts (April 2019) UK BFE (Office for National Statistics, Citation2020e). In addition, we created choropleth maps to show variations across local authorities in the clinics accessibility rate, i.e. the number of clinics per 10,000 eligible women within 25 km of each local authority’s centre. Separate maps are used to show the accessibility rate for all fertility clinics and for clinics offering IVF. We also show the variation in the weighted accessibility rate for all IVF clinics and clinics offering IVF for NHS funded patients, based on the volume of IVF cycles performed by these clinics. All maps were created using the spmap package (Pisati, Citation2018) in Stata software, version 17 (StataCorp, Citation2021).
We use a multiple regression analysis to examine the link between the number of clinics within 25 km and regional characteristics – including degree of urbanisation, gross disposable household income per head, deprivation and number of cars per household. The number of clinics is distributed as a count variable, but is also overdispersed, as the variance is greater than the mean (see ). Therefore, we use a negative binomial regression model, which is suitable for estimating count data, but is not susceptible to the problem of under fitting the amount of overdispersion in the outcome (Long & Freese, Citation2006). In addition, since local authorities differ in their population size and the proportion of women in reproductive ages living there, we account for the number of women aged 18–50 by including it as an exposure variable with a coefficient constrained to 1. Hence, the formula for the negative binomial regression model is defined as:
where
is the expected number of fertility clinics within 25 km,
is the number of women aged 18-50 per local authority and
are a set of independent variables, representing geographic and socioeconomic factors. Finally,
is the intercept, while
are the other parameters estimated by the data. We ran separate models for all clinics, clinics offering IVF services (whether for NHS or private patients) and clinics offering NHS-funded IVF treatment. For the latter two, we have also ran a sensitivity analysis, using the weighted number of IVF clinics within 25 km according to the relative number of performed cycles. All models were calculated using Stata 17 (StataCorp, Citation2021).
Results
Geographic distribution of fertility clinics in the UK
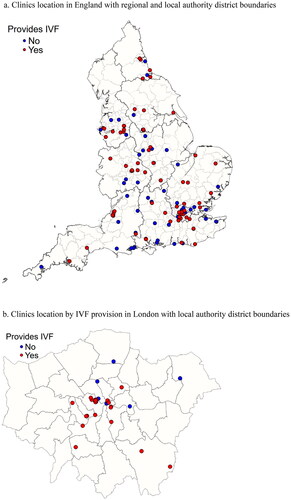
shows the locations of fertility clinics in England by IVF provision status. Out of a total of 144 clinics, 87 offer IVF services (60%). The largest concentration of clinics is found in London (37 clinics), followed by the South East (24 clinics). On the other hand, fertility clinics are more sparse in the South West (19 clinics), East of England (15), North West (13), West Midlands (12), East Midlands (10), Yorkshire and the Humber (7) and in the North East (7). provides more details on the distribution of fertility clinics in the London area. It is shown that most fertility clinics are located in central London, with the largest concentration of clinics found in Westminster (17).
Figure 1. Clinics location by IVF provision.
a. Clinics location in England with regional and local authority district boundaries.
b. Clinics location by IVF provision in London with local authority district boundaries
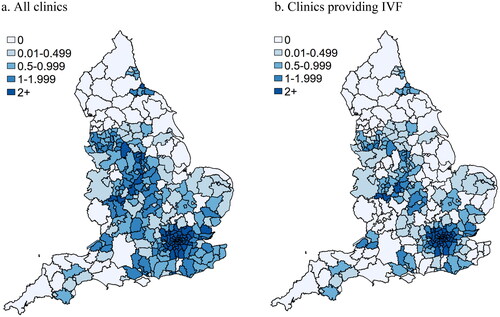
These, however, represent the raw number of fertility clinics. presents the choropleth map for the rate of clinics per 10,000 women of reproductive age in each local authority. It is shown that the London area has the highest clinics rate, with two or more clinics per 10,000 eligible women within a radius of 25 km. In addition, the South East and the Midlands have a relatively high concentration of clinics, though with some variation across local authorities. By contrast, the North of England and the South West have the lowest rates of clinics available per population of women in reproductive ages. Overall, nearly a fifth of local authorities do not have fertility clinics within a radius of 25 km. This translates to over 1.6 million women of reproductive ages with no available assisted fertility services in their area of residence. A similar number of women have access to only one fertility clinic within a radius of 25 km of their local authority, resulting in approximately 3.2 million women aged 18–50 with limited accessibility to fertility services.
Figure 2. Clinics rate within 25 km per 10,000 women aged 18-50.
The proportion of local authorities with proximity to fertility clinics that provide IVF treatment is considerably smaller, as can be seen in . Most local authorities with limited access to these services are found in the North, including the Yorkshire and Humberside region, and in the South West. Overall, nearly a third of local authorities, with a total population of more than 2.8 million women of reproductive age, do not have available clinics offering IVF treatment in their area. In addition to that, just over two million women aged 18-50 live in local authorities with only one clinic within 25 km that provides IVF. The number of women of reproductive age with limited access to NHS-funded IVF treatment is somewhat higher, with nearly three million living in local authorities with no proximity to clinics providing IVF to NHS funded patients, and further 2.4 million women with access to only one clinic within 25 km. This results in around 5.4 million women who are living in areas with no or limited availability of clinics providing NHS-funded IVF services.
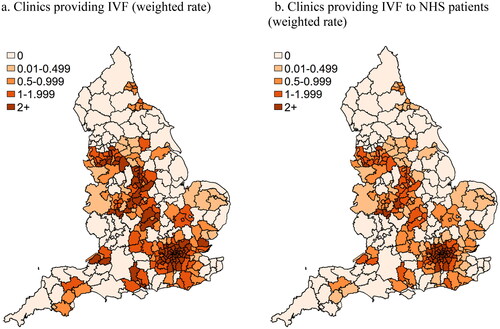
Similar geographic disparities in access to IVF treatment are shown when using a weighted rate for accessibility to fertility treatment, based on the volume of IVF cycles performed by the clinics. As shown in , the areas with the highest accessibility to IVF treatment are London and the Midlands. However, the weighted accessibility rates are substantially lower for clinics providing IVF to NHS funded patients (see ).
Figure 3. Clinics rate within 25 km per 10,000 women aged 18-50, weighted by the volume of IVF provision.
As expected, clinics accessibility rate is highest in London and lower in less densely populated areas in the North and South West of England. Nevertheless, it is unclear whether geographic accessibility to fertility services is linked with other socioeconomic factors, once population size and degree of urbanisation are held constant. In the next section, we explore the relationships between socioeconomic characteristics at the local authority level and geographic accessibility to fertility treatment using a multivariable regression analysis.
Multiple regression analysis
presents the results of the negative binomial regression model for the number of clinics within 25 km. This includes separate models for all clinics, IVF clinics and clinics offering IVF treatment to NHS patients within that distance. The results from the analysis show a generally positive association between socioeconomic measures at the local authority level and geographic accessibility to fertility services in England. A strong positive relationship is found between GDHI per head and clinics rate within 25 km. This relationship is found across all models, though it is slightly weaker for IVF clinics serving NHS patients (see , Model 3). In addition, significant differences in accessibility to fertility treatment are found by level of deprivation, as clinics rate is lower by around 30% in the more deprived areas (IMD 1-2 and IMD 3) compared to its rate in the least deprived areas (IMD 4-5). These findings are also consistent when using the weighted clinics rate (see , Models 4-5).
Table 2. Negative binomial regression model for fertility clinics within a range of 25 km (incidence rate ratios) a.
The coefficient for cars per household is positive though in most models, it is not statistically significant. The reason for that is likely to be that the number of cars per household is higher in less urban areas, which also have lower accessibility to fertility clinics. The exception to that is in model 5 for the weighted number of clinics offering IVF to NHS patients, where the measure for cars per household is significantly correlated with accessibility to fertility treatment.
In line with the findings shown in , the clinics rate in mainly or largely rural areas is lower by more than 80% compared to urban areas with minor or major conurbation. In addition, in urban areas with a city and town and those with a significant rural population, the clinics rate is lower by more than 60% compared to the areas with the highest degree of urbanisation. As expected, the London region has the highest clinics rate, where all other regions, apart from the East Midlands, show significantly lower rates. In addition, there are no significant differences in the clinics rate between London and the West Midlands when considering Clinics providing IVF to NHS patients and when using the weighted measure for clinics rate (see , Models 3–5). Compared to London, the regions with the lowest clinics rate include the South West, with a clinics rate lower by around 70%, and Yorkshire and the Humberside with a clinics rate lower by around 90% than that in London (see , Models 1–5). Overall, the findings show that after controlling for population size, region, and degree of urbanisation, the wealthier areas – mainly in terms of household income and level of deprivation – also have higher geographic accessibility to fertility treatment across England.
Discussion
In this study, we explored the spatial distribution of fertility clinics in England and analysed the geographic accessibility to fertility treatment in relation to regional socioeconomic characteristics. We find major discrepancies in the availability of fertility clinics across different regions, where Yorkshire and Humberside and the South West are the regions with the lowest number of fertility clinics per women in reproductive ages. These findings are in line with research on geographic accessibility to other types of healthcare services, which show higher provision of these services in London and its surrounding areas, compared to other regions in England (Appleby et al., Citation2011; Asthana et al., Citation2016; Price et al., Citation2020). Furthermore, we found that the clinics accessibility rate is strongly linked with area-level measures of economic wealth. Our findings show that accessibility to fertility treatment is significantly higher in local authorities with greater average household income. In addition, the clinics rate in more deprived local authorities is lower by around 30% than that in the least deprived areas.
Since previous studies have shown that the prevalence of infertility is largely similar across areas with varying levels of deprivation (Datta et al., Citation2016; Dhalwani et al., Citation2013), these discrepancies in the availability of fertility clinics cannot be simply attributed to differential demand. Rather, the lower clinics rate in more deprived local authorities may further hinder the likelihood of seeking medical help and usage of assisted reproduction technologies among those living in these areas.
Restricted geographic accessibility to fertility treatment may pose a substantial barrier, as it entails additional expenses, including travel costs and time off work and may also lead to longer waiting times (Harris et al., Citation2017; Mikhael et al., Citation2021). Given the limited provision of publicly funded IVF treatment in England, reduced geographic accessibility to fertility clinics is likely to exacerbate existing inequalities in access to medically assisted reproduction. According to our findings, around 3.2 million women of reproductive age have no or limited availability of fertility clinics in their area of residence, while the parallel figure of women with limited accessibility to clinics providing funded IVF treatment is approximately 5.4 million. It should be noted though, that these figures do not include any male partners affected by infertility.
The main limitations of this study involve the dynamic nature of the fertility sector and policy regarding the provision of assisted reproduction technologies. For example, the number of clinics and the available services they offer may change over time. In addition, we did not control for the level of local provision of funded IVF cycles by clinical commissioning groups, which is also subject to frequent changes (Fertility Fairness, Citation2017). Moreover, the Coronavirus pandemic has led to ongoing disruptions and delays to assisted reproduction services in the UK and beyond (Robertson et al., Citation2020), and the effects of these disruptions on treatment accessibility are not yet fully understood, but are likely to exacerbate pre-existing inequalities in access. Nevertheless, our study provides robust evidence of geographic and socioeconomic disparities in access to fertility treatment in England. By using a statistical model that takes into account differences in the target population size and degree of urbanisation, we showed that accessibility to fertility clinics is lower in more deprived areas, regardless of these factors. Furthermore, our model includes multiple socioeconomic measures at the local authority level, which encompass both aggregate measures of wealth as well as other spatial aspects of economic and social deprivation.
The findings from this study can be used to inform future planning of fertility services in England, by highlighting the areas with lower geographic accessibility to fertility clinics and its link to socioeconomic deprivation. A more strategic approach for setting the location of fertility services providers would contribute to improved accessibility and to reducing existing barriers to assisted reproduction. Furthermore, extending the provision of funded fertility treatment across England, in accordance with the recommendations of the National Institute for Health and Care Excellence (Citation2017) will also increase access, particularly for more deprived groups.
Future research should take into account the multiple aspects of accessibility to fertility treatment, which may include a combination of economic, geographic, cultural or other barriers. In addition, more interdisciplinary socio-medical research is needed to understand the interaction between spatial factors and individual level characteristics in relation to help seeking, accessing, and successful outcomes of treatment for infertility.
Author contributions
N. P.-R. and A. M.-Z. conceived the study. B. J. and N. P.-R. were responsible for study design with the help of A. M.-Z. Data collection and processing were carried out by B. J. with the help of N. P.-R. Data analysis and interpretation was done by N. P.-R. and B. J. The first draft was written by N. P.-R. with contributions from B. J. and A. M.-Z. All authors approved the final draft.
Disclosure statement
No potential conflict of interest was reported by the author(s).
Additional information
Funding
Notes
1 According to the Human Fertilisation and Embryology Authority (HFEA), in 2019, 32% of IVF cycles in England were funded by the NHS, compared to 39% in Wales, 62% in Scotland and 34% in Northern Ireland (Human Fertilisation and Embryology Authority, Citation2021a).
2 According to the Human Fertilisation and Embryology Act 1990, fertility clinics must apply for a licence from the HFEA in order to carry out their work.
3 We have excluded the City of London and the Isles of Scilly from the analysis, due to their relatively small and highly selective populations.
4 Only provisional estimates are available for 2018.
References
- Appleby, J., Raleigh, V., Frosini, F., Bevan, G., Gao, H., & Lyscom, T. (2011). Variations in health care: The good, the bad and the inexplicable. The King’s Fund. https://www.kingsfund.org.uk/publications/variations-health-care
- Asthana, S., Gibson, A., Bailey, T., Moon, G., Hewson, P., & Dibben, C. (2016). Equity of utilisation of cardiovascular care and mental health services in England: A cohort-based cross-sectional study using small-area estimation. Southampton (UK): NIHR Journals Library, 4(14). https://doi.org/10.3310/hsdr04140
- Bauer, J., Müller, R., Brüggmann, D., & Groneberg, D. A. (2018). Spatial accessibility of primary care in England: A cross-sectional study using a floating catchment area method. Health Services Research, 53(3), 1957–1978. https://doi.org/10.1111/1475-6773.12731
- Bibby, P., & Brindley, P. (2016). Urban and rural classification of English local authority districts and similar geographical units in England: Methodology. Department for Environment, Food & Rural Affairs. https://www.gov.uk/government/statistics/2011-rural-urban-classification-of-local-authority-and-other-higher-level-geographies-for-statistical-purposes
- Boyle, P., Appleby, J., & Harrison, A. A. (2010). Rapid review of access to care: An inquiry into the quality of general practice in England. The King’s Fund. https://www.kingsfund.org.uk/sites/default/files/field/field_document/rapid-view-access-care-gpinquiry-research-paper-mar11.pdf [Accessed 30 June 2021].
- Bunting, L., & Boivin, J. (2007). Decision-making about seeking medical advice in an internet sample of women trying to get pregnant. Human Reproduction, 22(6), 1662–1668. https://doi.org/10.1093/humrep/dem057
- Chambers, G. M., Wand, H., Macaldowie, A., Chapman, M. G., Farquhar, C. M., Bowman, M., Molloy, D., & Ledger, W. (2016). Population trends and live birth rates associated with common ART treatment strategies. Human Reproduction (Oxford, England), 31(11), 2632–2641. https://doi.org/10.1093/humrep/dew232
- Datta, J., Palmer, M. J., Tanton, C., Gibson, L. J., Jones, K. G., Macdowall, W., Glasier, A., Sonnenberg, P., Field, N., Mercer, C. H., Johnson, A. M., & Wellings, K. (2016). Prevalence of infertility and help seeking among 15000 women and men. Human Reproduction (Oxford, England), 31(9), 2108–2118. https://doi.org/10.1093/humrep/dew123
- Department for Transport. (2021). Vehicles statistics. https://www.gov.uk/government/collections/vehicles-statistics
- Dhalwani, N. N., Fiaschi, L., West, J., & Tata, L. J. (2013). Occurrence of fertility problems presenting to primary care: Population-level estimates of clinical burden and socioeconomic inequalities across the UK. Human Reproduction (Oxford, England), 28(4), 960–968. https://doi.org/10.1093/humrep/des451
- Fertility Fairness. (2017). NHS IVF provision report 2017. https://fertilitynetworkuk.org/wp-content/uploads/2017/10/Fertility-Fairness-2017-Report.pdf
- Harris, J. A., Menke, M. N., Haefner, J. K., Moniz, M. H., & Perumalswami, C. R. (2017). Geographic access to assisted reproductive technology health care in the United States: A population-based cross-sectional study. Fertility and Sterility, 107(4), 1023–1027. https://doi.org/10.1016/j.fertnstert.2017.02.101
- Human Fertilisation and Embryology Authority. (2021a). Fertility treatment 2019: Trends and figures. https://www.hfea.gov.uk/about-us/publications/research-and-data/fertility-treatment-2019-trends-and-figures/#Section8
- Human Fertilisation and Embryology Authority. (2021b). State of the fertility sector 2020/21. https://www.hfea.gov.uk/about-us/publications/research-and-data/state-of-the-fertility-sector-2020-2021
- Long, J. S., & Freese, J. (2006). Regression models for categorical dependent variables using Stata. (2nd ed) Stata Press.
- McLennan, D., Noble, S., Noble, M., Plunkett, E., Wright, G., & Gutacker, N. (2019). The English Indices of Deprivation 2019: Technical report. Ministry of Housing, Communities & Local Government. https://www.gov.uk/government/publications/english-indices-of-deprivation-2019-technical-report
- Mikhael, S., Gaidis, A., & Gavrilova-Jordan, L. (2021). Regional disparities in access to assisted reproductive technology: Assessment of patient satisfaction when employing modern technology to close the gap. Journal of Assisted Reproduction and Genetics, 38, 889–894. https://doi.org/10.1007/s10815-020-02027-7
- National Institute for Health and Care Excellence. (2014). Health and social care directorate: Quality standards and indicators. Briefing Paper. https://www.nice.org.uk/guidance/qs73/documents/fertility-problems-briefing-paper2
- National Institute for Health and Care Excellence. (2017). Fertility problems: Assessment and treatment. Clinical guideline [CG156]. https://www.nice.org.uk/guidance/cg156/chapter/Recommendations#access-criteria-for-ivf
- Office for National Statistics. (2020a). Estimates of the population for the UK, England and Wales, Scotland and Northern Ireland. https://www.ons.gov.uk/peoplepopulationandcommunity/populationandmigration/populationestimates/datasets/populationestimatesforukenglandandwalesscotlandandnorthernireland
- Office for National Statistics. (2020b). Regional gross disposable household income, UK: 1997 to 2018. https://www.ons.gov.uk/economy/regionalaccounts/grossdisposablehouseholdincome/bulletins/regionalgrossdisposablehouseholdincomegdhi/latest
- Office for National Statistics. (2020c). Estimated number of households in the local and unitary authorities of England and Wales, Council areas of Scotland, and local government districts of Northern Ireland, 2012 to 2018. https://www.ons.gov.uk/peoplepopulationandcommunity/birthsdeathsandmarriages/families/adhocs/11620estimatednumberofhouseholdsinthelocalandunitaryauthoritiesofenglandandwalescouncilareasofscotlandandlocalgovernmentdistrictsofnorthernireland2012to2018
- Office for National Statistics. (2020d). Regions (December 2019) Boundaries EN BGC. Open Geography Portalx. https://geoportal.statistics.gov.uk/datasets/regions-december-2019-boundaries-en-bgc/explore?location=52.717048%2C-2.489450%2C7.00
- Office for National Statistics. (2020e). Local Authority Districts (April 2019) UK BFE. Open Geography Portalx. https://geoportal.statistics.gov.uk/datasets/b06ce126e1014409ac24c82739b2c130_0/explore?location=54.227778%2C-3.250000%2C6.00
- Pisati, M. (2018). SPMAP: Stata module to visualize spatial data. https://EconPapers.repec.org/RePEc:boc:bocode:s456812
- Präg, P., & Mills, M. C. (2017). Assisted reproductive technology in Europe: usage and regulation in the context of cross-border reproductive care. In M. Kreyenfeld & D. Konietzka (Eds.), Childlessness in Europe: Contexts, causes, and consequences. (pp.289–309). Springer International Publishing.
- Price, A., Ford, T., Janssens, A., Williams, A. J., & Newlove-Delgado, T. (2020). Regional analysis of UK primary care prescribing and adult service referrals for young people with attention-deficit hyperactivity disorder. BJPsych Open, 6(1), e7. https://doi.org/10.1192/bjo.2019.94
- Richardson, A. L., Baskind, N. E., Karuppusami, R., & Balen, A. H. (2019). Effect of deprivation on in vitro fertilisation outcome: A cohort study. BJOG: An International Journal of Obstetrics & Gynaecology, 127, 458–465. https://doi.org/10.1111/1471-0528.16012
- Robertson, I., Kermack, A. J., & Cheong, Y. (2020). The impact of Covid-19 on infertility services and future directions. Reproduction & Fertility, 1(1), C3–C7. https://doi.org/10.1530/RAF-20-0017
- StataCorp. (2021). Stata Statistical Software: Release 17. StataCorp LLC.
- Vayena, E., Rowe, P. J., & Griffin, D. P. (2002). Current practices and controversies in assisted reproduction. World Health Organization. https://www.who.int/reproductivehealth/publications/infertility/9241590300/en/