
ABSTRACT
It is important to assess which dispensed medications remain unused as accumulated home medications serve as a source for poisonings, abuse, and misuse. The objective of this study was to characterize and quantify controlled substances relinquished at community medication take back events. Medications were brought to events from 2011 to 2015 across six states. We analyzed medication classification (over-the counter, controlled, non-controlled), medication name, strength, formulation, original dispensed quantity, collected quantity, and therapeutic class. The top nine controlled therapeutic class categories are reported in this study, excluding liquid formulations. The total number of collected controlled prescriptions and units (tablets/capsules/patches) were calculated. Averages are presented for dispensed and collected quantity, and percent waste (unused) for medication categories. Over 10,270 prescriptions with 280,813 units were collected and logged. With 85 units per prescription, morphine had the greatest average originally dispensed units. Hydrocodone had the greatest quantity of prescriptions (4,717), containing 104,460 units. Pregabalin had the highest waste at 74.8%, followed by fentanyl patches (70.1%) and morphine (68.4%). Of the medications returned, more than half of the originally dispensed prescriptions for all medication categories remained unused. All aspects of controlled substance supply and demand should be scrutinized to address this public health epidemic while ensuring optimal patient care.
Introduction
Unused home medications serve as a known source for poisonings, abuse, and misuse. Leftover medications include two primary categories: over-the-counter and prescription products, with prescriptions further classified as non-controlled or controlled substances. Controlled substances have the potential for abuse and dependence and carry inherent risks, including increased morbidity and mortality, due to their relative potency and mechanisms of action.
Background/literature
Prescription opioid misuse or abuse and related health consequences are a significant public health crisis within the United States. Drug overdose death rates involving opioids have increased five-fold since 1980 with overdose deaths surpassing motor vehicle accident deaths in 2009 (Warner et al., Citation2011; Paulozzi et al., Citation2011; NSDUH Series H-48, 2014). In fact, there were more drug overdose deaths in 2014 than any other year on record (Rudd et al., Citation2016). Emergency department (ED) visits have increased significantly over recent years with children five years or younger representing over 99% of all accidental ingestion ED visits (Drug Abuse Warning Network 2013). Rates of prescription-drug-abuse-related treatment admissions are growing and nearly 39% of the 41,502 drug poisoning/overdose deaths in 2012 involved opioids (Paulozzi et al., Citation2011; Warner et al., 2014). Additionally, studies have indicated that approximately 80% of injection drug users frequently misused prescription medications prior to initiating injectable heroin, suggesting that prescriptions may be a gateway for injection drug use (Pollini et al., Citation2011; Lankenau et al., Citation2012, Jones, Citation2013).
The 2013 National Survey on Drug Use and Health (NSDUH) evaluated how users obtained opioid medications for nonmedical use. Among those studied, 53% obtained medications from a friend or relative for free, 23.8% were prescribed the medication, 10.6% bought the medication from a friend or relative, 4% took the medication from a friend or relative without permission, 4.3% utilized a drug dealer/stranger, 0.7% stole them from a doctor’s office, clinic, hospital, or pharmacy, and 0.1% bought the medication from the Internet (NSDUH 2014). Additionally, a prospective cohort study focusing on emergency department patients with unused opioid medications found that 18.2% of participants “lost” the medication, indicating possible theft (Tanabe et al., Citation2012).
Several studies indicate opioid medications may be prescribed outside of medical need. In 2012, 259 million opioid prescriptions were written; enough for every adult in America to have one prescription vial (CDC Vital Signs, Citation2014). A prospective observational study of 212 dermatologic surgical patients found opioids were prescribed for 72 patients. Of those, 35% did not use the medication and 86% reported leftover pills. Of the patients with leftover pills, 53% planned to “keep them” (Harris et al., Citation2013). A second prospective cohort study evaluated opiate utilization following upper extremity outpatient surgery. In this study of 250 patients, quantities of 30 tablets were frequently prescribed with 45% of patients using between zero and five tablets, and 18% using between six and ten tablets. Of the studied patients, 77% used 15 or fewer tablets (Rodgers et al., Citation2012). A third convenience study investigated utilization of opioids following urological surgery and found that 42% of pills remained unused leaving 67% of patients with a medication surplus. Of those patients with a surplus, 91% reported they “kept the medication at home.” (Bates et al., Citation2011)
In 2010, the Secure and Responsible Drug Disposal Act, enacted by Congress, promoted the availability of secure and convenient medication disposal collection options to reduce diversion and environmental contamination. The U.S. Drug Enforcement Administration (DEA) in collaboration with local law enforcement and community groups across the country implemented a series of bi-annual National Prescription Drug Take Back Days from October 2010 through September 2014. During this time, a total of 4.8 million pounds (2,411 tons) of unused medications were collected for disposal (US DEA Citation2014). This program is dependent upon law enforcement participation and relies upon resources for which funding is not provided. Additional take back programs have been conducted across the country; however, collective figures for all programs are not available. Currently, there is no coordinated, all-inclusive, national disposal program available in the United States.
In addition to actions related to disposal, efforts are being directed toward appropriate opioid prescribing. Recently, the Centers for Disease Control and Prevention (CDC) created opioid prescribing guidelines for chronic pain treatment. The agency’s goal was to ensure safer and more effective treatment to reduce pain and improve function, while reducing the number of patients that develop substance use disorders, overdose, or other adverse events. However, this guideline is limited to adult patients with chronic pain conditions in outpatient settings and does not address prescribing outside of medical need for acute conditions, such as minor surgical procedures, other than to encourage lower doses and shorter durations of treatment (CDC Guideline for Prescribing Opioids, Citation2016).
Recent reports have indicated that progress on opioid abuse is being made, with post-marketing surveillance revealing that diversion and abuse of opioid medications plateaued or decreased between 2011 and 2013. However, a more recent report revealed opioid-related deaths increased between 2013 and 2014, with a 9% increase in deaths related to prescription pain relievers (Dart et al., Citation2015; Rudd et al., 2015).
Multiple initiatives are being implemented to address the growing opioid epidemic, including the Obama Administration’s “Public and Private Sector Efforts to Address Prescription Drug Abuse…” and the DEA’s “360 Strategy” to target drug traffickers and suppliers, engage stakeholders to increase awareness, and “equip and empower communities” (White House Fact Sheet, 2015; US DEA Citation2014). However, further research on the underlying causes of medication accumulation and which medications are most likely to accumulate, is needed in order to develop solutions. If these issues are not resolved, the opioid epidemic is likely to continue to grow. This multi-billion dollar problem is affecting our nation’s health while significantly contributing to crime and overdose deaths.
Data collection from medication take back programs provides an opportunity to characterize and quantify medications that are being prescribed and dispensed, but are not being used. This information is important in determining the extent of the problem while also allowing for indirect measurement of various efforts being introduced to address the prescription abuse epidemic.
Currently available medication take back data are limited to community events at one local site and/or one state (Ma et al., Citation2014; Stewart et al., Citation2015; Welham et al., Citation2015; Perry et al., Citation2014). Our study expands the current knowledge by including data collected from 80 community events across six states. Our study is the first to include multi-event, multi-state data collection. The primary study objective is to characterize and quantify the controlled substances relinquished at medication take back events.
Methods
Study participation sites were recruited through solicitation on the Pharmwaste listserve, a “national pharmaceutical waste management” discussion forum. Sites were offered no-cost access to a web-based pharmaceutical collection logging tool and the ability to utilize their respective data independently. No further incentive was offered beyond contributing to the knowledge base of unused medications and take back programs. Data included collection sites from Arkansas, Florida, Maine, Missouri, Pennsylvania, and Texas.
The coordinators for each site provided oversight for volunteer training and data collection and were allowed to develop events utilizing methods most suitable to their capabilities and populations served. Events were designed for collections primarily from households and hosted on the DEA’s National Medication Take Back day. Some events were conducted as drive-up/drop-off, while others were walk-up type events. Participant solicitation varied by site and ranged from pharmacy flyers to newspaper advertisement and word of mouth.
Convenience samples of study participants were assigned numbers based on order arrival to each medication take back site. The number of participant collections logged at each site was dependent on the number of event volunteers and time constraints due to the number of event participants. All items collected were documented per the project protocol. Although both non-controlled and controlled prescriptions were logged, only solid formulation controlled substance data is reported to limit the focus for this study.
The Pharmaceutical Collection Monitoring System™ (PCMS™), a web-based data collection and reporting tool, was used to catalogue all collected medications. Use of this tool facilitated consistent data points across all take back collection sites. PCMS™ was developed to interface with Micromedex®, a drug information database, in order to consistently categorize information. Collections were counted manually by line item with one line item being one prescription vial, box, or package. Data points collected within PCMS™ included participant number, medication classification (over-the-counter, controlled, non-controlled), medication name, strength, and formulation, original dispensed quantity, collected quantity and therapeutic class. Local law enforcement provided oversight for collection and logging as well as maintained control and custody of controlled substances each site.
Site coordinators were trained on PCMS™ through on-line meetings and written training materials. Volunteers included pharmacy and other health professional students, faculty, and partnering community members. Prior to each event, all volunteers signed Health Insurance Portability and Accountability Act (HIPAA) and Zero Tolerance Drug Diversion agreements. Site coordinators oversaw data collection to ensure consistent use of the project protocol. Study investigators validated logged data for accuracy and errors (e.g. incorrect classifications). Controlled substance data compiled from PCMSTM was exported into Excel® for analysis.
Descriptive statistics were used to evaluate study results. Study data were excluded if the originally dispensed quantity was unavailable or if the collected quantity exceeded the labeled dispensed quantity. The “average amount wasted” was calculated as the quantity collected (tablets, capsules, or patches) divided by the quantity dispensed. “Average pills prescribed” was calculated by adding the quantity dispensed for each line item in a category divided by the number of line items. This method was similarly used for calculating “average pills returned.” The range for average amounts was provided for participating states with the low end being the lowest “average amount wasted” and the high end being the highest.
The research protocol was reviewed and ruled exempt by the relevant institutional review boards.
Results
Medication collection data from 10,600 participants at 80 community events across six states was logged from 2011 to 2015. Of the 640,370 original units dispensed, 430,892 units of unused medication were collected. Furthermore, 107,214 units were collected from 32 events in 2011 with a decreasing trend and the lowest total (58,713 units) being collected in 2012 from 18 events (). Trends in 2015 were similar to 2011, but with a total of seven events. There was a decrease in collected medication in 2014 compared to 2013 although it should be noted that only half as many events for collection took place. The mean number of collected medications per person is reported in and follows similar trends.
Figure 1. Total amount of controlled prescription medication unitsa collected by calendar date, 2011–2015.
Figure 2. Average number of controlled prescription medication units collected per participant by calendar date, 2011–2015.
The percentage of controlled prescription medication returns by drug class can be found in . After exclusion for liquid formulations, missing original prescription quantity and collected quantity exceeding original labeled quantity, the top nine controlled medication categories totaled over 10,270 prescriptions and 280,813 medication units returned. Proportionally, hydrocodone, benzodiazepines and tramadol, together comprised 76% of the collected controlled substances (). Hydrocodone was collected in the greatest quantity with over 104,460 units, followed by over 61,000 benzodiazepine units and 47,000 tramadol units. Just over 17,000 oxycodone units were collected, followed by morphine with almost 15,000 units.
Figure 3. Percentage of controlled prescription medication returns by drug class, 2011–2015.
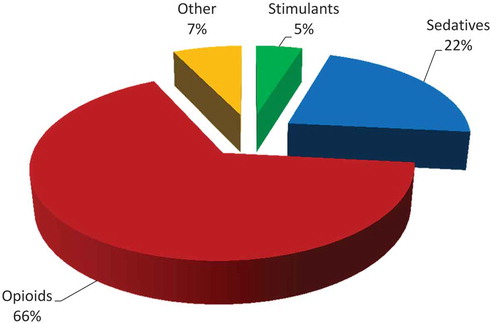
Figure 4. Percentage of controlled prescription medication returns by drug category, 2011–2015.
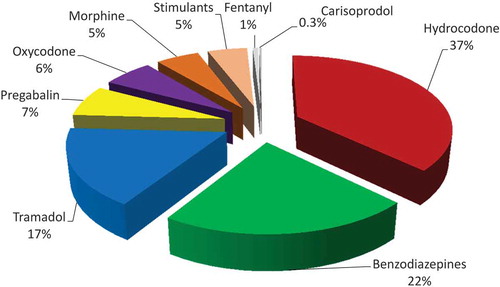
Average prescription waste exceeded 50% of the prescribed quantity in all nine categories. The greatest waste occurred with pregabalin (74.8%), followed by fentanyl (70.1%) and morphine (68.4%) (). Morphine was found to have the greatest average prescribed quantity at 85 units per prescription, followed by tramadol at 62 units and carisoprodol at 59 units. Although fentanyl had the lowest quantity, 10 patches per prescription, this represents a 30-day supply as each patch delivers medication over a 3-day period. This differs from most medications, in which one unit represents one dose.
Table 1. Controlled prescription medication waste and state variation summary, 2011–2015.
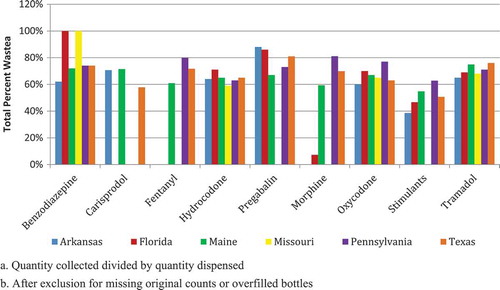
When medication category was assessed by state, oxycodone collection was highest in Arkansas, Florida, and Maine, while hydrocodone was highest in Missouri, Pennsylvania and Texas (). In five of the six states, collection of benzodiazepines ranked second or third, followed by tramadol. In Arkansas, the collection of stimulants ranked higher than tramadol. When geographic location was considered, medication waste exceeded 50% for most controlled prescription medication categories. Medications with high addiction potential, including oxycodone, hydrocodone, benzodiazepines, and tramadol, had waste rates of approximately 60%, which was similar across the studied states ().
Table 2. Top five controlled prescription medication categories collected by state, 2011–2015.
Figure 5. Controlled prescription medication wastea collected by state, 2011–2015.
Discussion
While the DEA’s National Medication Take Back Days have been successful in collecting and disposing of unused medications, no data, beyond the weight of collected medications, has been collected. In fact, very little information regarding unused medications within homes is available locally or nationally. Existing literature reports information regarding single location take back events and/or single state data. Our paper expands the current knowledge by summarizing data collected from a multi-state, multi-event initiative over a five-year period.
Limited existing literature consistently indicates that opioids are being collected in significant quantities (Ma et al., Citation2014; Stewart et al., Citation2015; Welham et al., Citation2015) and that less than 50% of prescribed controlled substances are consumed (Stewart et al., Citation2015; Welham et al., Citation2015), but the extent of this occurrence and geographical variations has not been documented. The lack of significant variation in waste between the six states and consistencies with previous published information indicate that controlled substance waste is extensive and widespread. Also, the medications reported are consistent with those most commonly abused and linked to drug overdoses. These findings are important because home medicine cabinets are frequently the source for prescription medications that ultimately are abused, serving as a gateway to injectable drug use, or taken in an overdose setting.
Unused controlled prescription medications may result from prescribing behaviors that lead to a lack of patient understanding, appropriate use, excess tablets or refills. Our findings suggest that providers should remain aware of these patterns and prescribe the minimum quantity of tablets and refills that are anticipated for patient care. Limiting quantity and refills for prescriptions may reduce the accumulation of unused medications in the community. In addition, increasing patient-provider communication and interaction for refills may be useful in improving therapeutic response and adherence to therapy (Paterson & Anderson, Citation2002).
Significant portions of controlled substances remain unused. This information should be considered as prescriptions are prepared. As indicated in previous studies (Harris et al., Citation2013; Rodgers et al., Citation2012; Bates et al., Citation2011) and supported by this paper, patients undergoing minor surgical procedures are unlikely to consume more than 15 doses of prescribed analgesic and, in many cases, consume fewer than five (Rodgers et al., Citation2012). Depending on the procedure and the likelihood of prolonged pain, consideration to prescribing no more than 15 doses, with or without the option for a refill, may be a reasonable approach. Limiting the quantity of controlled prescription medications may be especially important for patients starting new medications, with unknown response, and to promote adequate patient follow-up. Improved provider adherence to treatment guidelines in prescribing and managing the use of controlled medications will be important as the overuse of these medications has been reported and well documented (Centers for Disease Control and Prevention website, 2016a; Centers for Disease Control and Prevention (MMWR), 2010). More efforts geared toward prevention should be developed, such as provider educational campaigns to impact prescribing patterns, community educational campaigns to create awareness of the risks associated with the accumulation of medications, and prescription limitations on controlled substances for acute pain.
The rationale for prescribing specific quantities of analgesics deserves further exploration. With increasing pressure to “make patients happy” and patient satisfaction now factoring into reimbursement practices, prescribers may feel pressured to prescribe medications regardless of medical necessity. With patients that have a substance use disorder, this may literally be a deadly practice. Closer scrutiny into the role of patient satisfaction scores on reimbursement should be applied, particularly in the setting of pain management to ensure proper pain control while minimizing overprescribing.
From the patient side, the principle of moral hazard should be considered. Consumers want value. If a prescription for 30 tablets is provided and insurance will pay for 30 tablets, the consumer is likely to request that amount; regardless of whether or not the medication will be fully consumed. Unfortunately, this practice results in the accumulation of medications within homes; providing ready access for those looking for drugs of abuse or simply wanting to experiment. These medications may also serve as a source for unintentional poisonings. This too, can be deadly. Both prescribers and third party payers should step up and begin evaluating how this practice can be deterred. Prescribing and reimbursing for only a limited supply of analgesic for acute illnesses or minor surgical or dental procedures may be of benefit in reducing the accumulation of unused analgesics in the home. As indicated in other studies, rarely is more than seven days of medication required (CDC Guideline for Prescribing Opioids, Citation2016). Overall, the current efforts at curbing the prescription abuse epidemic are more reactive than proactive. More efforts geared toward prevention should be developed.
Several limitations should be noted when considering these study results. These findings are not indicative of medication accumulation for the general population. Study participants voluntarily brought unused medications to the collection events. Consumers utilizing all medications prescribed or disposing of excess medications by other means, would not have a need for disposal and, therefore were unlikely to participate. The characteristics of these individuals may differ from study participants. Also, this study cannot account for individuals who may be “saving” unutilized prescriptions for future use or those given to family members or friends; nor can this paper account for those who may be diverting unutilized medications.
While some participating organizations did conduct surveys of participants, this was not part of the current study and those findings are not reported in this paper. Therefore, the rationale for medication disposal by participants is not detailed in this paper. Some medications may have remained unused as a result of patient death, intolerable side effects, or allergic reactions.
Although results for the six states were found to be relatively similar, geographical variations are noted. Additionally, reimbursement patterns and prescribing practices vary from state to state and are likely to contribute to these variations. Controlled substance classification is variable between states and changes that occurred during the study period may have affected results. One such change that may have impacted this study was the classification of tramadol. At study initiation, the only participating state in which tramadol was classified as a controlled substance was Arkansas. In August of 2014, tramadol was reclassified nationwide as a controlled substance. Although study investigators were able to include tramadol data throughout the study period, the re-classification of this medication may have resulted in changes in prescribing practices. Also, hydrocodone products were re-classified as Schedule II in October 2014 requiring more rigorous procedures for prescribing and dispensing. This potentially impacted prescribing practices as well.
Conclusions
Significant quantities of controlled prescription medications were returned over the five-year study period indicating that many patients are prescribed quantities significantly greater than what they use. Further research surrounding consumer practices and utilization of controlled substances post-dispensing is warranted, both to reveal problematic medications and to monitor the effect of prescription abuse prevention efforts.
The prescription abuse epidemic is multifactorial and addressing this crisis will require not only the education of prescribers, but also consumers. A public education campaign discouraging consumers from obtaining medications in large quantities and encouraging proper disposal may be helpful. In many cases, consumers are unaware that they should dispose of unused medications and the lack of proper education regarding disposal perpetuates this issue. This is an immense problem as previous research shows that friends and family are the most common sources of illegally obtained medication. Educating consumers about the dangers of leaving unused prescription opioids in the home should be stressed and discussed both by prescribers and pharmacists.
All aspects of controlled substance supply and demand must be scrutinized; including prescribing and dispensing practices, reimbursement, utilization, disposal and diversion of these medications. At the same time, ensuring adequate patient care and pain control must be taken into consideration, so that those who require these medications are not adversely affected. Next steps may include prescription limitations. Limitations such as 7-day or 15-day supply of controlled prescription medications for acute pain and a 30-day limit for chronic pain have been proposed. These prescription limitations would ensure that patients taking these medications for the first time are not provided a large quantity when they may experience adverse effects. It may also ensure that patients are receiving more frequent follow-up care. Another important step includes educating consumers about the dangers of leaving unused controlled prescription medication in the home. This should be stressed by prescribers and pharmacists.
Also, there is a need to understand why over-prescribing occurs. Prescribers who are cost-conscious may be prescribing more than is needed so that additional costs (e.g. additional co-pays) related to refills are avoided. Prescribers may be trying to avoid inconvenience or therapeutic interruptions that may occur when patients’ medication supplies are depleted over a weekend or after clinic hours. Our proposed next steps and a better understanding of these, and additional factors, will assist in addressing this problem while ensuring optimal patient care.
References
- Bates, C., Laciak, R., Southwick, A, & Bishoff, J. (2011). Overprescription of postoperative narcotics: A look at postoperative pain medication delivery, consumption and disposal in urological practice. Journal of Urology, 185, 551–555.
- Centers for Disease Control and Prevention. (2010). Adult use of prescription opioid pain medications - Utah, 2008. Morbidity and Mortality Weekly Report 59(6), 153e157.
- Centers for Disease Control and Prevention. Injury prevention and control: Prescription drug overdose. Retrieved March 11, 2016 from http://www.cdc.gov/drugoverdose/data/overdose.html.
- CDC Guideline for Prescribing Opioids for Chronic Pain. (Injury Prevention & Control: Prescription Drug Overdose. Centers for Disease Control and Prevention. Retrieved September 24, 2016 from http://www.cdc.gov/mmwr/volumes/65/rr/rr6501e1.htm)
- CDC Vital Signs. (2014). Opioid painkiller prescribing. Atlanta, GA: CDC Vital Signs. Centers for Disease Control and Prevention. (Retrieved December 29, 2015, from http://www.cdc.gov/vitalsigns/opioid-prescribing/)
- Dart, R. C., Surratt, H. L., & Cicero, T. J., et al. (2015). Trends in opioid abuse and mortality in the United States. The New England Journal of Medicine 372(3), 241–248.
- DEA announces “360 Strategy” to address heroin, prescription drugs and violent crime. Washington, D.C.: United States Drug Enforcement Administration, 2015. Retrieved December 28, 2015 from http://www.dea.gov/divisions/hq/2015/hq111015.shtml.
- Drug Abuse Warning Network (2011). National estimates of drug-related emergency department visits. Rockville, MD: Substance Abuse and Mental Health Services Administration, 2013. (HHS Publication No. (SMA) 13-4760, DAWN Series D-39.) Retrieved November 28, 2015 from http://www.samhsa.gov/data/sites/default/files/DAWN2k11ED/DAWN2k11ED/DAWN2k11ED.pdf)
- Jones, C.M. (2013). Heroin use and heroin use risk behaviors among nonmedical users of prescription opioid pain relievers – United States, 2002–2004 and 2008–2010. Drug Alcohol Dependence 132(1–2), 95–100. doi:10.1016/j.drugalcdep.2013.01.007.
- Harris K., Curtis J., Larsen B., et al. (2013). Opioid pain medication use after dermatologic surgery: A prospective observational study of 212 dermatologic surgery patients. JAMA Dermatology 149(3), 317–321.
- Lankenau, S. E., Teti, M., Silva, K., Bloom, J. J., Harocopos, A., & Treese, M. (2012). Initiation into prescription opioid misuse amongst young injection drug users. International Journal of Drug Policy 23(1), 37–44.
- Ma, C. S., Batz, F., Juarez, D. T., & Ladao, L. C. (2014). Drug take back in Hawaii: Partnership between the University of Hawaii Hilo College of Pharmacy and the Narcotics Enforcement Division. Hawaii Journal of Medicine & Public Health 73(1), 26–31.
- NSDUH Series H-48. (2014). Results from the 2013 National Survey on Drug Use and Health: Summary of National Findings. Rockville, MD: Substance Abuse and Mental Health Services Administration. (NSDUH Series H-48, HHS Publication No. (SMA) 14-4863.) ( Retrieved November 28, 2015 from http://www.samhsa.gov/data/sites/default/files/NSDUHresultsPDFWHTML2013/Web/NSDUHresults2013.pdf)
- Paterson, J. M., & Anderson, G. M. (2002). “Trial” prescriptions to reduce drug wastage: Results from Canadian programs and a community demonstration project. American Journal of Managed Care 8(2), 151e158.
- Paulozzi, L. J., Jones, C. M., Mack, K. A., Rudd, R. A. (2011). Vital Signs: Overdoses of prescription opioid pain relievers – United States, 1999–2008. Morbidity and Mortality Weekly Report. 60(43), 1487–1492. (Retrieved November 28, 2015 from http://www.cdc.gov/mmwr/pdf/wk/mm6043.pdf.)
- Perry, L. A., Shinn, B. W., & Stanovich, J. (2014). Quantification of ongoing community-based medication take-back program. Journal of the American Pharmacists Association 54, 275–279.
- Pollini, R. A., Banta-Green, C. J., Cuevas-Mota, J., Metzner, M., Teshale, E., & Garfein, R. S. (2011). Problematic use of prescription-type opioids prior to heroin use among young heroin injectors. Substance Abuse and Rehabilitation 2(1), 173–180.
- Rodgers, J., Cunningham, K., Fitzgerald, K., & Finnerty, E. (2012). Opioid consumption following outpatient upper extremity surgery. Journal of Hand Surgery, 37A, 645–650.
- Rudd, R. A., Aleshire, N., Zibbell, J. E., & Gladden, R. (2016). Increases in drug and opioid overdose deaths – United 277 States, 2000–2014. Morbidity and Mortality Weekly Report, 64(50), 1378–1382.
- Stewart, H., Malinowski, A., Ochs, L., Jaramillo, J., McCall, III K. & Sullivan, M. (2015). Inside Maine’s medicine cabinet: findings from the Drug Enforcement Administration’s medication take-back events. American Public Health Association 105(1), e65–e71.
- Tanabe, P., Paice, J. A., Stancati, J., & Fleming, M. (2012). How do emergency department patients store and dispose of opioids after discharge? A pilot study. Journal of Emergency Nursing 38, 273–279.
- The DAWN report: Highlights of the 2011 Drug Abuse Warning Network (DAWN) findings on drug-related emergency department visits. Substance Abuse and Mental Health Services Administration, Center for Behavioral Health Statistics and Quality, February 22, 2013. Rockville, MD. ( Retrieved November 28, 2015 from http://archive.samhsa.gov/data/2k13/DAWN127/sr127-DAWN-highlights.pdf.
- US DEA and partners collect 309 tons of pills on ninth prescription take-back day. (2014). United States Drug Enforcement Administration Headquarter News (Retrived December 28, 2015 from http://www.dea.gov/divisions/hq/2014/hq110514.shtml.
- Warner, M., Chen, L. H., Makuc, D. M., Anderson, R. N., & Minino, A. M. (2011). Drug poisoning deaths in United States, 1980-2008. NCHS data brief, no 81. Hyattsville, MD: National Center for Health Statistics. (Accessed November 28, 2015 at http://www.cdc.gov/nchs/data/databriefs/db81.pdf.
- Warner, M., Hedegaard, H., & Chen, L. H. Trends in drug-poisoning deaths involving opioid analgesics and heroin: United States, 1999–2012. Hyattsville, MD: NCHS Health eStat. National Center for Health Statistics. Retrieved November 28, 2015, from http://www.cdc.gov/nchs/data/hestat/drug_poisoning/drug_poisoning_deaths_1999-2012.pdf
- Welham, G. C., Mount, J. K., & Gilson, A. M. (2015). Type and frequency of opioid pain medications returned for disposal. Drugs: Real World Outcomes 2, 129–135.
- White House Fact Sheet. (2015). Obama Administration announces public and private sector efforts to address prescription drug abuse and heroin use. Washington, D.C.: The White House. Retrived December 28, 2015 from https://www.whitehouse.gov/the-press-office/2015/10/21/fact-sheet-obama-administration-announces-public-and-private-sector.