
ABSTRACT
Objective
This study aimed to estimate the prevalence of substance use in the Norwegian general population and examine whether the risk of various psychiatric or somatic diseases varied according to alcohol- and substance use.
Methods
A survey was distributed to 5500 persons in Norway, and a sample of 1792 persons responded (36% response rate). Data concerned with the use of substances were cross-tabulated with disease occurrence, and relative ratios (RR) of diseases in groups of lifetime substance users versus abstainers/low frequent users were calculated.
Results
Lifetime prevalence estimates were 83.5% for alcohol, 7.9% for cannabis, 8.5% for sedatives, 33.8% for strong analgesics and 2.4% for opioids and for stimulants. Drinking alcohol weekly or daily was associated with lower risk of several diseases, whereas lifetime use of sedatives, strong analgesics and opioids was associated with higher risk. Lifetime use of cannabis was associated with higher risk of depression and lower risk of diabetes and arthrosis.
Conclusions
While frequent alcohol use was associated with reduced risk of several diseases, lifetime use of other substances was generally associated with higher risk of disease. The study provides evidence of increased risk of disease among users of illicit substances and prescription drugs.
Abbreviations: NORPOP: The Norwegian Population Study; OR: Odds ratio; RR: Relative risk; SES: Socioeconomic status
Introduction
Alcohol is commonly used in most countries throughout the world, including Norway, where the recorded alcohol sales increased sharply between 1993 and 2008 (Norwegian Institute of Public Health, Citation2018; Rossow, Citation2010). Since 2008, the total annual alcohol sales have stabilized at 6.0–6.7 liters of pure alcohol per adult inhabitant (Norwegian Institute of Public Health, Citation2018). In 2016, a national survey found that 82% of the Norwegian adult population had used alcohol during the last year, with a higher proportion of users among men (86%) compared to women (77%) (Skretting et al., Citation2016). Thirty-six percent reported drinking alcohol during the last week (Skretting et al., Citation2016).
The harmful consequences of alcohol use are well known. From a global perspective, alcohol was in 2016 considered the seventh leading risk factor for both death and disability (Griswold et al., Citation2018). Although some studies have provided evidence of positive cardiovascular effects (Ronksley et al., Citation2011), alcohol use has largely been linked with a wide range of diseases, such as tuberculosis, cancer, diabetes, psychiatric disorders, infectious disease, cardiovascular disease, liver and pancreas disease, epilepsy and also with unintentional and intentional injury (Briasoulis et al., Citation2012; Parry et al., Citation2011; Rehm, Citation2011; Rehm et al., Citation2010; Shield et al., Citation2014).
Substances other than alcohol may be classified as cannabis, sedatives, analgesics, opioids and stimulants. Compared to alcohol, the use of such substances is illicit in Norway unless used in a medical context. The illicit status of the substances, in combination with public knowledge and perceptions of their adverse effects, most likely accounts for their less frequent use (Degenhardt & Hall, Citation2012; Skretting et al., Citation2016). Substances such as opioids, sedatives and strong analgesics are prescription drugs with a high potential for habituation, addiction, illicit use and related risks (e.g., Fischer & Argento, Citation2012). In Western and Central European countries, the prevalence of substance use during the last year has been estimated to 7% for cannabis, 0.3%-0.4% for opioids, 0.7% for amphetamines and 1.2%-1.3% for cocaine (Degenhardt & Hall, Citation2012).
Illicit substance use has been strongly associated with depression, anxiety and alcohol use (Lai et al., Citation2015). Adverse health effects of cannabis use have been identified both in the short term and long term (Volkow et al., Citation2014). Short-term effects include impaired memory and motor functioning, reduced judgment, and in high doses, paranoia and psychosis. Long-term or heavy use effects include addiction (9% of users overall), altered brain development, cognitive impairments, poor educational outcomes, chronic bronchitis and reduced life satisfaction (Volkow et al., Citation2014). Recurrent cannabis use has also been associated with higher risk of using additional substances (Erevik et al., Citation2017).
Cannabis use most likely also increases the risk of chronic psychotic disorders and other mental disorders such as depression and anxiety, but contributes little to mortality (Degenhardt & Hall, Citation2012; Volkow et al., Citation2014). In contrast, use of opioids and stimulants contributes substantially toward increased mortality (Degenhardt, Bucello et al., Citation2011; Degenhardt, Singleton et al., Citation2011; Singleton et al., Citation2009), and in Norway, heroin injection is assumed to be involved in about 90% of all drug-related deaths (Steentoft et al., Citation2001). These substances all increase the risk of cardiovascular disease and mental disorders, while their associations with other diseases have been ambiguous or based on low-quality evidence (Degenhardt & Hall, Citation2012).
As sedatives and analgesics are commonly used prescription drugs, they appear to be often left out from studies concerned with substance use. However, there is evidence of more use of both hypnotics and stimulants among persons with chronic insomnia, compared to those with normal sleep (Taylor et al., Citation2013). In a Norwegian study, the use of strong analgesics had a one-year prevalence of 8.3%, with excessive use indicative of substance use problems found among 0.5% (Fredheim et al., Citation2009). Although the literature generally suggests that substance use is linked with a range of physical and mental diseases, most studies appear to be concerned with associating specific exposures with specific outcomes. The current study seeks to provide a more comprehensive overview of how the use of different types of substances is related to a range of diseases. Thus, this study investigated the prevalence of substance use in the Norwegian general population, and whether the risk of diseases varied according to substance use.
Materials and methods
Study design and ethics
The Norwegian Population Study (NorPop) is a cross-sectional survey. The collected data reflect a variety of health conditions in the general population and will provide national norm scores related to several questionnaires used for assessing symptoms, attitudes and behavior. No identifying information was collected. Those who provided informed consent to participate completed the questionnaires and returned them to the researchers in a sealed envelope. The regional ethics committee was consulted and, as only anonymous data were collected, no formal ethical approval was required.
Sample selection
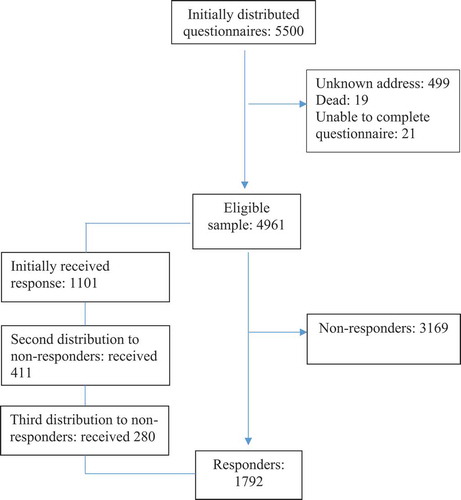
The National Population Register selected a random sample of adult persons (≥18 years of age), stratified by age, gender and geographic region, for possible inclusion in the study. The survey was sent by mail to the 5500 selected persons along with a letter explaining the study purpose. All data were collected in 2015 and 2016, and displays the recruitment and inclusion process.
Figure 1. Flowchart showing the inclusion of the participants
Measures
Sociodemographic background
Data regarding age, sex, education and employment status were collected. Formal education was dichotomized into 12 years’ education or less (representing high school or less education) versus more than 12 years’ education (representing some level of higher education). Employment status was similarly dichotomized into not working versus working. The latter category included persons being employed with paid work or undergoing education, while the former category included persons who were retired, unemployed, doing full-time housework, or receiving disability benefits.
Substance use
To assess substance use, the participants were asked: “Below is a list of pharmaceuticals and addictive drugs. Have you used any of these?” The list contained alcohol, cannabis (e.g., hashish, marihuana), sedatives (e.g., valium), strong analgesics (e.g., paralgin forte), opioids (e.g., morphine, heroin) and stimulants (e.g., cocaine, amphetamine). For each substance, the participants were asked to indicate how frequently (never, sometimes, weekly, or daily) they used it. The use of each substance was subsequently dichotomized as “non-use” (never) versus “use” (sometimes, weekly, daily). However, alcohol was dichotomized as low-frequent (never or sometimes use) versus high-frequent use (weekly or daily).
Diseases and mental health problems
In the present study, we used the phrase: “Below you will find listed some diseases. Do you have, or have you had, any of these diseases?” The list contained heart disease, stroke, respiratory disease, diabetes, cancer, osteoporosis, fibromyalgia, arthritis, arthrosis, prolonged musculoskeletal disease, gastrointestinal disease, tinnitus and chronic pain. In addition, we asked: “Below you will find listed some mental health problems. Do you have, or have you had, any of these problems?” This list contained anxiety, depression, insomnia and eating disorder. For all listed diseases and mental health problems, the response alternatives were “no,” “yes previously, but not during the last month” and “yes, during the last month.” Participants with self-reported diseases and mental health problems during the last month were classified as case.
Statistical analyses
Data were analyzed using SPSS for Windows, version 24. Initial descriptive analyses employed frequencies and percentages for categorical variables (education, employment, substance use, diseases and mental health problems), and means and standard deviations for continuous variables (age). Missing values in the analyses were managed with the casewise deletion procedure, resulting in n varying between analyses. The chi-square test was used to assess whether the frequency of diseases and mental health problems were significantly different between users and nonusers of each substance. For alcohol, the comparison was performed between participants with lower-frequency and higher-frequency alcohol use. Relative risk (RR) was calculated using the 2 × 2 contingency table. Post-hoc analyses were performed with logistic regression models, using disease as dependent variable and substance (cannabis and any substance excepting alcohol), age and sex as independent variables. Odds ratio (OR) was used as effect size in the logistic regression analyses. For all analyses, the level of significance was set at p < .05.
Results
Sample
Altogether, 1792 persons (36.0% response rate) participated in the study. The gender proportions were similar (53.1% women, 46.9% men). More than half of the sample had at least 12 years of education, and more than 60% were employed. Male participants were older than women, and compared to men, a larger proportion of women were employed or undergoing education. The sample characteristics are displayed in .
Table 1. Sociodemographic characteristics
Substance use
The use of substances in the sample is shown in . The prevalence for lifetime alcohol use was 83.5%, and alcohol was by far the most frequently used substance with more than one in three using it on a weekly basis. A substantial proportion (30%) reported to have used strong analgesics ‘sometimes.’ Cannabis and sedatives had been used ‘sometimes’ by 7% of the sample, whereas weekly or daily use of all substances except alcohol was reported by small proportions (0–2%).
Table 2. Use of substances
Substance use within disease groups
display categories of alcohol use within each of the disease groups. Compared to their counterparts, those with a higher drinking frequency had lower relative risk of pulmonary disease, fibromyalgia, arthritis, musculoskeletal disease and chronic pain.
Table 3. Use of alcohol within disease groups
Use of cannabis was associated with lower relative risk of diabetes (p < .05, RR: 0.16) and arthrosis (p < .01, RR: 0.39), but with a higher risk of depression (p < .05, RR: 1.79). Use of stimulants was associated with higher relative risk of pulmonary disease (p < .05, RR: 2.89) and anxiety (p < .01, RR: 2.77).
displays the use of sedatives in relation to each of the disease groups. Compared to their counterparts, those who sometimes or more frequently used sedatives had higher relative risk of fibromyalgia, arthritis, arthrosis, musculoskeletal disease, gastrointestinal disease and chronic pain. They also had higher relative risk of all listed mental health problems; anxiety, depression, insomnia and eating disorder.
Table 4. Use of sedatives within disease groups
displays the use of strong analgesics within each of the disease groups. Compared to their counterparts, those who sometimes (or more frequently) used strong analgesics had higher relative risk of pulmonary disease, cancer, osteoporosis, fibromyalgia, arthritis, arthrosis, musculoskeletal disease, gastrointestinal disease, tinnitus and chronic pain. They also had higher relative risk of depression and insomnia.
Table 5. Use of strong analgesics within disease groups
The use of opioids, sometimes or more frequently, was associated with higher relative risk of pulmonary disease (p < .05, RR: 2.74), diabetes (p < .05, RR: 2.67), cancer (p < .05, RR: 4.69), arthrosis (p < .01, RR: 2.79), musculoskeletal disease (p < .01, RR: 3.31), gastrointestinal disease (p < .01, RR: 3.02), tinnitus (p < .05, RR: 2.20) and chronic pain (p < .001, RR: 4.50). Opioid use was also associated with higher relative risk of insomnia (p < .01, RR: 2.59) and eating disorder (p < .01, RR: 4.77).
Post hoc analyses
The associations between lifetime cannabis use and the occurrence of diabetes and arthrosis were further scrutinized in post-hoc logistic regression analyses. In the unadjusted model, lifetime use of cannabis was borderline associated with lower odds of diabetes (OR: 0.15, p = .06). Adjusting by age and sex, the negative association between cannabis use and diabetes was weakened (OR: 0.30, p = .24), while higher age (OR: 1.05, p < .001) and male sex (OR: 0.45, p < .01) were significantly associated with diabetes.
Similarly, lifetime use of cannabis was associated with lower odds of arthrosis (OR: 0.37, p < .05) in the unadjusted model. Adjusting by age and sex, the association between cannabis use and arthrosis vanished (OR: 1.05, p = .91), while higher age (OR: 1.06, p < .001) and female sex (OR: 1.95, p < .001) were significantly associated with arthrosis.
Further, we examined associations between using any or several of the included substances (except alcohol) and diseases, while adjusting by age and sex. Even after adjustment, lifetime use of one or several substances was significantly associated with higher odds of most listed diseases (pulmonary disease OR: 1.86, p < .01; cancer OR: 2.54, p < .05; fibromyalgia OR: 2.75, p < .001; arthritis OR: 2.36, p < .01; arthrosis OR: 2.22, p < .001; musculo-skeletal disease OR: 2.18, p < .001; gastrointestinal disease OR: 1.43, p < .05; tinnitus OR: 1.41, p < .05; chronic pain OR: 2.28, p < .001; anxiety OR: 1.84, p < .01; depression OR: 2.16, p < .001; insomnia OR: 2.03, p < .001; eating disorder OR: 2.63, p < .01).
Discussion
This study showed that more than one in three reported drinking alcohol on a weekly or daily basis, while a similar proportion reported sometimes using strong analgesics. Illicit substances, such as opioids, stimulants and cannabis, were rarely used. While weekly use of alcohol was associated with lower prevalence for several diseases, the use of sedatives, stimulants, strong analgesics and opioids was all associated with a variety of mental and somatic diseases. Cannabis use was ambiguously associated with poorer health.
The prevalence estimates of lifetime (83.5%) and weekly (34.0%) alcohol use were similar to the results of previous research on the Norwegian population (82% and 36%, respectively; Skretting et al., Citation2016), cross-validating the results across studies and also providing credibility to the survey methodology of obtaining data related to alcohol use. In contrast to the general picture of alcohol contributing to mortality and disability (Griswold et al., Citation2018) and a range of diseases (e.g., Parry et al., Citation2011; Rehm, Citation2011; Rehm et al., Citation2010; Shield et al., Citation2014), this study showed that weekly (or more frequent) alcohol use was associated with lower relative risk of co-occurring pulmonary disease, fibromyalgia, arthritis, musculoskeletal disease and chronic pain. The association may simply convey that healthy people drink alcohol more often, compared to those who are ill. However, people who drink alcohol more often may also be considered a group of affluence and resources, given the relatively high prices on alcoholic beverages in Norway (Rossow, Citation2010). Thus, the detected association may also illustrate that while persons with high socioeconomic status (SES) tend to drink more than those with lower SES, their higher level of drinking is related to a generally healthier lifestyle. This explanation would fit with the ‘alcohol harm paradox,’ essentially expressing that while those with higher SES drink more than those with lower SES, the latter group experiences more negative outcomes related to alcohol use (Collins, Citation2016), as also demonstrated in a Norwegian study of alcohol use in adolescents from more and less affluent districts in the Norwegian capital city of Oslo (Pedersen et al., Citation2015). However, while weekly drinking was associated with less health problems, daily drinking may be associated with more health problems. A recent study showed that those with the most frequent drinking pattern (daily alcohol intake) had higher risk of experiencing psychological distress, compared to those with a less frequent drinking pattern (Bonsaksen et al., Citation2020).
The lifetime prevalence of cannabis use (7.9%) was fairly similar to the previous 12-month prevalence estimate for West and Central Europe (7.1%; Degenhardt & Hall, Citation2012), and lower than the 12-month prevalence in North America (10.7%-13.2%; Azofeifa et al., Citation2016; Volkow et al., Citation2014), illustrating that cannabis use is still less frequently used in Norway, compared to other countries and regions. A higher risk of depression among cannabis users relative to abstainers is in line with previous research results (Degenhardt & Hall, Citation2012; Lai et al., Citation2015; Volkow et al., Citation2014), while the lower relative risk for diabetes and arthrosis appears to illustrate an effect of age. Cannabis is more often used in the younger age groups (Skretting et al., Citation2016), while the onset of diabetes II (accounting for approximately 90% of diabetes cases) and arthrosis is usually later in life. The post hoc analyses supported this assumption.
The lifetime prevalence estimates for use opioids and stimulants (both 2.4%) were higher than global estimates of 0.5%-1.5% (Degenhardt & Hall, Citation2012). The higher estimate for opioid use in the current study may be explained by different methodologies, including its outreach to potential participants. The postal survey format is likely to better reach the general population, whose opioid use would likely be linked to medical treatments for serious disease, compared to persons with current or previous heroin/morphine use. Studies of substance use targeting the latter group would rather employ a variety of procedures for sample recruitment (Subbaraman et al., Citation2015).
The study showed that only 22 persons (1.3%) used sedatives weekly or daily. This is a lower estimate than from the wholesale pharmaceutical sales report in 2000, suggesting that 5.1% of the Norwegian population used sedatives/hypnotics daily (Dommerud, Citation2001). Evidence suggests that the use of sedatives has in fact decreased markedly in the Norwegian population during the last decades. Between 2009 and 2018, the distribution of sedatives decreased by 29% (Sakshaug et al., Citation2019). Melatonin has become the preferred medication for sleep problems, and almost tripled the sales during the same period (Sakshaug et al., Citation2019).
This study demonstrates that the risk of having a wide range of diseases is higher among persons who have used sedatives, strong analgesics and/or opioids. Obviously, these substances are commonly employed pharmaceuticals for a range of diseases, including cancer and chronic pain. However, substance use outside the medical context may be considered ‘risk-taking,’ such that accidents and injuries caused by substance use in turn can cause disease and even death, for example, as seen among injecting heroin users (Steentoft et al., Citation2001).
Study limitations
Clearly one must be careful when considering possible causality between substance use and the occurrence of diseases. While substances such as alcohol may cause disease directly, as argued in a range of studies (Briasoulis et al., Citation2012; Parry et al., Citation2011; Rehm, Citation2011; Rehm et al., Citation2010; Shield et al., Citation2014), disease processes may also make people more prone to use substances in an attempt to gain comfort, distraction and relief from physical or psychological pain. Indeed, some of the substances investigated in this study are commonly prescribed drugs for therapeutic use among persons with diseases, rendering causes and effects intertwined. Moreover, cultural and socioeconomic factors impossible to control may constitute common risk factors for substance use and adverse health outcomes alike.
There is no way of controlling the accuracy or truthfulness of the participants’ responses. Thus, participants may have underestimated (deliberately or not) their use of alcohol and other substances. In addition, persons with heavy substance misuse are less inclined to respond to postal surveys, for some due to a lack of a permanent home address. However, similar results compared to those obtained by Skretting et al. (Citation2016) support their validity. There is no standard procedure for reporting patterns of alcohol use (Rehm et al., Citation2003), and methods for estimating alcohol consumption have been found to vary widely between countries (Knibbe & Bloomfield, Citation2001). There is good reason to suggest the same would be the case for the study and reporting of substance use.
Relatively few persons reported having the various listed diseases and breaking up the numbers into groups of users and abstainers for each disease groups led to small group sizes to be analyzed. For this reason, we were largely unable to adjust the analyses by other variables that might add to our understanding of the associations between the use of specific substances and the occurrence of diseases. However, as shown in the post-hoc analysis, lifetime use of one or several substances (excluding alcohol) was significantly related to the presence of most diseases, even after adjusting for age and sex.
Conclusion
Using data from a sample representative of the Norwegian general population, the study showed the lifetime prevalence for use of alcohol (83.5%), cannabis (7.9%), sedatives (8.5%), strong analgesics (33.8%), opioids (2.4%) and stimulants (2.4%). While using alcohol on a weekly or daily basis was associated with lower risk of several diseases, relative to those with less frequent use, lifetime use of sedatives, strong analgesics and opioids was associated with higher relative risk for a wide range of diseases. While the results to a degree may reflect substance use in the context of treatment or self-treatment, the study has demonstrated that the use of illicit and/or prescription substances is more frequent among persons with health problems. Persons with diseases use more of different types of drugs and pharmaceuticals than healthy persons.
Author contributions
ISB designed the study. The whole research group contributed to the collection of data. TB performed the statistical analyses and drafted the manuscript. All authors read and approved the final manuscript.
Availability of data and materials
The datasets used and/or analyzed during the current study are available from the corresponding author on reasonable request.
Acknowledgments
The authors thank the study participants.
Disclosure statement
The authors declare that they have no competing interests.
Additional information
Funding
References
- Azofeifa, A., Mattson, M. E., Schauer, G., McAfee, T., Grant, A., & Lyerla, R. (2016). National estimates of marijuana use and related indicators - National Survey on Drug Use and Health, United States, 2002–2014. Morbidity and Mortality Weekly Report: Surveillance Summaries, 65(11), 1–25. https://www.cdc.gov/mmwr/volumes/65/ss/ss6511a1.htm
- Bonsaksen, T., Heir, T., Skogstad, L., Grimholt, T. K., Ekeberg, Ø., Lerdal, A., & Schou-Bredal, I. (2020). Daily use of alcohol in the Norwegian general population: Prevalence and associated factors (in revision). Drugs and Alcohol Today. https://doi.org/10.1108/DAT-02-2020-0010
- Briasoulis, A., Agarwal, V., & Messerli, F. H. (2012). Alcohol consumption and the risk of hypertension in men and women: A systematic review and meta-analysis. Journal of Clinical Hypertension, 14(11), 792–798. https://doi.org/10.1111/jch.12008
- Collins, S. E. (2016). Associations between socioeconomic factors and alcohol outcomes. Alcohol Research, 38(1), 83–94. https://www.ncbi.nlm.nih.gov/pmc/articles/PMC4872618/pdf/arcr-38-1-83.pdf
- Degenhardt, L., Bucello, C., Mathers, B., Briegleb, C., Ali, H., Hickman, M., & McLaren, J. (2011). Mortality among regular or dependent users of heroin and other opioids: A systematic review and meta-analysis of cohort studies. Addiction, 106(1), 32–51. https://doi.org/10.1111/j.1360-0443.2010.03140.x
- Degenhardt, L., & Hall, W. (2012). Extent of illicit drug use and dependence, and their contribution to the global burden of disease. The Lancet, 379(9810), 55–70. https://doi.org/10.1016/S0140-6736(11)61138-0
- Degenhardt, L., Singleton, J., Calabria, B., McLaren, J., Kerr, T., Mehta, S., … Hall, W. D. (2011). Mortality among cocaine users: A systematic review of cohort studies. Drug Adn Alcohol Dependence, 113(2–3), 88–95. https://doi.org/10.1016/j.drugalcdep.2010.07.026
- Dommerud, T. (2001). Norsk pilledryss. Dagens Medisin, 4(5). Accessed from https://www.dagensmedisin.no/artikler/2001/04/05/norsk-pilledryss/
- Erevik, E. K., Torsheim, T., Andreassen, C. S., Vedaa, Ø., & Pallesen, S. (2017). Recurrent cannabis use among Norwegian students: Prevalence, characteristics, and polysubstance use. Nordic Studies on Alcohol and Drugs, 34(6), 497–510. https://doi.org/10.1177/1455072517743427
- Fischer, B., & Argento, E. (2012). Prescription opioid related misuse, harms, diversion and interventions in Canada: A review. Pain Physician, 15(3 Suppl), ES191–203. https://www.painphysicianjournal.com/current/pdf?article=MTcxNg%3D%3D&journal=68
- Fredheim, O. M. S., Skurtveit, S., Moroz, A., Breivik, H., & Borchgrevink, P. C. (2009). Prescription pattern of codeine for non-malignant pain: A pharmacoepidemiological study from the Norwegian Prescription Database. Acta anaesthesiologica Scandinavica, 53(5), 627–633. https://doi.org/10.1111/j.1399-6576.2009.01910.x
- Griswold, M. G., Fullman, N., Hawley, C., Arrian, N., Zimsen, S. R. M., Tymeson, H. D., & Gakidou, E. (2018). Alcohol use and burden for 195 countries and territories, 1990-2016: A systematic analysis for the Global burden of disease study 2016. The Lancet, 392(10152), 1015–1035. https://doi.org/10.1016/S0140-6736(18)31310-2
- Knibbe, R. A., & Bloomfield, K. (2001). Alcohol consumption estimates in surveys in Europe: Comparability and sensitivity for gender differences. Substance Abuse, 22(1), 23–38. https://doi.org/10.1080/08897070109511443
- Lai, H. M. X., Cleary, M., Sitharthan, T., & Hunt, G. E. (2015). Prevalence of comorbid substance use, anxiety and mood disorders in epidemiological surveys, 1990–2014: A systematic review and meta-analysis. Drug and Alcohol Dependence, 154(2015), 1–13. https://doi.org/10.1016/j.drugalcdep.2015.05.031
- Norwegian Institute of Public Health (2018). Alcohol sales in Norway [Alkoholomsetningen i Norge]. Retrieved from https://www.fhi.no/nettpub/alkoholinorge/omsetning-og-bruk/alkoholomsetningen-i-norge/
- Parry, C. D., Patra, J., & Rehm, J. (2011). Alcohol consumption and non‐communicable diseases: Epidemiology and policy implications. Addiction, 106(10), 1718–1724. https://doi.org/10.1111/j.1360-0443.2011.03605.x
- Pedersen, W., Bakken, A., & von Soest, T. (2015). Adolescents from affluent city districts drink more alcohol than others. Addiction, 110(10), 1595–1604. https://doi.org/10.1111/add.13005
- Rehm, J. (2011). The risks associated with alcohol use and alcoholism. Alcohol Research & Health, 34(2), 135. https://www.ncbi.nlm.nih.gov/pmc/articles/PMC3307043/pdf/arh-34-2-135.pdf
- Rehm, J., Baliunas, D., Borges, G. L. G., Graham, K., Irving, H., Kehoe, T., … Taylor, B. (2010). The relation between different dimensions of alcohol consumption and burden of disease: An overview. Addiction, 105(5), 817–843. https://doi.org/10.1111/j.1360-0443.2010.02899.x
- Rehm, J., Room, R., Graham, K., Monteiro, M., Gmel, G., & Sempos, C. T. (2003). The relationship of average volume of alcohol consumption and patterns of drinking to burden of disease: An overview. Addiction, 98(9), 1209–1228. https://doi.org/10.1046/j.1360-0443.2003.00467.x
- Ronksley, P. E., Brien, S. E., Turner, B. J., Mukamal, K. J., & Ghali, W. A. (2011). Association of alcohol consumption with selected cardiovascular disease outcomes: A systematic review and meta-analysis. BMJ, 342, d671. https://doi.org/10.1136/bmj.d671
- Rossow, I. (2010). Challenges in an affluent society: Trends in alcohol consumption, alcohol related harms and alcohol policy: Norway 1990-2010. Nordic Studies on Alcohol and Drugs, 27(5), 449–464. https://doi.org/10.1177/145507251002700509
- Sakshaug, S., Olsen, K., Berg, C., Blix, H. S., Dansie, L. S., Litleskare, I., & Granum, T. (2019). Drug Consumption in Norway 2014–2018. Norwegian Institute of Public Health. Accessed from https://www.fhi.no/globalassets/dokumenterfiler/rapporter/2019/legemiddelforbruket-i-norge-2014-2018.pdf
- Shield, K. D., Parry, C., & Rehm, J. (2014). Chronic diseases and conditions related to alcohol use. Alcohol Research: Current Reviews, 35(2), 155. https://www.ncbi.nlm.nih.gov/pmc/articles/PMC3908707/pdf/arcr-35-2-155.pdf
- Singleton, J., Degenhardt, L., Hall, W., & Zabransky, T. (2009). Mortality among amphetamine users: A systematic review of cohort studies. Drug and Alcohol Dependence, 105(1–2), 1–8. https://doi.org/10.1016/j.drugalcdep.2009.05.028
- Skretting, A., Bye, E. K., Vedøy, T. F., & Lund, K. E. (2016). Substances in Norway 2016 [Rusmidler i Norge 2016]. Retrieved from https://www.fhi.no/publ/2017/rusmidler-i-norge-2016/
- Steentoft, A., Teige, B., Ceder, G., Vuori, E., Kristinsson, J., Simonsen, K. W., … Kaa, E. (2001). Fatal poisoning in drug addicts in the Nordic countries. Forensic Science International, 123(1), 63–69. https://doi.org/10.1016/s0379-0738(01)00524-2
- Subbaraman, M. S., Laudet, A. B., Ritter, L. A., Stunz, A., & Kaskutas, L. A. (2015). Multi-source recruitment strategies for advancing addiction recovery research beyond treated samples. Journal of Community Psychology, 43(5), 560–575. https://doi.org/10.1002/jcop.21702
- Taylor, D. J., Bramoweth, A. D., Grieser, E. A., Tatum, J. I., & Roane, B. M. (2013). Epidemiology of insomnia in college students: Relationship with mental health, quality of life, and substance use difficulties. Behavior Therapy, 44(3), 339–348. https://doi.org/10.1016/j.beth.2012.12.001
- Volkow, N. D., Baler, R. D., Compton, W. M., & Weiss, S. R. B. (2014). Adverse health effects of marijuana use. New England Journal of Medicine, 370(23), 2219–2227. https://doi.org/10.1056/NEJMra1402309