
 ?Mathematical formulae have been encoded as MathML and are displayed in this HTML version using MathJax in order to improve their display. Uncheck the box to turn MathJax off. This feature requires Javascript. Click on a formula to zoom.
ABSTARCT
Since its inception in 1992, the Premier League has faced a number of economic shocks, including a global financial crisis. While there is ample literature on insolvency of football clubs, this does not necessarily help us gauge financial fragility to economic shocks. Clubs’ resilience to shocks is important to our understanding of the Premier League’s ability to grow and outperform other leagues in an increasingly global and competitive industry. Using Annual Reports from 1993 to 2018, this paper analyses the resilience of Premier League clubs to shocks in the wider economy. Results identify the clubs most and least financially resilient. Of the Big Six clubs, only Arsenal is considered as resilient, whilst others show weakness during economic downturns or periods of growth. Measuring economic resilience in this way has implications for our understanding of both the Premier League’s sustainability in its current form and its ability to withstand future shocks.
Introduction
Born at the close of the early 1990s UK recession, since its inception in 1992, the English Premier League (EPL) has faced a number of economic shocks (recession in the wider economy), including the global financial crises and the more recent Covid-19 lockdowns. The league’s resilience as a whole to the first two crises has been an area of much discussion both in academic circles and the media.Footnote1 Despite world economic downturns, the EPL continued to see a rise inspending (see ), as well as an increase in investment by ownersFootnote2 and sponsors.Footnote3 While other industries (such as manufacturing) were struggling for survival, the EPL marched on, seemingly unaffected.Footnote4
The Covid economic crisis has been the first global financial crisis to affect the EPL. Unlike with previous crises, first football’s inability to conduct any of its business (play football) and then to subsequently play behind closed doors has greatly affected revenues. The loss of match day income with no fans in stadiums,Footnote5 the loss of broadcasting revenue,Footnote6 and the need to subsidize clubs and leagues further down the pyramidFootnote7 (both from a commercial standpoint but also because of political pressure),Footnote8 on top of poor finances to start with,Footnote9 have all affected EPL revenue and profits in a way the league has not seen before.
However, even through this time of crisis, where a large number of lower league clubs were facing bankruptcy,Footnote10 the EPL still managed to exceed financial expectations compared to other industries. For example, some EPL clubs were able to take advantage of the financial woes of lower league clubs in the transfer market,Footnote11 investors were still circling,Footnote12 and some clubs made profits in the 2019–20 season while being, at least in part, affected by Covid lockdowns and empty stadiums.Footnote13
Despite this resilience, there are clear differences between clubs themselves in the EPL. The so-called ‘Big Six’ (Arsenal, Chelsea, Liverpool, Manchester City, Manchester United, and Tottenham Hotspur) are thus named as much for their financial clout as their on-pitch success. Portsmouth FC is the only club to go into administration while a member of the EPL (in 2010), but it is not the only club to have had very unhealthy financials during their league membership years (others include Leeds, Blackburn, and Fulham (2002–2007)). This became starkly evident during the Covid crisis, where a number of EPL teams made it clear that they were struggling financially,Footnote14 or acted in a manner that demonstrates that the financial pinch was being felt.Footnote15
So what is it about EPL clubs that allows them to withstand shocks and other economic blows that would bring (and are bringing) other industries to their knees? More importantly, how can we tell which clubs will be better able to withstand current and future economic shocks to allow the EPL to continue as it has for another 30 years? The key to this is economic resilience in its various forms.
This paper’s contribution to knowledge is a look at EPL clubs’economic resilience since EPL formation in 1992. This is, to our knowledge, the first application of economic resilience measures to this context. This paper therefore addresses the first step in the process of understanding how clubs can better withstand and recover from economic shocks. This can then lead onto further research (step 2, outside the scope of this paper) from a sport management perspective on how these economic findings can be applied to enhance financial performance of individual clubs.
The findings of this paper have twofold policy implications: at a club level, and at a Financial Fair Play (FFP) level. At a club level, the findings can enable clubs to compare themselves to their competitors and use the information for planning their way out of recession. At an FFP level, the findings will show club vulnerability and can help inform future changes to the rules.
The literature review covers the football economics, finance, and accounting research, delving into the concept of economic resilience. The data and methods employed are then followed by a discussion of the results of both the quantitative analysis and qualitative discussion, before concluding.
Review of literature
The EPL has long held a fascination for sports economists and finance researchers, especially since UK Company Law requirements make the financial statements of all relevant clubs publicly available (although some submit abbreviated accounts), allowing for in-depth data analysis both within and across decades. Researchers have looked at, amongst other relevant topics, economic competitiveness,Footnote16 financial performance,Footnote17 and comparisons with other less successful leagues.Footnote18 Economic resilience (defined as the ability of an organization to withstand economic shocks by resisting recessions and recovering quickly during economic booms), on the other hand, has seen less in-depth analysis than other areas of football finance.
While some economic literature looks at insolvency of football clubs,Footnote19 this does not necessarily help us gauge resilience of either individual clubs or the league, as only one EPL club has ever become insolvent during its time in the top flight (Portsmouth, as previously noted). Administration and insolvency not only negatively affect the clubs themselves but also have an impact on the wider stakeholder base of clubs.Footnote20
Research on financial distress of EPL clubs within the prism of FFP regulations implemented in 2011 found that financial sustainability of clubs decreased following the implementation of FFP, with the Big Six clubs faring better than the rest of their EPL counterparts.Footnote21 This suggests that profit is not the strongest measure of club contribution to the UK economy, as owners’ intentions around club financial strategy would potentially lead to contributions not being captured as a result of prolonged loss-making. While both UK company law and UEFA require clubs to pronounce on going concern (the idea that a company can continue operating for the foreseeable future and not be required to go into administration or liquidation), studies that use financial statements approved by club directors inevitably assume that the going concern principle is applied, otherwise the accounts would not be prepared in the same manner and would therefore not be comparable to prior years and other clubs. Studies on insolvency of football clubs show a number of predictive variables, including lack of adherence to principles of financial budgeting,Footnote22 debtFootnote23 and proximity to other clubs.Footnote24
Studies often use financial ratio analysis in their attempts to measure financial performance and, by implication, distress.Footnote25 However, the use of trend and ratio analysis to examine the financial performance of clubs in the EPL carries limitations often linked to the depth of the data used,Footnote26 as management accounts (where the breakdown of costs and revenues are detailed) are not available to the public (or researchers).
The importance of accounting elements such as cash flow has been shown to be the predominant cause of insolvency, and is backed by studies using proxies for liquidity (such as the quick or current ratios).Footnote27 Cash flow is not only important for enabling clubs to pay debts but is also important in looking at sustainability. For example, the EPL sees a lower proportion of their income from owners than the lower leagues do,Footnote28 which has implications for financial sustainability driven by both on-field success and brand value alongside investment through ownership.Footnote29
Economic literature tells us how regions react to recessions, and how the concept of resilience can help guard against shocks.Footnote30 Roberts et al.Footnote31 used Swansea City FC, at the time an EPL member, to assess the value of football clubs to regional economies, giving increased visitation, spending, and, by implication, demand for employment. This is in line with findings that regional benefits arise from the existence of football clubs in the local area.Footnote32
However, the gap remains in the area of assessing economic resilience by clubs, which would help to safeguard the future of the EPL so that it retains its dominant position in another 30 years. Therefore, this paper attempts to bridge this gap in knowledge by applying some of the regional resilience economics techniques alongside the accounting and finance components covered in the current literature discussed in this section.
Data
EPL football club financial information between 1992 and 2018 is taken from published accounts available via Companies House. We make use of the dataset developed by Maguireas this provides the needed financial information and we validate this dataset by sample.Footnote33 We focus on only those clubs present in the EPL during the season in question, such that several football clubs such as Blackpool FC appear in the dataset just once. Blackpool joined the EPL for the 2010–2011 season and the corresponding financial information is listed under the year 2011, following the accounts’ year end.
Revenues are split into three broad categories that include income from match day-related activities (ticket sales and hospitality), commercial ventures (such as sponsorship and events hire of stadia), and the sale of broadcast rights distributed to the clubs by The Football Association Premier League Ltd. The cost of staff wages (including players) and the club profit before tax are also used in the following analysis.
It is worth noting two exceptions: information is not present in the financial accounts of Bradford City from 2000 to 2001 and match day revenues are not available for Leeds United during 2003 and 2004. As part of the measurement of resilience, football club financial information is compared to changes in the value of the wider economy, gauged by Gross Value Added (GVA) and company profits, discussed below. We use GVA as this captures all contributions of the club to the economy so, for example, our results are not affected by the owners’ motivation to profit (or not) from the club, as profit is only one aspect (as shown by the differing results between GVA and profit, discussed below).
Gross value added
GVA is a standard measure of contribution of a firm, industry, or region to the overall economy. UK and Services Sector GVA data are taken from the Office for National Statistics,Footnote34 available between 1998 and 2018. Professional sports sit within the industry classification (SIC) 93 entitled ‘Sports, Amusement and recreation activities’ within the ‘Services Sector’.
At company level, value added represents the wealth generated by stakeholders of the company. Namely, the wealth generated for the owners via profit, the government via taxation, and for employees via earned income. As such, we use wages plus profit before taxation as a reasonable approximation of GVA, calculated from the club financial accounts.
Company profit
It is usually sufficient to analyse economic resilience of industry sectors or regions using a comparison to GVA or employment of the wider economy. However, the nature of the sporting contest in the EPL, allowing promotion and relegation, encourages clubs to overexert financial resources in an attempt to win more matches. Therefore, a large number of clubs publish a financial loss on a regular basis and the league as a whole saw profits in only 9 years between 1992 and 2018. As discussed previously, this affects the usefulness of profit as a variable for economic resilience. Company profit can be seen as an ability to raise finance and demonstrates control of costs for long-term health. Moreover, regular losses tend to show that the company might be in need of finance and that this finance is likely more expensive (through higher interest rates).
Information on the profits of UK companies is taken from the Office for National Statistics for 1997 to 2018.Footnote35 We use the net operating surplus (gross operating surplus less capital consumption at current replacement cost) of private corporations (non-UK continental shelf and non-financial) for the UK and the Services Sector.
presents descriptive information of the collected data. Club GVA is the authors’ calculation as noted above. The number of observations vary as the GVA and profit information is available from 1998 to 1997 onwards, respectively. All numbers are presented in £ millions at the nominal value of the respective year.
Table 1. Descriptive information for collected data
Method
To investigate resilience of EPL football clubs to wider economic changes, the analysis is split into two parts. First, a review is conducted of the key financial changes over time within the EPL and the key macroeconomic shocks, using the financial information reported from 1993 to 2018. Second, borrowing from the economic resilience literature, we generate a measure of club resilience by comparing club financial information to that of the Services Sector and the UK economy.
Resilience: resistance and recovery
There is a wealth of literature discussing different approaches to measuring economic resilience and there is no consensus to a common approach.Footnote36 The method presented by Martin et al. provides a measure of economic resilience that follows the business cycle fluctuations of the wider economy and is simplistic enough to allow adaptation to fit the financial data in question.Footnote37
One common thread across all approaches to measuring economic resilience is to compare the industry or regional changes to an external economic shock, some unforeseen adverse event that is largely beyond the control of the individual. For example, the 2008 financial crisis might have adversely affected EPL clubs through the reduction of customer disposable income, and raising the cost of borrowing from financial institutions, amongst other issues. Whilst their profits could be affected, clubs had little knowledge or control over the cause of such events. A greater resistance to and a greater ability to recover from such shocks is not only desirable but of vital importance to clubs as they, unlike most corporate organizations, run consistently with a low or negative surplus.
As such, a measure of resilience for each club is calculated by comparing the change in club GVA to that of the expected change in GVA during periods of contraction and expansion. The expected change in GVA is that experienced by the wider economy, and we make use of the Services Sectorand the UK economy. Adapting the notation slightly, the measure for club resistance to contraction of the wider economy is as follows:
Where is the club in question,
is the sum of rate of change in GVA when the wider economy is experiencing
.
changes in GVA are that of the wider economy. The measure is calculated separately using the Services Sectorand the UK GVA. A similar approach is taken to measure the strength of club recovery during periods of expansion, as follows:
Financial resistance and recovery are measured by changing GVA to profit. To provide a ready comparison across time periods, all financial values are in 2019 prices, in line with data taken from the ONS. The results of these calculations offer a direct comparison between EPL clubs, identifying those that are more resistant to shocks (with a result >0) and those that manage to recover more strongly from shocks (result >0). For example, a resistance result of 0.1 shows that a club is 10% more resilient than the wider economy.
Resilience is therefore the combination of the resistance and recovery results for each club and are presented graphically. As both the results from the calculations of (1) and (2) are needed to measure and plot resilience, not all clubs can be used. 49 clubs appeared in the EPL over the period in question; this part of the analysis makes use of the 38 clubs that have been in the league during periods of both expansion and contraction.
Results and discussion
shows the total EPL financial information over time. All figures are in millions and are at nominal values. Often discussed in academic research and more popular media is the lucrative market for the sale of rights that allow exclusive broadcast of live EPL matches. Part of the original intention of forming the EPL was to package English elite football in such a way as to drive these revenues. Sure enough, broadcast revenues have risen from £51 m in 1993 to £2,823 m in 2018. Taking only the domestic broadcasting revenues, that is an increase from £0.6 million per broadcast match to £10.2 million. This reflects the increasing demand for watching live EPL matches at home or in commercial venues. Considerable growth in demand for watching live EPL matches in other countries has most recently been the key area of revenue growth for the league.
Table 2. Premier League revenue, expenditure, and profits by year
In 1993, the largest revenue stream came from match day activities, contributing 43% of total league revenue, whilst broadcast income accounted for only 25%. From 2000 onwards, broadcast revenues exceeded that of match day activities and in 2018 accounted for 59% and 14% of total revenues, respectively. Those who watch in stadia or on television are, in general, different types of customer, consuming live football in very different ways (although there is some consumption overlap over time). This change in revenue streams fundamentally moves the key customer base towards television consumers, despite the notion that a packed stadium has always been considered vital to promoting long run demand and strengthening the appearance of atmosphere during broadcasting. Technology has driven changes in how most people consume entertainment, towards on-demand streaming services. With the introduction of broadcasters such as Amazon (and streaming services from BT and Sky), the future core customer base may well be those who stream live matches on a variety of devices and are no longer tied to a set-top box or even a single location.
This higher concentration of revenues from broadcasting, now almost 60%, means a heavier reliance on a single revenue stream. As noted, this follows a global increase in demand to spectate EPL football, a demand that of course could also decrease at some point in the future. Whilst the EPL is experiencing success, the overreliance on a single revenue stream provides an increase in exposure to market risk and is in line with insolvency findings discussed in the literature review.Footnote38 Without a healthy surplus, changes in the broadcast market could cause significant financial problems for clubs in the league.
Despite the large increases in revenues, over the time period, the sum total of EPL profit stands at a loss of £1,038 million. By nature of the contest design, allowing promotion and relegation encourages clubs to overstretch financial resources in order to increase the probability of winning football matches against competing clubs. As such, staff (mainly the players) have received the majority share of revenue expansion, not the owners or shareholders (profit), which has cash flow implications as discussed by Alaminos and Fernández.Footnote39 This is an interesting situation to consider. On one hand, because the majority of financial resources are allocated to employees of the clubs, wealth is possibly shared between greater numbers of people (compared to a small number of owners). Additionally, this wealth is paid (usually) as earned income to employees residing within the UK, meaning that the UK government collects greater tax revenues. However, clubs have low (or no) surplus to call upon if costs increase or revenues drop unexpectedly. This increased exposure to market risk would naturally lead to the desire to seek emergency finance via access to readily available lines of credit. These have sometimes come in the form of wealthy owners who are willing to place millions into a business without the desire of a profitable financial return, content with club ownership as a status symbol or hobby.
The fate of Portsmouth provides an explicit warning against overreliance on a single wealthy owner for financial stability, and follows the findings of Rohde and Breuer.Footnote40 Following periods of great expansion to the club’s annual wage costs, the owner was unable to provide financial support and, with no surplus to call upon, the club entered administration, later becoming a cooperative fan-owned club.
Financial performance and macroeconomic downturns
shows changes in Premier League GVA and profit before tax between 1993 and 2018 as an index (100 = 1993). Using annual data, the UK economy experienced a contraction of GVA in 2009 following the financial crisis, which is shown as shaded dark grey. In a similar response to the financial crisis, the profits of UK companies reduced in 2009. Profits also reduced between 1999, 2001, 2007, 2011, and 2016. The corresponding periods are shaded in light grey. Revenue expansion through revised auctions of broadcast rights is of key importance to understanding financial changes within the EPL, so the renewal periods of broadcast packages are indicated by vertical dotted lines.
Figure 1. Premier League profit before tax and Gross Value Added over time, Index (100 = 1993). Periods of major economic downtowns shown by shaded area (UK GVA down in dark grey, UK company profit contraction in light grey). Renewal of Premier League broadcast rights shown by vertical dotted line.
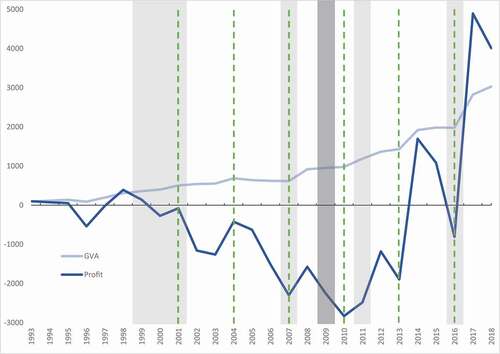
Over this time period, the UK economy has more than doubled, whereas the wealth (GVA) of the EPL is 10 times larger than 1998 and 30 times larger than 1993. This significant growth in wealth of the league is thus reflected in its contribution to the UK economy, increasing from 0.03% in 1998 to 0.17% in 2018. Leading up to 2007, EPL GVA contracted by 10.5% and, whilst the league grew around the period of the financial crisis, this growth was comparably slower (6.5% between 2008 and 2010). This supports the literature on benefits to regional economies.Footnote41
Club profits are far more volatile and whilst annual profits have increased 40-fold from 1993 to 2018, a loss is observed just two years previous. Moreover, the accumulative profit remains a loss of more than a billion pounds. With the exception of the UK contraction in company profit in 2011, the league sees a reduction in profits when entering the same time-periods of national company profit contractions. Note that 2011 saw FFP implementation and so may have had performance implications, which in turn led to financial and economic ones.Footnote42
Above all else, the most distinguishing pattern of change in both league GVA and profit is driven by renewal of broadcast rights deals from 2007 onwards. From each renewal, the following period sees expanse in GVA and profits. However, a decrease in profits is observed two or three periods forwards in each case. This corresponds with sharp rises in expenditure on transfer fees immediately following the renewal of rights. Net transfer fees rose 39% after the 2007 renewal, 76% after 2010, and 48% after 2013. Interestingly, net transfer fees rose only 2% after the 2016 renewal and is largely the reason profits increased sharply in 2017.
The expansion of revenues from the sale of broadcast rights at key periods has arguably counteracted the possible adverse impacts of wider economic downturn as well as helped clubs to reduce financial losses, in stark contrast to findings across other industries in studies on regional resilience.Footnote43 The volume of matches sold has increased at renewal points but remains well short of the total. One of the key arguments for not broadcasting all matches within the UK is to mitigate reduction in stadium attendance at the match in question and other matches played at the same time. There is a wealth of research showing live broadcasts do not adversely impact stadium attendance and thus there remains possible future opportunities to continue the growth in broadcast revenues.Footnote44
However, the sale of rights depends not only on demand, as discussed earlier, but also the legality of the collective sales method. This allows the league to constrain the number of matches sold and avoids competition between clubs when selling rights to broadcasters. The practice of selling in this manner is currently granted leniency, but legal intervention has occurred in the past and could again, providing another layer of uncertainty.
Resistance and recovery
The measures of resistance to wider economic downturn (does not incur as high losses or falls in revenue compared to the average UK company in a recession) and the ability to recover (profits rise or losses drop faster than that of the average UK company in an economic upturn), calculated from Equationequations (1)(1)
(1) and (Equation2
(2)
(2) ) are presented in . In each Figure, the periods of economic downturn and recovery are those years when the wider economy is, respectively, contracting or expanding. These Figures are presented as quadrants, the top right area showing clubs that are both resistant and recover more quickly compared to the wider economy, and are clubs we consider as most resilient. The bottom left quadrant shows clubs whose resistance and recovery was far weaker, and are thus clubs considered as least resilient. The top left and bottom right areas show clubs that have good resistance but weak recovery or weak resistance and good recovery, respectively.
Figure 2. Resistance and recovery by club to Service Sector changes in GVA. Contraction 2009. Expansion 1999–2008, 2010–2018. N = 17.
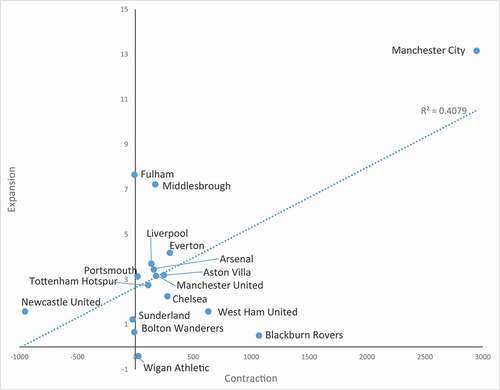
Figure 3. Resistance and recovery by club to UK changes in GVA. Contraction 2009. Expansion 1999–2008, 2010–2018. N = 17.
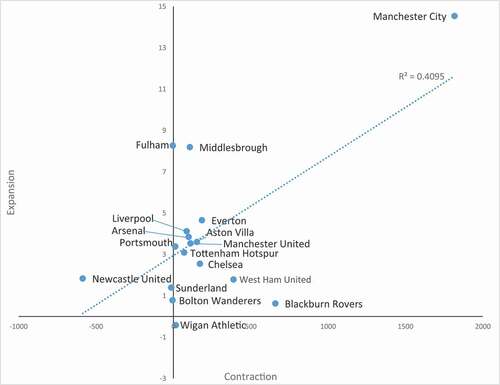
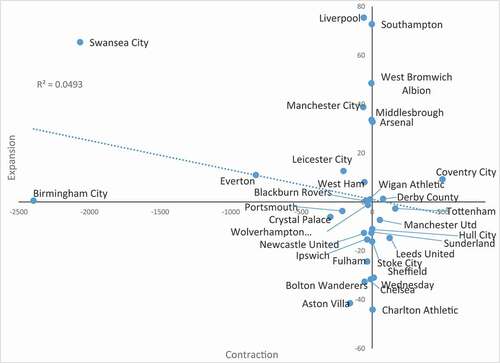
Figure 4. Resistance and recovery by club to Service Sector changes in profit. Contraction 1999–2001, 2004, 2007, 2011, 2016–2017. N = 34.
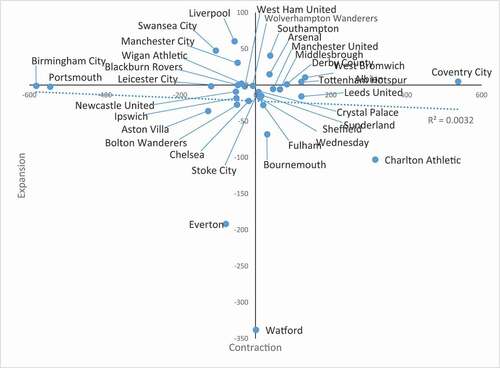
Figure 5. Resistance and recovery by club to UK changes in profit. Contraction 1999–2001, 2007, 2009, 2011, 2016. N = 31.
show the resistance and recovery of clubs using GVA compared to expansion and contraction of the Services Sector and the UK economy. Notably, there is a positive relationship between resistance and recovery across clubs (R2 = 0.4). Clubs that have been most resistant to contractions of GVA have also been strongest to recover. Whilst the results of resistance and recovery differ, the economic resilience of clubs remain broadly similar between changes in the Services Sector and the UK economy, which is in line with findings that suggest strong effects of clubs on their regional economies.Footnote45 Manchester City shows as the most economically resilient club to change in the wider economy. Whilst recovering comparably as well as Chelsea and West Ham, Newcastle United has by far the weakest resistance. The ability of clubs to recover stems from the increase in profits, tax paid, and expenditure on employees. All clubs show growth in GVA greater than the wider economy in periods of expansion, largely driven by increases in wage expenditure rather than profit, in line with Rohde and Breuer.Footnote46 The exception, Wigan Athletic, showed some restraint from over-exhausting financial resources during expansion periods, keeping net transfer spend to an average of 14% of revenue, and wage costs growth to 3% between 2009 and 2013.
show the resistance and recovery of club profit compared to expansion and contraction of the Services Sector and UK company profits. Albeit weak, the overall trend in relationship between resistance and recovery is negative (R2 = 0.04 and 0.003). This shows that clubs are more likely to be stronger in resistance or recovery whilst being weaker in the other. There are also more clubs weaker in both measures, which indicates weak economic resilience. This contrasts to results illustrated in and shows that, for some clubs, the strong expansion in GVA was fuelled in a manner that could not be sustained by the financial resources of the club alone, which is in line with research on insolvency indicators.Footnote47 Such expansion could have been considered as speculation (that future profits would be greater) or backed by external lines of credit from financial institutions or wealthy owners. The latter is particularly notable when observing the results for Chelsea shown here.
show a number of clubs that are not financially resilient, namely: Aston Villa, Bolton Wanderers, Ipswich Town, Newcastle United, and Portsmouth. There are a handful of clubs showing weak performance compared to either the Services Sector or the UK: Birmingham, Chelsea, Crystal Palace, Everton, and Watford. Bolton Wanderers, and Crystal Palace have both been members of the EPL for between a third and a half of its 30 years’ existence, and both have been relegated a number of times (3 and 4, respectively, at the time of writing). Both went into administration in 1999 (not then members of the EPL),Footnote48 and the latter’s cash flow problems affecting the club’s ability to continue as a going concern are well documented,Footnote49 and in line with the findings of Alaminos and Fernández.Footnote50
Portsmouth’s seven years in the EPL ended with the appointment of administrators for its various legal structures between 2010Footnote51 and 2012Footnote52 and related relegation following cash flow problems through lack of investment (linked to its status as a ‘flipper club’ for ownership purposes),Footnote53 which affected its ability to run as a going concern. While going concern notes are of little use in assessing the actual short-term sustainability of a club (given the historical emphasis of accounting, whereby the clubs would be aware of having gone into administration or liquidation prior to the financial statements being signed off), the Aston Villa cash flow concerns clearly impact both resistance and recovery.Footnote54 Chelsea’s resilience has also been dependent on owner funding, which presents a cautionary tale when grouped with Portsmouth, whose administration resulted from ownership funding drying up. The issue of reliance on ownership funding differs to other industries as going concern of companies in alternative industries would have been questioned at similar levels of consistent losses (and, indeed, directors would have a legal requirement to do so). This is an area fertile for future research around the motivations of owners, ownership structures, and effects on club finances.
The clubs that performed most strongly in our analysis included very few of the Big Six, with only Arsenal featuring in this list. More surprising were the outliers of Coventry City, Derby County, and West Bromwich Albion, whose resilience was clearly highlighted in the data. Coventry’s performance in the analysis could be skewed by its single relegation (2001) with no subsequent promotion back into the EPL to date, while West Bromwich Albion are the quintessential yo-yo club with four relegations and five promotions at the time of writing. The latter showed a sustainable approach to spending and profitability during its EPL seasons, maintaining an average annual profit of £5.7 million and a cumulative profit of £68.4 million between 2003 and 2018.
The remainder of the Big Six show aspects of weak financial resistance or recovery. Liverpool and Manchester City both show strong recovery but weaker resistance than the Service Sector and UK companies. Whereas Manchester United and Tottenham Hotspur have strong resistance but are weaker in recovery, perhaps a feature of showing some restraint from over-exhausting financial resources during periods of contraction. Manchester United reduced their average annual net transfer spend from £51.3 million during expansion periods to £21.3 million in contraction periods, an indicator of resistance to failure as per Beech et al.Footnote55 The same is true for Tottenham Hotspur, reducing average annual spend from £10.28 million to £5.25 million. Manchester United’s well-publicized debt restructure may have affected their resistance and recovery (in line with Szymanski’s findings),Footnote56 alongside fan dissatisfaction.
provides a summary of these results to aid insight into the number of clubs affected within the league. Whilst not an attempt to test the causality of club resilience (or lack of), includes information on length of membership in the EPL, the number of times the club has been promoted to the league, and partial information on owner financing as a proportion to total income over ten years from 2008 to 2017.Footnote57 This highlights that resilience is not exclusive to the Big Six clubs and that there is no evidence of a clear cut relationship with the length of time spent in the EPL. The non-resilient clubs appear to include those clubs that have been most often relegated and promoted, which supports the findings of Plumley et al., but, again, no clear cut relationship emerges.Footnote58 As such, this begins to suggest that increased revenues from EPL participation does not necessarily bring about resilience.
Table 3. Summary of club resilience (using profit), length of time in EPL, and owner financing
Investigating the relationship between resilience and ownership motivation could be achieved by scrutinizing owner financing information and club resilience. We take an initial informal look at this relationship in which includes, for a small number of clubs, owner financing as a proportion of total income, but does not include external financing outside of owners. Whilst not a rigorous relationship, the average owner financing to income is higher for clubs that are not resilient or show weak resistance to contraction, which provides an interesting opportunity for further study to formally test this relationship.
Finally, by way of highlighting the risks associated with fluctuations in revenues, shows club profits following a hypothetical change in revenue streams using 2018 EPL data. During this season, the clubs make a collective profit of £468 million and 6 of the 20 clubs make a loss. A substantial reduction to match day revenues of 80%, as could be expected during a period of Covid-19 restrictions, causes 12 of the 20 clubs to make a loss and brings the collective profit to a loss of £53 million. A drop of 20% in broadcast revenues would cause 13 of the 20 clubs to make a loss and bring the collective loss to £97 million. This highlights the importance for the EPL to maintain these large broadcasting revenues for financial budgetingFootnote59 and cash flow purposes,Footnote60 or otherwise take steps to encourage clubs to develop their economic resilience.
Table 4. 2018 club profits following hypothetical changes in revenue streams
Conclusion
Measuring economic resilience and tracking its changes has implications for our understanding of both EPL clubs’ sustainability and their ability to withstand future shocks, therefore enabling the league to maintain its dominant position in world football. Undoubtedly, the EPL has a large and increasing contribution to the UK. This has largely been fuelled by demand for spectating EPL matches on television around the globe in combination with the legal leniency allowing a collective selling method of these broadcast rights.
This paper shows that while EPL clubs present a large and increasing contribution to the UK economy, clubs are highly reliant on one source of income and on key individuals. Whilst it is easy to accept the common premise that the wealthier Big Six clubs are more financially stable than other clubs in the league, the analysis presented here provides evidence to show that the reality is not quite as simple. Results show that only Arsenal has a strong resilience to changes in the wider economy. The remaining Big Six clubs are strong in either resistance to economic contraction or show weak ability to recover during periods of growth. All six clubs, however, show strong economic resilience when scrutinizing GVA, which includes expenditure on employee wages. Combined, this result shows that resources external to the club’s own are fuelling expansion of wage costs. This might be via debt raised from financial institutions, support from wealthy owners, or speculation leveraged on future earnings. Clubs can use the findings to compare to close financial competitors, and strategic and financial planning.
The lack of economic resilience amongst the wealthiest clubs and the reliance on external financial resources provides the clubs with an additional risk. At an FFP level, the findings show that most EPL clubs are still vulnerable to external economic shocks and this needs to be taken into consideration when the rules are amended. Whilst such risks appear reasonable during periods of strong growth in revenue, they are likely to have great impact if the growth in broadcast revenues falters and may therefore change the EPL landscape in the next 30 years.
Disclosure statement
No potential conflict of interest was reported by the author(s).
Notes
1. Szymanski, Money and football.
2. Montague, The Billionaires Club.
3. Taylor, ‘Manchester City bank record £400 m sponsorship deal with Etihad Airways’.
4. Rhodes, ‘Manufacturing: statistics and policy’.
5. PA Media, ‘Daniel Levy warns of “irrecoverable loss of income” at Spurs unless fans return’.
6. Goyal, ‘Premier League’.
7. Jakubowski, ‘English football clubs financially distressed despite record £6bn revenues’, Slater et al.,‘I nearly vomited- explained: why Premier League’s EFL bail out has split opinion’.
8. UK Parliament, ‘Premier League and EFL chiefs questions over football rescue package negotiations’.
9. Slater, ‘Explained: The “terrible” state of Premier League clubs’ finances’.
10. Brewin, ‘Macclesfield Town’s demise was signposted but that doesn’t make it less painful’,Simmons, ‘English football’.
11. Price, ‘Brexit, Covid-19 And Ligue 1 Crisis Mean A Busy Transfer Window For Premier League Clubs’.
12. KPMG, ‘Pandemic not discouraging football club investors’.
13. Chelsea FC,Chelsea FC Financial Results.
14. BBC, ‘Some clubs in the Premier League are losing as much as £10 m a match’.
15. Sky Sports, ‘Premier League clubs’, Arsenal Media, ‘Club to receive Bank of England COVID loan’.
16. Cox, ‘Spectator Demand, Uncertainty of Results, and Public Interest’.
17. Hamil and Walters, ‘Financial performance in English professional football’, Leach and Szymanski, ‘Making Money Out of Football’, Plumley et al., ‘The unintended consequence of Financial Fair Play’.
18. Ramchandani et al., ‘Does size matter?’.
19. Alaminos and Fernández, ‘Why do football clubs fail financially?’, Szymanski, ‘Economics and (Modern) Sports History’.
20. Whyte, ‘Into the Bear Pit’, Crossley and Rudravajhala, ‘Out Of Our League’.
21. Plumley et al., ‘Too big to fail’.
22. Beech et al., ‘Insolvency events among English football clubs’.
23. Szymanski, ‘Entry into Exit’.
24. Alaminos and Fernández, ‘Why do football clubs fail financially?’.
25. Plumley et al., ‘Towards a model for measuring holistic performance of professional Football clubs’.
26. Maguire, The price of football
27. Alaminos and Fernández, ‘Why do football clubs fail financially?’.
28. Swiss Ramble, ‘Owner financing’.
29. Rohde and Breuer, ‘Europe’s Elite Football’.
30. Martin et al., ‘How Regions React to Recessions’.
31. Roberts et al., ‘What is the value of a Premier League football club to a regional economy?’.
32. Könecke et al., ‘Direct regional economic impact of Germany’s 1. FC Kaiserslautern through participation in the 1. Bundesliga’.
33. Maguire,Master Football Spreadsheet.
34. ONS, Regional gross value added (balanced) by industry: all NUTS level regions.
35. ONS, Profitability of UK companies time series.
36. Giannakis and Bruggeman, ‘Determinants of regional resilience to economic crisis’, Martin and Sunley, ‘On the notion of regional economic resilience’, Sensier et al., ‘Measuring Regional Economic Resilience across Europe’.
37. Martin et al., ‘How Regions React to Recessions: Resilience and the Role of Economic Structure’, Könecke et al., ‘Direct regional economic impact of Germany’s FC Kaiserslautern through participation in the Bundesliga’.
38. Beech et al., ‘Insolvency events among English football clubs’, Szymanski, ‘Economics and (Modern) Sports History’.
39. Alaminos and Fernández, ‘Why do football clubs fail financially?’.
40. Rohde and Breuer, ‘Europe’s Elite Football: Financial Growth, Sporting Success, Transfer Investment, and Private Majority Investors’.
41. Roberts et al., ‘What is the value of a Premier League football club to a regional economy?’.
42. Plumley et al., ‘Towards a model for measuring holistic performance of professional Football clubs’.
43. Giannakis and Bruggeman,, ‘Determinants of regional resilience to economic crisis: a European perspective’, Martin and Sunley, ‘On the notion of regional economic resilience: conceptualization and explanation’, Sensier et al., ‘Measuring Regional Economic Resilience across Europe: Operationalizing a Complex Concept’.
44. Buraimo and Simmons, ‘Uncertainty of outcome or star quality?’, Cox, ‘Live broadcasting, gate revenue, and football club performance’.
45. Martin et al., ‘How Regions React to Recessions: Resilience and the Role of Economic Structure’, Könecke et al., ‘Direct regional economic impact of Germany’s FC Kaiserslautern through participation in the Bundesliga’.
46. Rohde and Breuer, ‘Europe’s Elite Football: Financial Growth, Sporting Success, Transfer Investment, and Private Majority Investors’.
47. Beech et al., ‘Insolvency events among English football clubs’, Szymanski,’Economics and (Modern) Sports History’, Alaminos and Fernández, ‘Why do football clubs fail financially?’.
48. Bolton Wanderers, ‘Statement on behalf of the administrators for Bolton Wanderers Football Club’.
49. Jordan, ‘Be careful what you wish for’.
50. Alaminos and Fernández, ‘Why do football clubs fail financially?’.
51. Portsmouth City Football Club Limited,Filing history.
52. Portsmouth City Football Club Limited,2010 Filing history.
53. Maguire, The price of football.
54. Evans, ‘The financial problems Aston Villa must solve this month’.
55. Beech et al.’Insolvency events among English football clubs’.
56. Szymanski, ‘Economics and (Modern) Sports History’.
57. Swiss Ramble, ‘Owner financing’.
58. Plumley et al., ‘Too big to fail’.
59. Beech et al. ‘Insolvency events among English football clubs’.
60. Alaminos and Fernández, ‘Why do football clubs fail financially?’.
Bibliography
- Alaminos, D., and M.Á. Fernández. “‘Why Do Football Clubs Fail Financially? A Financial Distress Prediction Model for European Professional Football Industry.” PLOS ONE (Public Library of Science) 14, no. 12 (2019): e0225989. doi:https://doi.org/10.1371/journal.pone.0225989.
- Arsenal Media.‘Club to receive Bank of England COVID loan’. January 7, 2021. https://www.arsenal.com/news/club-receive-bank-england-covid-loan (accessed November 12, 2021).
- BBC. ‘Some Clubs in the Premier League are Losing as much as £10m a Match’.Twitter, 2020. BBC Breakfast. https://twitter.com/BBCBreakfast/status/1328613828381306881 (accessed January 6, 2021).
- Beech, J., S. Horsman, and J. Magraw. “Insolvency Events among English Football Clubs.” International Journal of Sports Marketing & Sponsorship 11, no. 3 (2010): 53–66. doi:https://doi.org/10.1108/IJSMS-11-03-2010-B006.
- Bolton Wanderers.‘Statement on Behalf of the Administrators for Bolton Wanderers Football Club’. August 28, 2019. https://www.bwfc.co.uk/news/2019/august/statement-on-behalf-of-david-rubin–partners-administrators-for-bolton-wanderers3/ (accessed November 12, 2021).
- Brewin, J.‘Macclesfield Town’s Demise Was Signposted but that Doesn’t Make It Less Painful’. The Guardian. September 17, 2020. https://www.theguardian.com/football/2020/sep/17/macclesfield-demise-was-signposted-but-that-does-not-make-it-less-painful-winding-up-order (accessed November 12, 2021).
- Buraimo, B., and R. Simmons. “‘Uncertainty of Outcome or Star Quality? Television Audience Demand for English Premier League Football’.” International Journal of the Economics of Business 22, no. 3 (2015): 449–469. doi:https://doi.org/10.1080/13571516.2015.1010282.
- Chelsea, F.C. ‘Chelsea Fc Financial Results’. December 30, 2020. https://www.chelseafc.com/en/news/2021/12/30/chelsea-fc-financial-results (accessed November 12, 2021).
- Cox, A. “Live Broadcasting, Gate Revenue, and Football Club Performance: Some Evidence.” International Journal of the Economics of Business 19, no. 1 (2012): 75–98. doi:https://doi.org/10.1080/13571516.2012.643668.
- Cox, A. “Spectator Demand, Uncertainty of Results, and Public Interest: Evidence from the English Premier League.” Journal of Sports Economics 19, no. 1 (2018): 3–30. doi:https://doi.org/10.1177/1527002515619655.
- Crossley, M., and S. Rudravajhala. “Out Of Our League.” BBC Sounds (2020): https://www.bbc.co.uk/programmes/p08q9nr2
- Evans, G. “The Financial Problems Aston Villa Must Solve This Month.” Birmingham Mail June15 (2018): https://www.birminghammail.co.uk/sport/football/football-news/aston-villa-xia-grealish-crisis-14756848 accessed November 12, 2021
- Giannakis, E., and A. Bruggeman. “Determinants of Regional Resilience to Economic Crisis: A European Perspective’.” European Planning Studies 25, no. 8 (2017): 1394–1415. doi:https://doi.org/10.1080/09654313.2017.1319464.
- Goyal, S.P.L.: $400m Broadcast Revenue Loses Even if “Project Restart” Takes-off’. Inside Sport. May 12, 2020.https://www.insidesport.in/premier-league-400m-broadcast-revenue-loses-even-if-project-restart-takes-off/ (accessed November 12, 2021).
- Hamil, S., and G. Walters. “Financial Performance in English Professional Football: “An Inconvenient Truth”. Soccer & Society 11, no. 4 (2010): 354–372. doi:https://doi.org/10.1080/14660971003780214.
- Jakubowski, Z. “English Football Clubs Financially Distressed despite Record £6bn Revenues.” Accountancy Daily September11 (2020): https://www.accountancydaily.co/english-football-clubs-financially-distressed-despite-record-ps6bn-revenues accessed November 12, 2021
- Jordan, S. Be Careful What You Wish For. Cape Town: Random House, 2012.
- Könecke, T., H. Preuss, and N. Schütte. “Direct Regional Economic Impact of Germany’s 1. FC Kaiserslautern through Participation in the 1. Bundesliga’.” Soccer & Society 18, no. 7 (2017): 988–1011. doi:https://doi.org/10.1080/14660970.2015.1067786.
- KPMG.‘Pandemic Not Discouraging Football Club Investors’. KPMG Football Benchmark. November 17, 2020. https://footballbenchmark.com/library/pandemic_not_discouraging_football_club_investors (accessed November 21, 2021).
- Leach, S., and S. Szymanski. “Making Money Out of Football.” Scottish Journal of Political Economy 62, no. 1 (2015): 25–50. doi:https://doi.org/10.1111/sjpe.12065.
- Maguire, K. ‘Master Football Spreadsheet’. Twitter: https://twitter.com/KieranMaguire/status/1241296088520327168?s=20: 2020a). (accessed November 21, 2021).
- Maguire, K. The Price of Football: Understanding Football Club Finance. New Castle: Agenda Publishing, 2020b.
- Maguire, K.‘Premier League Player Sales 1992- 2020’. https://public.flourish.studio/visualisation/4864109/ ( accessed January 1, 2021).
- Martin, R., and P. Sunley. “On the Notion of Regional Economic Resilience: Conceptualization and Explanation.” Journal of Economic Geography 15, no. 1 (2015): 1–42. doi:https://doi.org/10.1093/jeg/lbu015.
- Martin, R., P. Sunley, B. Gardiner, and P. Tyler. “Tyler.‘How Regions React to Recessions: Resilience and the Role of Economic Structure.” Regional Studies 50, no. 4 (2016): 561–585. doi:https://doi.org/10.1080/00343404.2015.1136410.
- Montague, J. The Billionaires Club: The Unstoppable Rise of Football’s Super-rich. Owners.London: Bloomsbury Publishing, 2017.
- ONS.‘Regional Gross Value Added (Balanced) by Industry: All NUTS Level Regions’. Office for National Statistics (2019). https://www.ons.gov.uk/economy/grossvalueaddedgva/datasets/nominalandrealregionalgrossvalueaddedbalancedbyindustry (accessed November 21, 2021).
- ONS.‘Profitability of UK Companies Time Series’. Office for National Statistics (2020). https://www.ons.gov.uk/economy/nationalaccounts/uksectoraccounts/datasets/profitabilityofukcompanies (November 21, 2021).
- PA Media. “Daniel Levy Warns of “Irrecoverable Loss of Income” at Spurs unless Fans Return.” The Guardian November23 (2020): https://www.theguardian.com/football/2020/nov/23/daniel-levy-warns-irrecoverable-loss-of-income-at-tottenham-unless-fans-return accessed November 21, 2021.
- Plumley, D., G. Ramchandani, and R. Wilson. “The Unintended Consequence of Financial Fair Play: An Examination of Competitive Balance across Five European Football Leagues.” Sport, Business and Management: An International Journal 9, no. 2 (2019): 118–133. doi:https://doi.org/10.1108/SBM-03-2018-0025.
- Plumley, D., J.-P. Serbera, and R. Wilson. “Too Big to Fail? Accounting for Predictions of Financial Distress in English Professional Football Clubs’.” Journal of Applied Accounting Research 22, no. 1 (2020): 93–113. doi:https://doi.org/10.1108/JAAR-05-2020-0095.
- Plumley, D., R. Wilson, and G. Ramchandani. “Towards a Model for Measuring Holistic Performance of Professional Football Clubs.” Soccer & Society 18, no. 1 (2017): 16–29. doi:https://doi.org/10.1080/14660970.2014.980737.
- ‘PORTSMOUTH CITY FOOTBALL CLUB LIMITED - Company number 03747237 - Filing history’. Companies House. https://find-and-update.company-information.service.gov.uk/company/03747237/filing-history ( accessed November 21, 2021).
- ‘PORTSMOUTH FOOTBALL CLUB (2010) LIMITED - Company Number 07264768 - Filing History’. Companies House. https://find-and-update.company-information.service.gov.uk/company/07264768/filing-history (accessed November 21, 2021).
- Price, S. “Brexit, Covid-19 And Ligue 1 Crisis Mean A Busy Transfer Window For Premier League Clubs.” Forbes December28 (2020): https://www.forbes.com/sites/steveprice/2021/12/28/brexit-covid-19-and-ligue-1-crisis-mean-a-busy-transfer-window-for-premier-league-clubs/?sh=653021446474 accessed November 21, 2021
- Ramble, S. Twitter.September 14, 2020). https://twitter.com/SwissRamble/status/1305397885010403329(accessed November 22, 2021).
- Ramchandani, G., D. Plumley, H. Preston, and R. Wilson. “Does Size Matter?: An Investigation of Competitive Balance in the English Premier League under Different League Sizes.” Team Performance Management: An International Journal 25, no. 3/4 (2019): 162–175. doi:https://doi.org/10.1108/TPM-10-2018-0064.
- Rhodes, C. “Manufacturing: Statistics and Policy.” House of Commons January10 (2020): https://commonslibrary.parliament.uk/research-briefings/sn01942/#:~:text=In%202018%20manufacturing%20in%20the,exports%2C%20worth%20%C2%A3275%20billion accessed November 21, 2021
- Roberts, A., N. Roche, C. Jones, and M. Munday. “What Is the Value of a Premier League Football Club to a Regional Economy?” European Sport Management Quarterly 16, no. 5 (2016): 1–17. doi:https://doi.org/10.1080/16184742.2016.1188840.
- Rohde, M., and C. Breuer. “Europe’s Elite Football: Financial Growth, Sporting Success, Transfer Investment, and Private Majority Investors.” International Journal of Financial Studies 12, no. 4 (2016): 1–20.
- Sensier, M., G. Bristow, and A. Healy. “Measuring Regional Economic Resilience across Europe: Operationalizing a Complex Concept.” Spatial Economic Analysis 11, no. 2 (2016): 128–151. doi:https://doi.org/10.1080/17421772.2016.1129435.
- Simmons, R., ‘English Football: Why Financial Calamity Facing Clubs Is Even Worse than in Mainland Europe’. The Conversation. October 2, 2020.https://theconversation.com/english-football-why-financial-calamity-facing-clubs-is-even-worse-than-in-mainland-europe-147156 (accessed November 22, 2021).
- Sky Sports.‘Premier League Clubs: Furlough, Pay-cuts, Deferrals’. April 25, 2020.https://www.skysports.com/football/news/11661/11968597/premier-league-clubs-furlough-pay-cuts-deferrals (November 22, 2021).
- Slater, M. “Explained: The “Terrible” State of Premier League Clubs’ Finances.” The Athletic April8 (2020): https://theathletic.com/1729003/2020/04/08/premier-league-finances-accounts-newcastle-palace/ accessed November 22, 2021
- Slater, M., P. Buckingham, and J. D’Urso. “I Nearly Vomited” — Explained: Why Premier League’s EFL Bail Out Has Split Opinion.” The Athletic December4 (2020): https://theathletic.com/2237356/2020/12/03/premier-league-efl-bailout/ accessed November 22, 2021
- Szymanski, S. “Economics and (Modern) Sports History’.International.” Journal of the History of Sport 32, no. 15 (2015a): 1775–1777. doi:https://doi.org/10.1080/09523367.2015.1107544.
- Szymanski, S. Money and Football: Why Chievo Verona, Unterhaching, and Scunthorpe United Will Never Win the Champions League, Why Manchester Ciry, Roma, and Paris St. Germain Can, and Why Real Madrid, Bayern Munich, and Manchester United Cannot Be Stopped. (New York: Nation Books, 2015b).
- Szymanski, S. “Entry into Exit: Insolvency in English Professional Football’.Scottish.” Journal of Political Economy 64, no. 4 (2017): 419–444.
- Taylor, D.‘Manchester City Bank Record £400m Sponsorship Deal with Etihad Airways’. The Guardian. July 8, 2011.https://www.theguardian.com/football/2011/jul/08/manchester-city-deal-etihad-airways (accessed November 22, 2021).
- UK Parliament.‘Premier League and EFL Chiefs Questions over Football Rescue Package Negotiations’. November 5, 2020.https://committees.parliament.uk/committee/378/digital-culture-media-and-sport-committee/news/120525/premier-league-and-efl-chiefs-questiones-over-football-rescue-package-negotiations/ (accessed November 22, 2021).
- Whyte, C. Into the Bear Pit: The Explosive Autobiography. [S.l.].Edinburgh: Arena Sport, 2020.