
Abstract
One of the many parameters that can affect cochlear implant (CI) users’ performance is the site of presentation of electrical stimulation, from the CI, to the auditory nerve. Evoked compound action potential (ECAP) measurements are commonly used to verify nerve function by stimulating one electrode contact in the cochlea and recording the resulting action potentials on the other contacts of the electrode array.
The present study aimed to determine if the ECAP amplitude differs between the apical, middle, and basal region of the cochlea, if double peak potentials were more likely in the apex than the basal region of the cochlea, and if there were differences in the ECAP threshold and recovery function across the cochlea.
ECAP measurements were performed in the apical, middle, and basal region of the cochlea at fixed sites of stimulation with varying recording electrodes. One hundred and forty one adult subjects with severe to profound sensorineural hearing loss fitted with a Standard or FLEXSOFT electrode were included in this study. ECAP responses were captured using MAESTRO System Software (MED-EL). The ECAP amplitude, threshold, and slope were determined using amplitude growth sequences. The 50% recovery rate was assessed using independent single sequences that have two stimulation pulses (a masker and a probe pulse) separated by a variable inter-pulse interval. For all recordings, ECAP peaks were annotated semi-automatically.
ECAP amplitudes were greater upon stimulation of the apical region compared to the basal region of the cochlea. ECAP slopes were steeper in the apical region compared to the basal region of the cochlea and ECAP thresholds were lower in the middle region compared to the basal region of the cochlea. The incidence of double peaks was greater upon stimulation of the apical region compared to the basal region of the cochlea.
This data indicates that the site and intensity of cochlear stimulation affect ECAP properties.
Introduction
The performance of individuals with a cochlear implant (CI) can vary to a great extent. One of the many parameters that can affect the individual's performance is the presentation of electrical stimulation from the CI to the auditory nerve. The activity of the auditory pathways can be recorded by means of evoked potentials (CitationBrown et al., 1990). Electrically evoked potentials are a superposition of many small electrical impulses generated by the auditory nerve in response to the presentation of an electrical stimulus (CitationBahmer et al., 2010a).
Using neural response telemetry a physiological neural response from the peripheral part of the auditory nerve, the evoked compound action potential (ECAP), can be recorded simply and directly (CitationLai and Dillier, 2000). The objective threshold of the ECAP response provides information about the initial elicitation of nerve signals, which can be used in CI fitting to estimate subjective thresholds and the maximum comfortable loudness levels (CitationEisen and Franck, 2004; CitationWesten et al., 2011). The latency and the amplitude of these responses can be used for diagnostic purposes in a clinical setting to determine whether a CI is able to stimulate the auditory nerve and whether the auditory nerve is responsive (CitationBahmer et al., 2010a).
ECAP recordings are performed by stimulating one electrode contact in the cochlea and recording the resulting changes in voltage over time on another electrode contact within the cochlea. One of the main challenges of taking ECAP recordings is the presence of residual decaying charges produced during stimulation, called stimulation artifact. ECAP amplitudes typically sit on a large stimulation artifact (CitationWesten et al., 2011). The stimulus artifact has to be removed using an artifact rejection scheme, because the artifact obscures the ECAP response (CitationWesten et al., 2011) and the rejection scheme has an influence on the ECAP recording (CitationBahmer et al., 2010aCitation, 2010b; CitationKlop et al., 2004).
The alternating-polarity paradigm is the default artifact rejection scheme included in MAESTRO software (MED-EL). Under this paradigm measurements are performed twice using a cathodic/anodic and anodic/cathodic stimulation pulse. Averaging the two measurements, removes the stimulation artifact and the ECAP signal remains (CitationBrown et al., 1990). The recorded ECAP typically consists of a negative peak (N1) and a positive peak (P2). The negative peak has a latency of 0.2–0.4 ms after stimulus onset (CitationAbbas et al., 2006; CitationBahmer et al., 2010a). In some cases, the occurrence of a second positive peak is observed (Citationvan den Honert and Stypulkowski, 1984). Such a pattern has been described as a ‘double peak’ or a Type II nerve response (CitationLai and Dillier, 2000). CitationStypulkowski and van den Honert (1984) suggest that the double peak arises from two components that could be axonal and dendritic in origin. Using a simple mathematical model which linearly combines two separate waveforms it has been possible to simulate the different types of neural response telemetry waveforms (CitationLai and Dillier, 2000). The simulation of the waveforms by CitationLai and Dillier (2000) supports the ‘two-component’ hypothesis indicating that the response most likely originates from the axonal and dendritic processes. Furthermore, CitationWesten et al. (2011) assumed that ECAP amplitudes have a linear relationship with the number of excited fibers. This is based on the unitary response theory, a concept proposed by Goldstein and Kiang (as cited in CitationStypulkowski and van den Honert, 1984), which proposes that each nerve fiber contributes equally to recordings of acoustic ECAP (CitationWesten et al., 2011). Several authors indicate that more apical contacts elicit a greater ECAP response (CitationBotros and Psarros, 2010; CitationFrijns et al., 2002). This consequently leads to the presumption that there is greater neural survival in the apex of the cochlea.
Other studies also indicate that the ECAP amplitude gets smaller the farther the recording electrode is from the stimulating electrode (CitationAbbas et al., 1999; CitationCohen et al., 2004; CitationFrijns et al., 2002). However, it is not known what factors exactly could influence differences in ECAP signals along the cochlea. Furthermore, as outlined previously by CitationBrill et al. (2009), many studies are limited by the extent to which the length of the cochlea was stimulated and thus, the effect of stimulation at the apex could not be investigated. Firstly, many studies employ electrodes of limited length (CitationBrill et al., 2009), and secondly, the length of the cochlea differs greatly between individuals (CitationErixon and Rask-Andersen, 2013; CitationFranke-Trieger et al., 2014; CitationFranke-Trieger and Murbe, 2015; CitationWürfel et al., 2014).
The present study employed an electrode array of 31.5 mm, of which at least 27 mm had to be inserted into the cochlea (i.e. a maximum of two extra-cochlear electrodes was allowed). We aimed to determine the effects of stimulation intensity and the site of stimulation (basal, middle, apex) on ECAP response (amplitude, threshold, slope, recovery function, recovery sequences) and the incidence of double peaks. We hypothesized that there would be differences in ECAP threshold and recovery function depending on whether the apex, middle, or basal region of the cochlea was stimulated, and that the incidence of double peaks increased with stimulation intensity.
Methods
Subjects
This study was a prospective multicenter study including 136 adult participants (70 male, 66 female), with severe to profound sensorineural hearing loss. Included were five participants (one male, four female) that were bilaterally implanted and tested on both ears. Thus, n = 141 ears were tested in this study. The subjects were implanted with a PULSARCI100 (n = 63) or SONATATI100 (n = 78) CI (MED-EL). A Standard electrode (MED-EL) was used in 122 subjects and the FLEXSOFT electrode (MED-EL) in 19 subjects, both with an intracochlear length of 31.5 mm and 12 channels of stimulation. A detailed description of the electrodes is available at: http://www.medel.com/maestro-eas-electrodes.
The mean age at time of assessment was 51.1 years (min.: 18.1, Max.: 88.5). The mean time between assessment and implantation in the right ear was 2.5 years (min.: 0.1, max.: 14). The mean time between assessment and implantation in the left ear was 2.3 years (min.: 0.1, max.: 15). The etiologies of deafness are presented in Table .
Table 1 Etiology of hearing loss
Adult subjects with at least 10 active electrodes in the last telemetry recording; active electrodes 1, 2, and 3 (1–12: numbered from apex to base); and, without apical electrode tip fold-over (as determined by X-ray), were included in this study. Depth of insertion data are included in Tables and .
Table 2 Depth of insertion (mm)
Table 3 Fitting number of active electrodes
Testing was conducted in one test interval at a routine visit for follow-up. Written informed consent was obtained from each subject for the inclusion of their data in this study. Institutional Review Board (IRB) approval was obtained for each participating center.
ECAP measurements
Before ECAP testing, the integrity of the implant was verified and impedances on electrodes were determined using the telemetry function of the CI. ECAP responses were captured using MAESTRO System Software version 3.01 or 4.0 and a Diagnostic Interface Box II. Datasets were exported using the ‘Scientific XML’ export scheme and imported into custom software for evaluation.
Compound action potentials were evoked in the cochlea by stimulating three different electrodes of the implanted array (Fig. ). In the apical region, stimulation was performed on electrode 2, in the middle region stimulation was performed on electrode 5, and in the basal region stimulation was performed on electrode 10. In the apical region, electrode 2 was chosen to allow recordings more apical than the stimulation electrode. The maximum amplitudes used to elicit an ECAP response were adjusted to the patients maximum comfort level for all three stimulating electrodes individually using the ‘Loudness tool’, a feature of the MAESTRO software used to ‘play’ a sequence simulating an ECAP measurement at the currently selected maximum amplitude to the patient. Biphasic stimuli of 30 μs phase duration were used, with an alternating-polarity paradigm, averaging over 25 iterations, with a 10 ms measurement gap, and a stimulation rate of 45.1 pulses/second.
Figure 1 Definition of basal, middle, and apical region of the cochlea matched to tonotopic map of the cochlea and insertion depth. *Depicts electrodes used for stimulation.
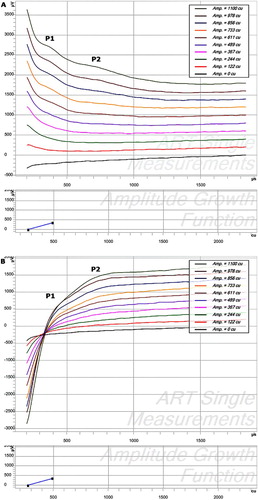
In the MAESTRO platform; stimulation levels are adjusted in charge units (qu). Charge units are the product of the amplitude of the stimulus current and the pulse width divided by 1000 (i.e. amplitude current × pulse width/1000) (CitationWolfe and Schafer, 2010). Amplitude growth functions (AGFs), recording sequences usually consisting of a single recording with one stimulation pulse followed by an ECAP measurement, were measured using 10 equidistant stimulation levels between 0 qu and the maximum comfort level on all other active electrodes of the array. Recovery sequences were measured with inter-pulse intervals of 300, 500, 750, 1000, 1500, 2500, 5000, and 8000 µs to determine the refractory behavior of the cochlear nerve. Recovery sequences consist of independent single sequences that have two stimulation pulses (a masker and a probe pulse) separated by a variable inter-pulse interval followed by an ECAP measurement. The artifact rejection scheme used was alternating polarity. Two recordings following a single (AGF) or double-pulse (recovery sequence), one where stimulation pulses were anodic–cathodic, and one where those pulses were cathodic–anodic were processed to get a single ECAP recording (Fig. A and B). For recovery sequences, an electrode was used for stimulation and one of the adjacent electrodes was used for recording. Then, the same electrode that had been used for stimulation was again used for stimulation, and the other adjacent electrode was used for recording.
Figure 2 Raw data of ECAP recordings prior to any artifact reduction with an offset of 200 cu for visualization purposes. Although masked by the stimulation artifact, the double peaks (P1 and P2) are still visible. (A) AC (biphasic stimulation, anodic first – cathodic second). (B) CA (cathodic–anodic).
Within the custom software minima and maxima of individual ECAP measurements of both, AGF and recovery sequences were assigned semi-automatically. Alternating polarity and zero amplitude template artifact reduction paradigms were automatically applied to all ECAP recordings. If necessary the scaled template artifact reduction paradigm was performed after visual inspection. All artifact reduction paradigms were used in the same way as these are available in the default setting of the MAESTRO System Software (Fig. ).
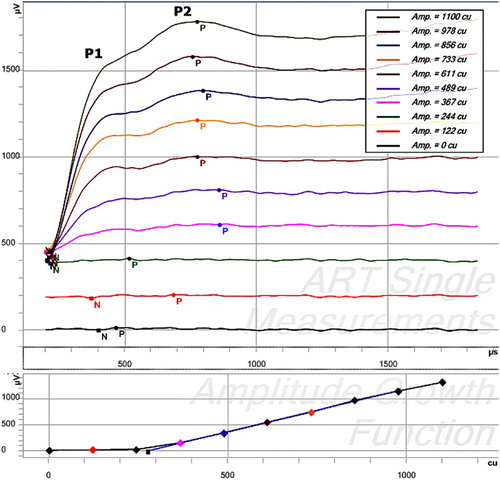
Figure 3 ECAP measurements showing a double peak (P1 and P2) as displayed in the ART-task in MAESTRO. Stimulation was performed on electrode 5, recording on electrode 6 in 10 steps between 0 and 1100 cu. The main panel shows the 10 individual recordings with an offset of 200 cu after artifact reduction. The bottom graph shows the AGF, plotting the ECAP amplitude versus stimulation amplitude.
Maximum ECAP amplitudes (qu), thresholds (qu), and slopes (µV/qu) were calculated automatically by the computer software for AGFs with a clear neural response as determined by visual inspection (for details see analyses and Fig. A). The inter-pulse interval corresponding to 50% of the maximum amplitude (IPI50) was calculated for each recovery sequence with a clear neural response as determined by visual inspection (for details see analyses, Fig. ).
Analyses
Descriptive statistics were used to report demographic and baseline characteristics. Quantitative data are presented as mean, standard deviation (SD), and range (minimum and maximum); qualitative data are presented as absolute and relative frequencies. Inferential statistics were used to present ECAP recordings (i.e. ECAP AGF and recovery function) and ECAP signals.
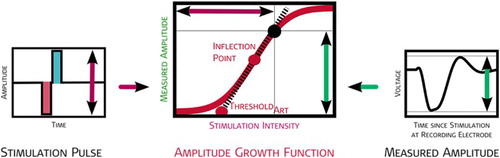
ECAP amplitudes were calculated as the difference in voltage between the minimum N1 and the maximum P2, at each stimulation intensity, in a particular AGF. All recorded amplitudes were plotted against the stimulation charge, a sigmoid curve fitted by a least-square algorithm and tangent line at the inflection point was calculated (Fig. ). The sigmoid curve is fitted by the following equation, using four heuristically chosen parameters representing electro-physiologic properties of the stimulated neural population:‘
’ represents the average of all ECAP amplitudes below threshold and reflects the spontaneous neural activity (without electrical stimulation) in µV; ‘
’ represents the rate of change per stimulation unit within the dynamic range of the modeled neural population in 1/nC; ‘
’ represents the maximal compound action potential observable at the recording electrode in µV; and ‘
’ corresponds to the midpoint (inflection point) of the sigmoidal function.
Figure 4 Graphical representation of the AGF and the measurement paradigm fitting function used. The algorithm of the fitting function uses at least four data points. A maximum of two data points were below threshold, i.e. a minimum of two visible ECAPs were used for the determination of AGF threshold and slope. The black point is an example for one amplitude measured in an AGF. The stimulation amplitude (vertical purple arrow) is plotted versus the recorded voltage (vertical green arrow). The inflection point and the threshold are derived from an exponential function fitted to all points measured in an AGF (all derived values are in red).
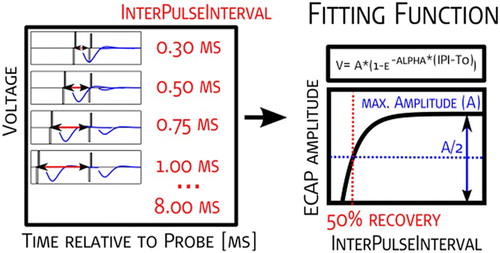
The amplitudes of the recovery sequences were plotted against time between stimulation pulses (300–8000 µs) for the two nearest electrodes to electrodes which had been used for stimulation. For the purposes of determining the IPI50, the following fitting function described by CitationBattmer et al. (2004) was used:
where ‘A’ describes the maximal amplitude reached; ‘∝’ describes the speed of recovery; and ‘t0’ describes the absolute refractory period (CitationMiller et al., 2008).
The IPI50 is defined as the inter-pulse time where the amplitude reaches 50% of the maximum amplitude (‘A’), (Fig. ).
Figure 5 Graphical representation of the recovery function. The measurement paradigm, fitting function used, and determination of the ECAP threshold and ECAP slope are presented.
Double peaks were classified in this study as described by CitationLai and Dillier (2000). The incidence of double peaks was plotted versus the stimulation amplitude and recording electrode. The analyses of ECAP amplitude, threshold, slope, and recovery sequence parameters were limited to ECAP responses where measurements were available for all three regions stimulated (apical, middle, basal). For analyses, the ECAP response must also show a clear neural response. ECAP measurements with a clear neural response were determined by visual inspection by a team of experts. ECAP measurements with little or no artifact, as determined by the experts, were selected for further analyses.
Only data with no double peak measurements were used for the ECAP analyses; with the exception of the comparison analyses of double peak measurement data.
ECAP amplitudes were grouped according to their respective stimulation intensities and analyzed per region (basal, middle, or apex) and according to the mean of the basal, middle, and apical region combined. Univariate analyses of variance, with the cochlear region as factor, were performed for each test condition. A post hoc analysis to detect differences between the individual regions of stimulation was performed using independent sample t-tests. Adjustments for multiple comparisons were performed using Bonferroni corrections. A P-value of <0.05 was considered statistically significant.
Results
ECAP amplitudes
Positive ECAP responses were recorded for 91.5% of all the ears tested, 83.6% of all stimulating electrodes tested and 72.6% of all AGFs in this study.
Seventy-six percent of all ECAP recordings with a clear neural response were made with a stimulation intensity of between 10 and 25 qu, 4% of recordings were below 10 qu, and 20% of recordings were performed at more than 25 qu. The stimulation intensity had a significant effect on the ECAP amplitude in the basal (P < 0.001), middle (P < 0.001), and apical region (P < 0.001) of the cochlea. The effect of stimulation intensity at the different regions on ECAP amplitude is shown in Table . At a stimulation intensity of 10–25 qu there was a significant difference between regions in ECAP amplitude (F(1,2865) = 27.28, P < 0.001). The ECAP amplitude was significantly different between the basal versus the middle (P < 0.001), basal versus the apical (P < 0.001), and apical versus the middle (P < 0.001) region of the cochlea (Fig. ).
Figure 6 ECAP amplitudes plotted versus stimulation intensity by region stimulated. Stimulation-recording electrode pairs were 2–3, 5–6, and 10–11, for the apical, middle, and basal region, respectively. The ECAP amplitudes for the stimulation intensities above a stimulation charge [qu] of 10 qu and below 28 qu only are shown. Mean values are depicted using black squares and median values using horizontal lines.
![Figure 6 ECAP amplitudes plotted versus stimulation intensity by region stimulated. Stimulation-recording electrode pairs were 2–3, 5–6, and 10–11, for the apical, middle, and basal region, respectively. The ECAP amplitudes for the stimulation intensities above a stimulation charge [qu] of 10 qu and below 28 qu only are shown. Mean values are depicted using black squares and median values using horizontal lines.](/cms/asset/b419c058-5b3c-4ab0-bb98-475ef5f802e2/ycii_a_1240427_f0006_b.gif)
Table 4 Mean ECAP amplitudes in the apical, middle, or basal region of the cochlea. Results are presented stratified according to stimulation intensity and between a stimulation charge [qu] of 10–25 (stimulation charge for 76% of all ECAP recordings). Recording amplitude is presented as the mean ± standard deviation
ECAP thresholds
ECAP thresholds were dispersed over a wide range in the basal, middle, and apical region of the cochlea (Fig. A). The mean ECAP threshold in the basal region of the cochlea was 12.7 ± 3.1 qu, 11.7 ± 3.9 qu in the middle, and 12.0 ± 3.1 qu in the apical region of the cochlea. The region of stimulation had a significant effect on the ECAP threshold (F(1,464) = 3.52, P = 0.030). The ECAP threshold was significantly different between the basal versus the middle region of the cochlea (P = 0.011). Comparison of the ECAP thresholds upon stimulation of the basal versus the apical region of the cochlea (P = 0.054) and upon the stimulation of the apical versus the middle region of the cochlea (P = 0.387) were not significantly different.
Figure 7 (A) ECAP thresholds, (B) slopes, and (C) 50% recovery function, relative to the region stimulated. Stimulation-recording electrode pairs were 2–3, 5–6, and 10–11, for the apical, middle, and basal region, respectively. Mean values are depicted using black squares and median values using horizontal lines. Black circles represent data outliers.
ECAP slopes
The mean ECAP slope in the basal region of the cochlea was 37.06 ± 23.6 µV/qu, 40.5 ± 29.7 µV/qu in the middle, and 67.1 ± 54.6 µV/qu in the apical region of the cochlea (Fig. B).
The region of stimulation had a significant effect on the ECAP growth function (ECAP slope) (F(1,464) = 28.03, P < 0.001).
There was a significant difference between the basal and apical region (P < 0.001), and middle and apical (P < 0.001) region in the ECAP slope. The ECAP slope of the basal region was not significantly different from the ECAP slope of the middle region (P = 0.269).
Recovery sequence parameters
Results of the 50% recovery sequence parameters are shown in Table . ECAP recovery sequences were detected in 49 out of 94 subjects in all three regions of the cochlea that were stimulated (52.1%). Responses were recorded for 23 subjects in the basal region (24.5%), 20 subjects in the middle region (21.3%), and 19 subjects in the apical region (20.2%).
Table 5 Number of 50% recovery sequence parameters detected according to region stimulated
Recovery inter-pulse interval
The 50% recovery inter-pulse interval was 1032.99 μs in the basal region of the cochlea, 1042.4 μs in the middle, and 1158.3 μs in the apical region of the cochlea. The region of stimulation had a significant effect on the recovery function (F(1, 360) = 4.60, P = 0.011) (Fig. C). Stimulation of the basal region of the cochlea yielded a significantly lower 50% recovery function compared to stimulation of the apical region of the cochlea (P = 0.007). Similarly, stimulation of the middle region of the cochlea yielded a significantly lower 50% recovery function than stimulation of the apical region (P = 0.013).
ECAP double peaks
The incidence of double peaks was greatest in the middle region (18.4%). The apical region had almost half the incidence of double peaks as the middle region (10.1%). The basal region had the least incidence of double peaks (7.1%) (Table ). The detection of a double peak increased with increasing stimulation intensity and with the distance from the stimulating electrode, when the apical electrode and the middle electrode were used for stimulation.
Table 6 Cross tabulation of region of stimulation (apical, middle, basal) and the occurrence of double peaks
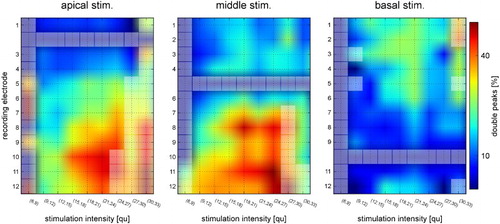
The detection of double peaks per stimulation intensity relative to the stimulation electrode and recording electrode is plotted in Fig. . Fewer double peaks were observed when the basal electrode was used for stimulation. Increasing the distance between the stimulating electrode and the recording electrode increased the incidence of double peaks. Increasing the stimulation intensity did not appear to have a pronounced effect on the incidence of double peaks.
Figure 8 Incidence of detection of double peaks per stimulation intensity, relative to the stimulation electrode and recording electrode. The closer to the red end of the spectrum, the greater the likelihood of a double peak. Discrete data points and interpolated areas are in between the grid lines for easier visibility. Data points with fewer than 10 samples are indicated with lighter colored squares.
Discussion
In this study ECAP measurements were performed with a fixed site of stimulation in the apical, middle, and basal region of the cochlea and varying recording electrodes. The ECAP measurements showed that there were differences in ECAP recordings when different regions of the cochlea were stimulated. ECAP amplitudes were greater in the apical region of the cochlea compared to the basal region. ECAP slopes were steeper in the apical region compared to the basal region of the cochlea and ECAP thresholds were lower in the middle region compared to the basal region of the cochlea. Overall, the region of stimulation had a significant effect on the ECAP threshold. Double peak responses occurred less frequently than single peak ECAP responses. However, the incidence of double peaks increased the greater the distance between the stimulating and recording electrode. The incidence of double peaks was greater in the middle region than the apical or basal region of the cochlea.
The positive ECAP responses, recorded in the present study (91.5% for all implants, 83.6% of stimulating electrodes, and 72.6% of recording electrodes) were within the range of those reported previously elsewhere (CitationCafarelli Dees et al., 2005; CitationVan Den Abbeele et al., 2012). In cases where ‘no response’ was detected, the stimulation level was so low that there was no visible ECAP response. A recent publication by CitationBrill et al. (2009) has shown that the ECAP amplitude was significantly greater in the apex of the cochlea. Similarly, studies employing other CI systems have shown increased ECAP amplitudes in the more apical electrodes (CitationFrijns et al., 2002; CitationPolak et al., 2004). Likewise, the present study indicates that the ECAP responses were greater in the apical region of the cochlea compared to the basal region. Based on the hypothesis that each nerve fiber contributes equally to the recorded ECAP (the unitary response theory) (CitationWesten et al., 2011), we can postulate that there is a greater density of excitable neural tissue for stimulation in the apical region or that there is a higher percentage of neuronal survival in this area of the cochlea for apical stimulation electrodes. Indeed, CitationBrill et al. (2009) already proposed that a growth in ECAP responses in response to increasing stimulus could be attributed to neural survival and could be used as an indicator for the potential to better performance. The steeper slope of the ECAP growth function is also suggestive of a greater number of neuronal cell stimulation in the apical region, because the slope of the ECAP growth function is correlated with ‘an increase in the number of neurons that respond to every increment in stimulation level’ [as cited in (CitationBrill et al., 2009)]. However, as pointed out by CitationBrill et al. (2009) spiral ganglion cells do not extend into the apical region of the cochlea. The predominant population of nerve cells in the apical region is the afferent peripheral axons. However, it is possible that other neural cell populations could trigger action potentials that cannot be distinguished from the auditory nerve cell potentials. The population of nerve cells stimulated depends upon the distance between the stimulating and recording electrode. This hypothesis is based on Lai and Dillier's ‘two-component’ model (Citation2000) which posits the existence of two different neural populations, one closer and one further from the site of stimulation. This may, however, be an unlikely explanation, since Lai and Dillier themselves regarded that hypothesis as too simplistic.
The arrangement of the neurons and differences in their innervation of hair cells in the cochlea could also account for differences in the region of stimulation on the recovery inter-pulse interval and the occurrence of double peaks (CitationBerglund and Ryugo, 1987; CitationLavigne-Rebillard and Pujol, 1988). The exact mechanism of this is unknown; however it is possible that different populations of spiral ganglion cells are stimulated depending on the placement of the stimulation electrode and the electrical field generated in the cochlea upon stimulation through the CI. The neurons (Type I versus Type II) likely respond with different characteristics upon electrical stimulation (CitationKiang et al., 1982; CitationStypulkowski and van den Honert, 1984). When the apical and middle region of the cochlea were stimulated the detection of double peaks increased with increasing stimulation intensity and with the distance from the stimulating electrode. However, although double peak responses were observed in the study, the overall incidence of double peaks was much lower than single peak ECAP responses. This is not uncommon; other authors indicate that single peak responses account for more than 80% of all visible ECAP recordings (CitationCafarelli Dees et al., 2005; CitationLai and Dillier, 2000; CitationMiller et al., 2008).
CitationBrill et al. (2009) suggested that the significant increase in ECAP amplitude towards the apical region could be attributed to the narrower distance in the apex of the cochlea between the recording electrode and the stimulated neural tissue. If this were the case, it could account for the lower ECAP threshold that was observed upon stimulation of the middle region of the cochlea in contrast to the basal region of the cochlea in the present study.
Considering the smaller diameter of the apex the stimulating electrode is likely to be closer to the modiolar wall. The proximity to the modiolar wall may affect the ECAP response. Conversely, where the stimulating electrode lies further from the modiolar wall a decreased ECAP response may be observed.
We suspect that greater amplitude responses and steeper slopes at the apex of the cochlea are most likely as a result of a combination of greater neural survival and the proximity between stimulating electrode and the modiolar wall.
A lower number of visible ECAP recordings often occur when a very high stimulation levels is used and the stimulation artifact masks the ECAP signal. Another possible explanation for a low number of usable ECAP recordings is a saturation effect in individuals. Thus, a more individualized approach to stimulation parameters might have led to a higher success rate in the present study, especially if subjects had been allowed to adapt to loudness perception with the pulse rates used for ECAP measurements. The wide degree of inter-individual variation seen upon closer analyses also supports an individualized approach.
The ECAP recording could be used to determine the level of stimulation along the cochlea (CitationBrill et al., 2009), although significant variation amongst patients exist; particularly between adults and children (CitationDorman et al., 2007; CitationMcKay et al., 2013; CitationPfingst and Xu, 2005; CitationPfingst et al., 2004); there is evidence that indicates that ECAP measurements can be used to estimate the required stimulation and are a good indicator of post-operative performance (CitationCafarelli Dees et al., 2005; CitationEisen and Franck, 2004; CitationKim et al., 2011; CitationVan Den Abbeele et al., 2012). The presence of an increased ECAP amplitude and steeper slope in the apical region of the cochlea, in the present study, supports the usefulness of ECAP recordings in the apical region of the cochlea.
Disclaimer statements
Contributors All the authors contributed to the aim, concept and design of the study, to the measurements and realization of the study, tot the interpretation of results and all read, commented and approved the manuscript.
Funding None.
Conflicts of interest The study is conducted by members of HEARRING, which is logistically supported by MED-EL. The authors are also supported by a grant of MED-EL to their institutions.
Ethics approval This study is approved by the Ethical Committee of the Antwerp University Hospital of Antwerp as coordinating IRB.
References
- Abbas, P.J., Brown, C.J., Etler, C.P. 2006. Electrophysiology and device telemetry. In: Waltzman S.B., Roland J.T., Jr., (eds.) Cochlear implants. 2nd ed. New York, Stuttgart: Thieme Medical Publishers, p. 96–109.
- Abbas, P.J., Brown, C.J., Shallop, J.K., Firszt, J.B., Hughes, M.L., Hong, S.H. et al. 1999. Summary of results using the nucleus CI24M implant to record the electrically evoked compound action potential. Ear and Hearing, 20: 45–59. doi: 10.1097/00003446-199902000-00005
- Bahmer, A., Peter, O., Baumann, U. 2010a. Recording and analysis of electrically evoked compound action potentials (ECAPs) with MED-EL cochlear implants and different artifact reduction strategies in Matlab. Journal of Neuroscience Methods, 191: 66–74. doi: 10.1016/j.jneumeth.2010.06.008.
- Bahmer, A., Polak, M., Baumann, U. 2010b. Recording of electrically evoked auditory brainstem responses after electrical stimulation with biphasic, triphasic and precision triphasic pulses. Hearing Research, 259: 75–85. doi: 10.1016/j.heares.2009.10.003.
- Battmer, R.D., Dillier, N., Lai, W.K., Weber, B.P., Brown, C., Gantz, B.J., et al. 2004. Evaluation of the neural response telemetry (NRT) capabilities of the nucleus research platform 8: initial results from the NRT trial. International Journal of Audiology, 43(Suppl. 1): S10–S15.
- Berglund, A.M., Ryugo, D.K. 1987. Hair cell innervation by spiral ganglion neurons in the mouse. Journal of Comparative Neurology, 255: 560–70. doi: 10.1002/cne.902550408
- Botros, A., Psarros, C. 2010. Neural response telemetry reconsidered: I. The relevance of ECAP threshold profiles and scaled profiles to cochlear implant fitting. Ear and Hearing, 31: 367–379. doi: 10.1097/AUD.0b013e3181c9fd86.
- Brill, S., Müller, J., Hagen, R., Möltner, A., Brockmeier, S.J., Stark, T., et al. 2009. Site of cochlear stimulation and its effect on electrically evoked compound action potentials using the MED-EL standard electrode array. BioMedical Engineering OnLine, 8: 40. doi: 10.1186/1475-925X-8-40.
- Brown, C.J., Abbas, P.J., Gantz, B. 1990. Electrically evoked whole-nerve action potentials: data from human cochlear implant users. The Journal of the Acoustical Society of America, 88: 1385–1391. doi: 10.1121/1.399716
- Cafarelli Dees, D., Dillier, N., Lai, W.K., von Wallenberg, E., van Dijk, B., Akdas, F., et al. 2005. Normative findings of electrically evoked compound action potential measurements using the neural response telemetry of the Nucleus CI24M cochlear implant system. Audiology and Neurotology, 10: 105–116. doi: 10.1159/000083366
- Cohen, L.T., Saunders, E., Richardson, L.M. 2004. Spatial spread of neural excitation: comparison of compound action potential and forward-masking data in cochlear implant recipients. International Journal of Audiology, 43: 346–55. doi: 10.1080/14992020400050044
- Dorman, M.F., Sharma, A., Gilley, P., Martin, K., Roland, P. 2007. Central auditory development: evidence from CAEP measurements in children fit with cochlear implants. Journal of Communication Disorders, 40: 284–94. doi: 10.1016/j.jcomdis.2007.03.007
- Eisen, M.D., Franck, K.H. 2004. Electrically evoked compound action potential amplitude growth functions and HiResolution programming levels in pediatric CII implant subjects. Ear and Hearing, 25: 528–538. doi: 10.1097/00003446-200412000-00002
- Erixon, E., Rask-Andersen, H. 2013. How to predict cochlear length before cochlear implantation surgery. Acta Oto-Laryngologica, 133: 1258–1265. doi: 10.3109/00016489.2013.831475.
- Franke-Trieger, A., Jolly, C., Darbinjan, A., Zahnert, T., Murbe, D. 2014. Insertion depth angles of cochlear implant arrays with varying length: a temporal bone study. Otology & Neurotology, 35: 58–63. doi: 10.1097/MAO.0000000000000211.
- Franke-Trieger, A., Murbe, D. 2015. Estimation of insertion depth angle based on cochlea diameter and linear insertion depth: a prediction tool for the CI422. European Archives of Oto-Rhino-Laryngology, 272: 3193–3199. doi: 10.1007/s00405-014-3352-4
- Frijns, J.H., Briaire, J.J., de Laat, J.A., Grote, J.J. 2002. Initial evaluation of the Clarion CII cochlear implant: speech perception and neural response imaging. Ear and Hearing, 23: 184–197. doi: 10.1097/00003446-200206000-00003
- Kiang, N.Y., Rho, J.M., Northrop, C.C., Liberman, M.C., Ryugo, D.K. 1982. Hair-cell innervation by spiral ganglion cells in adult cats. Science, 217: 175–177. doi: 10.1126/science.7089553
- Kim, J.R., Kim, L.S., Jeong, S.W., Kim, J.S., Chung, S.H. 2011. Recovery function of electrically evoked compound action potential in implanted children with auditory neuropathy: preliminary results. Acta Oto-Laryngologica, 131: 796–801. doi: 10.3109/00016489.2011.560187.
- Klop, W.M., Hartlooper, A., Briare, J.J., Frijns, J.H. 2004. A new method for dealing with the stimulus artefact in electrically evoked compound action potential measurements. Acta Oto-Laryngologica, 124: 137–143. doi: 10.1080/00016480310016901
- Lai, W.K., Dillier, N. 2000. A simple two-component model of the electrically evoked compound action potential in the human cochlea. Audiology and Neurotology, 5: 333–345. doi: 10.1159/000013899
- Lavigne-Rebillard, M., Pujol, R. 1988. Hair cell innervation in the fetal human cochlea. Acta Oto-Laryngologica, 105: 398–402. doi: 10.3109/00016488809119492
- McKay, C.M., Chandan, K., Akhoun, I., Siciliano, C., Kluk, K. 2013. Can ECAP measures be used for totally objective programming of cochlear implants? Journal of the Association for Research in Otolaryngology, 14: 879–90. doi: 10.1007/s10162-013-0417-9
- Miller, C.A., Brown, C.J., Abbas, P.J., Chi, S.L. 2008. The clinical application of potentials evoked from the peripheral auditory system. Hearing Research, 242: 184–197. doi: 10.1016/j.heares.2008.04.005.
- Pfingst, B.E., Xu, L. 2005. Psychophysical metrics and speech recognition in cochlear implant users. Audiology and Neurotology, 10: 331–41. doi: 10.1159/000087350
- Pfingst, B.E., Xu, L., Thompson, C.S. 2004. Across-site threshold variation in cochlear implants: relation to speech recognition. Audiology and Neuro-Otology, 9: 341–352. doi: 10.1159/000081283
- Polak, M., Hodges, A.V., King, J.E., Balkany, T.J. 2004. Further prospective findings with compound action potentials from Nucleus 24 cochlear implants. Hearing Research, 188: 104–116. doi: 10.1016/S0378-5955(03)00309-5
- Stypulkowski, P.H., van den Honert, C. 1984. Physiological properties of the electrically stimulated auditory nerve. I. Compound action potential recordings. Hearing Research, 14: 205–223. doi: 10.1016/0378-5955(84)90051-0
- Van Den Abbeele, T., Noel-Pertroff, N., Akin, I., Caner, G., Olgun, L., Guiraud, J., et al. 2012. Multicentre investigation on electrically evoked compound action potential and stapedius reflex: how do these objective measures relate to implant programming parameters? Cochlear Implants International, 13: 26–34. doi: 10.1179/1754762810Y.0000000001.
- van den Honert, C., Stypulkowski, P.H. 1984. Physiological properties of the electrically stimulated auditory nerve. II. Single fiber recordings. Hearing Research, 14: 225–243. doi: 10.1016/0378-5955(84)90052-2
- Westen, A.A., Dekker, D.M., Briaire, J.J., Frijns, J.H. 2011. Stimulus level effects on neural excitation and eCAP amplitude. Hearing Research, 280: 166–176. doi: 10.1016/j.heares.2011.05.014.
- Wolfe, J., Schafer, E.C. 2010. Programming Cochlear Implants. San Diego, Oxford, Brisbane: Plural Publishing.
- Würfel, W., Lanfermann, H., Lenarz, T., Majdani, O. 2014. Cochlear length determination using Cone Beam Computed Tomography in a clinical setting. Hearing Research, 316: 65–72. doi: 10.1016/j.heares.2014.07.013.