
Abstract
Objectives: To report on electrode array measurements for the Nucleus® CI532 Slim Modiolar Electrode device including: ECAP thresholds, electrode impedances, and psychophysical comfort levels, as well as speech perception results pre- and post-operatively and standardized evaluations of quality of life.
Methods: Forty-four subjects were implanted with the CI532. Electrically evoked compound action potential (ECAP) thresholds and impedances were measured using automatic Neural Response Telemetry intra-operatively, at activation and at six months post implant. Pre- and post-operative measures of words in quiet and sentences in noise were made in multiple languages. Quality of life was assessed using The Speech Spatial Qualities questionnaire (SSQ) and Glasgow Benefit Inventory (GBI).
Results: Intra-operative ECAP thresholds were recorded successfully from 90% of electrodes tested. ECAP thresholds varied across the array and a post-hoc Dunn’s test showed that median thresholds for electrodes E1–E13 were significantly greater than those for E17–E22 (all P < 0.001). Impedances increased significantly between surgery and activation. Speech recognition scores for words in quiet and sentences in noise showed a significant improvement for the group at six months, when using the cochlear implant, compared with pre-operative performance (P < 0.001). There was a significant increase compared to pre-operative ratings for all sections of the SSQ at six months post activation (P < 0.001). The GBI gave scores significantly above zero for the ‘general’ subscale and total score.
Conclusion: Objective ECAP and impedance measures for this new electrode array were as expected and similar to results reported for other array types. Speech perception and quality of life improved significantly following implantation.
Trial registration: ClinicalTrials.gov identifier: NCT02392403.
Introduction
Cochlear implants are a safe and effective treatment for severe to profound hearing loss (Bond et al., Citation2009). The first multi-channel devices were implanted in 1970 and since then, technological improvements in both speech processor and electrode array design have contributed towards improved outcomes for implant recipients (Lazard et al., Citation2012). The electrode array design characteristics are a key component of any cochlear implant device. Although current arrays may vary in properties such as length and stiffness, they can largely be categorized into two main groups: straight arrays designed to be positioned along the lateral wall of the scala tympani, and curved arrays designed to be positioned closer to the modiolus (perimodiolar).
There are known advantages related to perimodiolar positioning within the cochlea. If the electrode contacts are situated closer to the target spiral ganglion cells (SGCs), the current levels required to produce a behavioral threshold and comfort level are lower than for an array positioned along the lateral wall (Cohen et al., Citation2006; Filipo et al., Citation2008; Jeong et al., Citation2015; Lathuilière et al., 2016; Parkinson et al., Citation2002). Data suggests that reducing the distance to the stimulation target results in more localized stimulation, providing superior place-pitch spectral discrimination (Basta et al., Citation2010; Hughes and Stille, Citation2008), and improved speech perception outcomes (Holden et al., Citation2013).
Objective measures, in the form of electrically evoked compound action potentials (ECAP), can be used as a measure of the efficacy of electrical stimulation (Venail et al., Citation2015). Nowadays, most cochlear implant systems include software which allows one to record ECAPs easily, postoperatively or intra-operatively, using the electrode array to provide both the stimulation and recording electrode. In Cochlear Ltd. devices the process used is called Neural Response Telemetry (NRT™). The ECAP thresholds recorded help to determine the current required to produce a neural response, and can act as a guide to establishing subjective threshold and comfort levels for speech processor programing (Kaplan-Neeman et al., Citation2004; Pedley et al., Citation2007; Potts et al., Citation2007). The threshold of the evoked response represents the lowest current level required to stimulate cochlear neural elements and depends on many factors, including the scalar position of the stimulating electrodes. Some studies have shown that it can even be used as an indicator for translocation of the electrode array into the scala vestibuli, and electrode position within the scala tympani (ST), with lower ECAP thresholds in perimodiolar arrays compared with straight arrays (Mittman et al., Citation2015; Muller et al., Citation2015; Poley et al., Citation2015; Telmesani and Said, Citation2015; Venail et al., Citation2015). It is important that the electrode is inserted into the correct scala, as the insertion of the array into the ST without dislocation into the scala vestibuli has been associated with better speech perception outcomes (Aschendorff et al., Citation2007; Carlson et al., Citation2011; Finley et al., Citation2008).
The Nucleus CI532 cochlear implant offers a new Slim Modiolar Electrode array (SME) coupled to the established receiver stimulator of the CI500 series devices. The electrode carrier is designed to get into close contact with the modiolar wall. Aschendorff et al. (Citation2017) evaluated the surgical aspects of implanting this device and used flat-panel volume CT scanning to assess the position of the electrode array. Scalar localization within the scala tympani was enabled in all cases and, in general, good medial position was shown, with short electrode to modiolus distances. Subjects were divided into three groups based on the distance of the array to the modiolus in the first half of the basal turn: ‘Good’ where there appeared to be little or no dark area, indicating fluid-filled scala between the array and modiolus; ‘Moderate’ where there was dark area seen on both sides; and ‘Poor’ where the array appeared to touch the lateral wall. The device position was assessed as moderate to good in 30 out of 44 cases, with poorer placement resulting when the electrode was inserted past the first marker (Aschendorff et al., Citation2017).
This paper reports the objective electrode array measurements for CI532 device (ECAP thresholds and electrode impedance data) along with postoperative subjective comfort levels, collected as part of the same study. Speech perception results pre- and post-operatively are also reported; as well as subjective evaluations using the Speech Spatial Qualities questionnaire (SSQ) and Glasgow Benefit Inventory (GBI).
Methods
Subjects were prospectively recruited prior to surgery and were implanted with the new Nucleus CI532 with the SME array. Aschendorff et al. (Citation2017) reported on the surgical outcomes, including the positioning of the device within the cochlea using computed tomography, subjective assessment of perimodiolar placement, and results of a surgical questionnaire. This paper reports on device characteristics (electrode impedance, stimulation levels, and ECAP thresholds recorded intra- and postoperatively) within the same group of subjects. Pre- and post-operative speech perception scores and subjective sound quality measures are also reported.
The clinical investigation was conducted in accordance with the Declaration of Helsinki (2013), the ISO 14155-2011 standard and any regional or national regulations. Local ethics approvals were obtained for each center as appropriate. Subjects gave their informed consent to participate in the investigation and received standard clinical follow-up in addition to any study-specific evaluations. The study was registered as NCT02392403 on the ClinicalTrials.gov protocol and results system prior to starting.
Subjects
Forty-five research subjects, who met the inclusion criteria, and who were willing to undergo all the procedures required for the study, including a postoperative CT scan, were recruited in seven European clinics and one Australian clinic. Subjects were recruited consecutively from April 2015, and recruitment continued for a five-month period. Subjects were required to be a minimum of eighteen years of age at the time of implantation according to local criteria, a conventional candidate for cochlear implantation with a perimodiolar electrode array, and a native speaker in the local language used to assess clinical performance. There was no restriction placed on the amount of residual hearing in the contralateral ear, and CI candidates with asymmetrical hearing loss were included. Subjects were excluded if anatomical findings might compromise the normal insertion and functioning of a cochlear implant, if there was evidence of hearing loss prior to five years of age, and if they had a cochlear implant in the contralateral ear or were previously implanted in either ear.
Patients were 23 females and 22 males implanted with the CI532. Mean age at implantation was 60.7 years (SD 14.6), range 24–89 years and mean duration of hearing loss was 23 years (SD 16 years), range 1–59 years. Etiology is shown in and was unknown in 33 cases. Hearing loss was progressive in 38 cases, sudden in five cases and congenital in two cases. 28 subjects had a symmetrical bilateral severe to profound loss and five a symmetrical bilateral moderate to severe loss. Twelve patients had an asymmetric loss with a difference of >30 dB HL between ears, and six of these had none or mild hearing loss in the non-implanted ear. One patient had revision surgery due to a tip fold-over and the device was replaced with a Nucleus CI512. This patient was withdrawn from the study in accordance with the study protocol.
Table 1 Etiology of hearing loss across both ears in the 45 subjects
Electrode and surgery
Subjects were implanted with the CI532, SME device. This is a pre-curved, perimodiolar electrode, in which the pre-curved shape is kept straight by a thin external sheath prior to insertion. It has a reduced diameter compared to the Contour Advance electrode of 0.5 mm at the position of the most basal electrode, reducing to 0.4 mm at the apex. The electrode is first ‘loaded’ into the sheath by pulling it back with respect to the sheath. Then the electrode and sheath are introduced into the cochlea. Once the sheath is fully inserted (to about 5.5 mm) the electrode can then be further advanced into the cochlea through the sheath, such that it will follow the curvature of the scala tympani as described in the physician’s guide. Once fully inserted, the sheath is retracted and discarded. Three ‘markers’ are visible, proximal to the stimulating contacts, which are used to indicate insertion depth. All other aspects of the surgery were conducted according to the surgeon’s preference and local practice. Intra-operative imaging (X-ray, or low-resolution ConeBeam CT) was performed in nearly all cases to verify correct placement of the electrode array, and postoperative CT in all cases. Further details are to be found in Aschendorff et al. (Citation2017).
Objective measures
Intra-operative electrode impedances were measured using the Cochlear Custom Sound version 4 software, and were conducted in the operating theater after the device was implanted before final closure of the wound flap. Electrode impedance measures were repeated at activation and at six months post-surgery.
ECAP thresholds were either measured intra-operatively, or at the activation appointment, or both, using Cochlear’s AutoNRT program (van Dijk et al., Citation2007). For this electrophysiological measurement, each active electrode was stimulated with a pulse width of 25 µs/phase using MP1 as the reference electrode. Recording was performed at an intra-cochlear electrode which was two contacts apart from the stimulating electrode, and using MP2 as the reference electrode.
The protocol stated that intra-operative measurements should be attempted on every electrode. Arrays where measures on only a subset of electrodes had been attempted were excluded, rather than estimating the profile based on the subset.
Psychoacoustics
Comfortable stimulation levels (C) were recorded at activation, and at six months post-surgery. C levels were measured according to the specific standards participating clinics, which included fitting methods using ECAP thresholds as a basis for setting initial levels. Stimulus rate and duration were set at the default values of 25 µs/phase and 900 pps, and were altered only on the basis of patient feedback, or if voltage compliance thresholds were exceeded.
Audiometry
Speech recognition was measured pre-operatively, and at three and six months post activation, using the centers’ usual tests, as specified below. Two listening conditions were evaluated; ‘Implanted ear’ using a hearing aid or the CI speech processor alone in one ear, with the contralateral ear plugged or masked, and ‘Best aided’ using two hearing aids or the CI speech processor plus contralateral hearing aid. Thirty-five subjects wore a contralateral hearing aid.
CNC words presented at 60 dB SPL (Peterson and Lehiste, Citation1962) were used in Australia, Lafon monosyllabic words at 60 dB SPL (Courtade, Citation1966) in France and Spain, and Freiburg monosyllables presented at 70 dB SPL (Hahlbrock, Citation1953) in Germany. Phoneme and word scores were calculated for each measure. For testing in noise, CUNY (Boothroyd et al., Citation1985), MBAA2 (Marx et al., Citation2011), CID (Silverman and Hirsh, Citation1955) and OLSA (Wagener et al., Citation1999) sentences were presented at a fixed 10 dB signal-to-noise ratio (SNR), with speech at 65 dB SPL. Babble was used as competing noise, except for the OLSA sentences, where OLSA noise was used. Scores were recorded for the number of words correct. Speech and noise were presented simultaneously from one speaker placed at one meter directly in front of the subject.
Unaided pure-tone air-conduction hearing thresholds were measured using headphones pre-operatively, at one-month post-surgery, and at six months post activation, for both ears at standard octave-spaced test frequencies. Thresholds >80 dB HL at 125 Hz, >90 dB HL at 250 Hz and >120 dB for the other test frequencies, were marked NR (no response).
Questionnaires
The speech, spatial, qualities (SSQ) questionnaire was completed pre-operatively and at six months post activation (Nobel and Gatehouse, Citation2004). The Glasgow Benefit Inventory (GBI) questionnaire was administered at six months post-activation (Robinson et al., Citation1996).
The SSQ is designed to measure a range of hearing disabilities across several domains. It is divided into three sections which assess speech hearing (14 questions), spatial hearing (17 questions) and the quality of hearing, such as ease of listening, and the naturalness, clarity of speech (18 questions). Responses are given on a rating scale of zero to ten, where zero generally indicates incapability in the situation, and ten, perfect ability. Ratings are averaged per subscale, and across all 49 questions. It was administered in written form at both visits. Subjects were unable to see their previous response when answering for the second time.
The Glasgow Benefit Inventory (GBI) is a generic patient-recorded outcome measure and is designed for use once post-intervention, as a measure of change related to a specific surgical or medical intervention. It consists of 18 questions answered using a five-point Likert scale, addressing change in health status post any intervention. The responses are then scaled and averaged to give a score with a range −100 (poorest outcome) through 0 (no change) to +100 (best outcome). Twelve questions focus on general changes in health status, three questions relate to the amount of social support needed and three questions address changes in physical health status. The questionnaire was completed by the subjects themselves in a written format.
Statistics
The sample size was determined based on the parameters of the surgical data, as reported in the Aschendorff et al. (Citation2017) paper. Boxplots including means, medians, 25–75% percentiles and outliers were used to present data and its distribution.
Non-parametric Friedman tests were used to perform one-way repeated measures, analyzes of variance on ranks. Post-hoc Dunn’s tests were used for comparing levels per electrode in objective measurements, and Tukey comparisons for speech recognition over time. Otherwise, parametric t-tests or two-way RM-ANOVAs were used.
Results
Forty-four subjects received a CI532 electrode array. Of these 44, only 40 arrays had intra-operative measurements attempted on every electrode. In the other four subjects only a selection of electrodes were used, and the profile estimated based on this subset. Therefore these four arrays were excluded from further analysis of the objective measures.
Objective measures
Electrode impedances were measured in 40 out of the 44 electrode arrays in common ground (CG), monopolar1 (MP1), monopolar2 (MP2) and monopolar1+2 (MP1+2) stimulation modes, but only reported for MP1+2 as this is the clinical default for sound processing. In the results are shown for measures made intra-operatively, at activation and after 6 months. MP1+2 mode impedances varied significantly at each measurement interval (Friedman tests, all P < 0.001) across the electrode array but within ∼1 kΩ; impedances were generally lowest in the mid part of the array (i.e. electrodes 8–12, , post-hoc Dunn’s tests, P < 0.05). Impedances increased significantly across the array by ∼2 kiloohms (kΩ) between surgery and activation, then reduced again by ∼1 kΩ for apical electrodes 16–21, from activation to 6 months (RM-ANOVA, factors visit and electrode and electrode-by-visit, all P < 0.001. However, data were not normally distributed).
Figure 1 Postoperative MP1 + 2 impedances measured intra-operatively (n = 40), at activation (n = 39) and at the 6 month follow-up (n = 33). The median is indicated with a solid mid line and the mean, a square. The boxes show the 25–75th percentile interval and the whiskers the 5–95 percentile intervals. Outliers are shown as individual points.
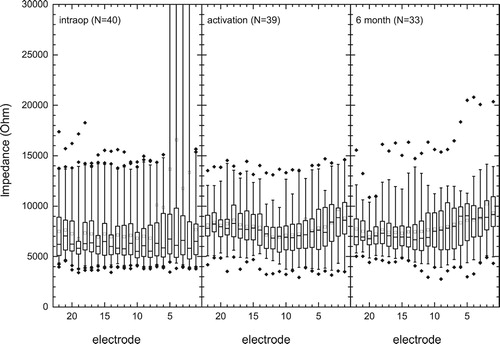
Intra-operatively, there were 11 open circuit (OC) electrode contacts (>30 kΩ) and no short-circuits among a total of 946 electrodes (<1%): Ten of these were between electrodes 1 and 5 and one on electrode 7. Impedance measurements at the activation visit indicated that all but two OCs resolved. There was no further change at the six-month follow-up. One case showed consistently high post-activation impedances of 10–20 kΩ, for all modes of stimulation across the array (e.g. upper outlier points, ).
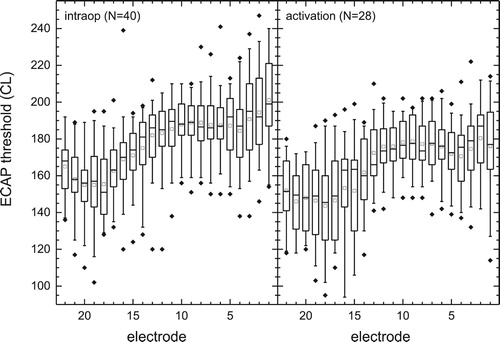
Intra-operative ECAP thresholds were obtained for 791 electrodes of 40 tested arrays (90%) and are summarized in . Thresholds could not be obtained in a slightly higher number of electrode arrays in the area of the five most basal contacts, however, some of these were electrode contacts that displayed open circuit values intra-operatively. Median intra-operative ECAP thresholds varied significantly across the array from a minimum of 151 CL (E18) to a maximum of 199 CL (E1) (Friedman Test, with subject as a random factor and electrode as the dependent variable, χ2[21] = 301.1, P < 0.001). A post-hoc analysis was applied using the Dunn’s test. This test looks for groups of electrodes with similar and different levels and the results showed that the median threshold for electrodes E1–E13 were significantly greater than those for E17–E22 (all P < 0.05). The study protocol did not specify that ECAP measurements should be made at activation; however a subset of 28 subjects had ECAP thresholds measured at activation. A similar pattern of threshold differences across the array was seen at activation as intra-operatively: Comparing ECAP thresholds per electrode, for a subgroup with measures intra-operatively and at activation, indicated a significant overall decrease of ∼12 CL units (2-way RM-ANOVA, factors electrode and visit P < 0.001, no significant interaction P = 0.53).
Figure 2 ECAP thresholds intra-operatively (n = 40) and at activation (n = 28) in current levels. Intra-operative thresholds for electrodes E1–E13 were significantly greater than those for E17–E22 (P < 0.001). The median is indicated with a solid mid line and the mean, a square. The boxes show the 25–75th percentile interval and the whiskers the 5–95 percentile intervals. Outliers are shown as individual points.
Psychoacoustics
Ten of a total of 968 electrodes were not active in sound processor programs at the activation visit: Four E1, two E2, one E3, one E7, and two E22. One subject had E1 reactivated at the 3-month visit. Then one subject had E1-E3 deactivated at the 3-month visit, which may have been due to basal contacts being very close to, or at the round window opening and therefore causing unpleasant sensations. In another case, E1 and E22 were never activated due to T and/or C levels being very different compared to those for adjacent contacts.
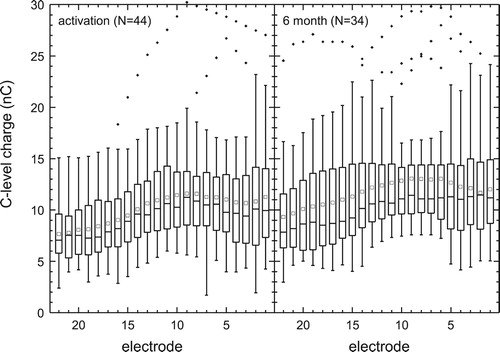
A pulse width wider than the default of 25 µs/phase was required for five subjects at first fitting due to compliance levels being exceeded and for seven subjects at six months. Therefore, for better inter-individual comparison, the C levels were converted to charge per phase (nC) as in . The C and T levels obtained at activation varied significantly by electrode (Friedman test, χ2[21] = 336.2 and 401.5, respectively, P < 0.001) as they did at 6 months (χ2[21] = 241.6 and 263.0, respectively, P < 0.001) with, for example, levels for E17–E22 being 15–20 CL lower than those for E7–E12 (Dunn’s tests, P < 0.05). We did not compare between sessions because for 10/44 patients T and C levels were not retested due to having satisfactory performance and/or perception, making any changes over time difficult to interpret.
Figure 3 C levels of the patients map at activation (n = 44) and at 6 months (n = 34) in charge (nC) per phase. The median is indicated with a solid mid line and the mean, a quadrat. The boxes show the 25–75th percentile interval and the whiskers the 5–95 percentile intervals. Outliers are shown as individual points.
Audiometry
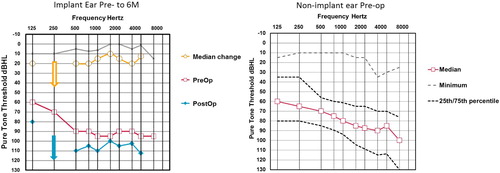
shows pre- and postoperative hearing thresholds in the implanted ear and pre-operative hearing in the contralateral ear. Due to the current inclusion criteria of the clinics participating, the study population had a wide range of residual hearing in the contralateral ear with some subjects having an asymmetrical hearing loss and near normal hearing in the non-implanted ear. There was little residual pre-operative hearing in the implanted ear with median thresholds for 250, 500 and 1000 Hz of 90 dB HL and for 125 and 250 Hz at vibrotactile levels. Postoperatively, median thresholds decreased by 10–20 dB and from 0 to 10 dB at the 25th percentile. The 75th percentile could not be calculated as more than 25% of subjects lost all measurable hearing.
Figure 4 The left hand graph shows median pre- and post-operative threshold levels in the 44 implant ears. Arrows indicate levels exceeded audiometer limits (i.e. 250 Hz at 6 months). Gray/faint lines indicate 25th percentile change in thresholds. The right hand graph shows a summary of pre-operative pure-tone threshold data the 44 contra-lateral ears. Open squares are medians, gray dashed line minima and dotted black lines inter-quartile range. Maximum thresholds were above audiometer limits.
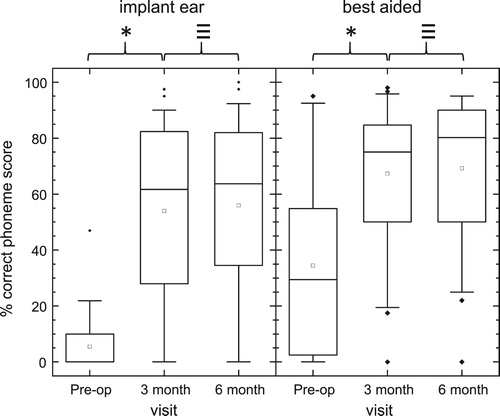
Due to the nature of the study, speech perception measures were collected in multiple languages. A summary of phoneme recognition scores for words presented in quiet is given in . Scores increased significantly from pre-op to three and to six months post-activation for implant ear and best-aided conditions (Friedman tests, df = 2, χ2 > 31, P < 0.001; post-hoc Tukey comparisons, P < 0.05). Median scores increased from pre-op to six months post activation by 60 percentage points for the implant ear and 49 percentage points for the best-aided condition. Due to the high levels of residual hearing in the contralateral ear for some subjects, percentage gains in speech perception measures were analyzed individually. Seventy-five percent of subjects obtained greater than 20 percentage point gain in word recognition scores for the implant ear (pre-op to 6 months activation), and 55% of subjects for the best-aided condition. Twenty percentage points was chosen as the measure for clinical significance, based on the UK Cochlear Implant Study Group criteria of candidacy for unilateral cochlear implantation in post linguistically deafened adults (UK Cochlear Implant Study Group, Citation2004).
Figure 5 Phoneme scores for monosyllabic words presented in Quiet to Implant ear alone (left graph, n = 41) and to both ears ‘best-aided’ (right graph, n = 40). The median is indicated with a solid mid line and the mean, a square. The boxes show the 25–75th percentile interval and the whiskers the 5–95 percentile intervals. Outliers are shown as individual points. *Significant difference (Post-hoc Tukey tests, P < 0.05), ≡ no significant difference.
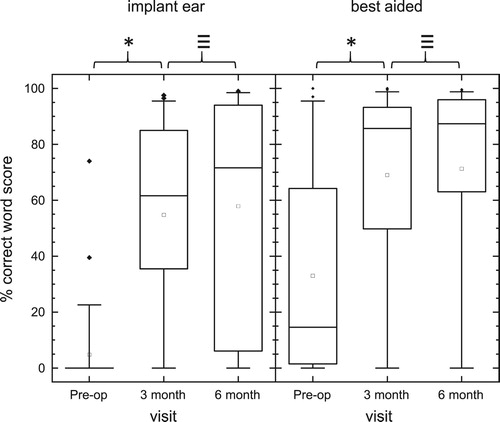
Word recognition scores for sentences presented in +10 dB SNR competing noise are given in . Scores increased significantly from Pre-op to three and to six months post-activation for implant ear, and best-aided conditions (Friedman tests, df = 2, χ2 > 31, P < 0.001; post-hoc Tukey comparisons, P < 0.05). Median scores at six months post activation increased by 71 percentage points for the implant ear compared to pre-op scores, and 73 percentage points for the best-aided condition. Sixty-five percent of subjects obtained greater than 20 percentage point gain in sentence recognition in noise for the implant ear (Pre-op to 6 months activation) and 52% of subjects for the best-aided condition.
Figure 6 Word scores for sentences presented in 10 dB SNR to the Implant ear alone (left graph, n = 41) and to both ears ‘best-aided’ (right graph, n = 42). The median is indicated with a solid mid line and the mean, a square. The boxes show the 25–75th percentile interval and the whiskers the 5–95 percentile intervals. Outliers are shown as individual points. *Significant difference (Post-hoc Tukey tests, < 0.05), ≡ no significant difference.
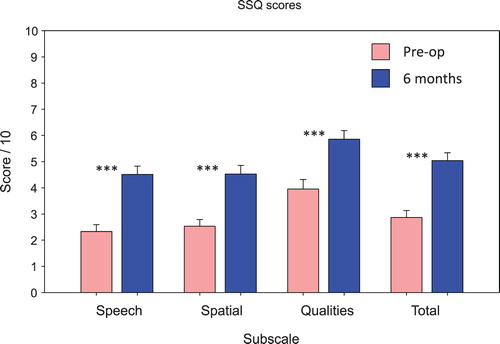
Thirty-nine completed data sets out of the 45 subjects were available for both pre and postoperative SSQ ratings. A series of paired t-tests showed that there were significant increases compared to pre-operative ratings in the Speech, Spatial, and Quality subscales, and the Total scale of the SSQ, at six months post activation (t [38] = 5.2–8.5, P < 0.001) ().
Figure 7 Scores for the speech, spatial, qualities (SSQ) questionnaire subscales and total score pre-operatively and at the six-month follow-up. Thirty-nine out of the 44 subjects provided completed questionnaires for both assessment visits. ***Significant difference, P < 0.001.
The GBI was completed by 42 subjects, and gave scores significantly above zero for the general sub-scale, and total score, indicating a measurable benefit was provided after implantation. Scores on Social and Physical subscales were on average close to zero, indicating no change ().
Table 2 Summary of results from the Glasgow Benefit Inventory for each sub section, as well as total score. Forty-two out of the 45 subjects provided a completed questionnaire
Discussion
The device characteristics reported for this new electrode array were in line with expectations. Intra-operative ECAP responses were recorded successfully from 791 out of the 880 (90%) electrodes tested. This was consistent with previous data, indicating that ECAP responses can be recorded intra- and postoperatively with Auto-NRT for around 95% electrodes (van Dijk et al., Citation2007). A very small proportion of electrodes showed open circuits at surgery (1%), which would have made recording an ECAP response impossible. It was hypothesized that the initial indications of open circuits were produced by air bubbles around the electrode contacts which resulted in high impedances, possibly related to the sheath surrounding the array. These then dissipated, and at activation all but two of these open circuits had resolved. It is the opinion of some of the authors that the presence of air bubbles directly after insertion of this electrode array is common, and average impedance values at the follow-up visits were similar to those reported for other electrode types (Spivak et al., Citation2011; Venail et al., Citation2015). Impedance values increased between the intra-operative and postoperative recordings, as anticipated. This is thought to be due to the local tissue response producing fibrosis around the electrode array contacts (Migirov et al., Citation2011; Nadol and Eddington, Citation2004).
Intra-operative ECAP thresholds were significantly lower for the apical electrodes than those at the base. This has been observed in many other studies (Gordin et al., Citation2009; Lathuilliere et al., Citation2017; Spivak et al., Citation2011; Telmesani and Said, Citation2015), and may be due to differences between the apex and base in neuronal survival or density (Lai and Dillier Citation2009; Polak et al. Citation2004). There have been some suggestions that the radial distance between the modiolar wall and the electrode may also be a factor (Saunders et al., Citation2002; Spivak et al. Citation2011). Animal studies have shown that the ECAP threshold is lowered as the electrode contacts move closer to the modiolus (Shepherd et al., Citation1993). However, clinical studies in patients have failed to conclusively show that lower ECAP thresholds correlate with position of the electrode array within the scala tympani (Venail et al., Citation2015). Data reported in Aschendorff et al. (Citation2017) shows that there were no dislocations from the scala tympani in this sample, so we know that any changes in ECAP thresholds or impedances were not a result of dislocation into scala vestibuli, as observed by Mittman et al. (Citation2015) and Venail et al. (Citation2015).
Stimulation levels and impedances were also lower at the apex of the array than at the base; however, the three measures are linked. T and C levels were not individually measured for all subjects, but the map profile was defined by the ECAP thresholds. Venail et al. (Citation2015) showed that the ECAP threshold depends on the squared impedance of the electrode and electrodes with a higher impedance had a moderate, but significant reduction in ECAP thresholds (average reduction 0.11 C.L. per kΩ), regardless of the type of array or depth of insertion. Lower impedances at the apex have been reported in other studies, and the larger volume of space at the base of the cochlea relative to the volume of the electrode array may enable a larger volume of fibrotic tissue to form, affecting the current flow (Hughes et al., Citation2001; Lathuilliere et al., Citation2017).
The ECAP thresholds for the group decreased between intra-operative and activation visits. This effect was also reported in adults implanted with a Nucleus Freedom device by Spivak et al. (Citation2011), who also used Auto-NRT to make the threshold measurements. The reduction in ECAP thresholds is most likely due to physiological changes within the cochlea following the surgery.
Speech perception results showed a significant improvement for the group at six months, when using the cochlear implant compared with pre-operative performance. Individual scores indicated that at least 75% of subjects improved their word and sentence scores postoperatively for both the implanted ear, and the best-aided performance, meeting the success criteria for implantation suggested by Leigh et al. (Citation2016). A significant proportion of subjects also improved their speech perception scores by at least 20% (the threshold for a clinically significant improvement suggested by the UK CI study group, Citation2004) in the implanted ear in quiet (75%), and in noise (50%). The median pre-operative speech recognition score in noise for implanted ears was zero, and the median 6-month postoperative score was 71% correct, indicating a substantial restoration of auditory performance to the deafened ears for the group (). Subject-reported outcome measures supported these findings, with a significant improvement for the group in global SSQ scores, as well as for each subscale. The mean gain in scores for the speech scale was 2.2 points, for the spatial scale 2 points, and for the qualities scale 1.9 points. These reported values were all very close to the mean SSQ gains recently reported in a larger cohort study of 291 unilaterally implanted adult subjects, consecutively recruited from multiple countries (Lenarz et al., Citation2017). Values obtained in the GBI also indicated that an overall benefit had been provided by the implant: The mean GBI total score was 28 ± 6, with significant gains in the general health subscale, but no improvement in the physical and social subscales. These scores were in line with the GBI scores reported for cochlear implantation in other studies (Aimoni et al., Citation2016; Guerra-Jimenez et al., Citation2016; Lassalette et al., Citation2015; Sanchez-Cuadrado et al., Citation2015). These objective and subjective improvements are interesting to note in the context of a study group where subjects had considerable hearing in the contralateral ear, with the upper quartile for preoperative speech scores in the best-aided condition >50% for monosyllabic words, and >60% for sentences in noise.
Conclusions
In summary, objective ECAP and impedance measures for this new electrode array were as expected and similar to results reported for other array types. The improvements seen in speech perception and quality of life measures support the implantation of adults with good pre-operative speech scores in the non-implanted ear.
Disclaimer statements
Contributors None.
Funding The study was sponsored by Cochlear Ltd.
Conflicts of interest Author CJ was project manager for the study and is employed by Cochlear, the manufacturer of the Nucleus CI532 cochlear implant. The remaining authors report no conflict of interest.
Ethics approval Obtained for all participating centers.
Acknowledgments
We would like to thank the numerous other persons who assisted in working with patients and collecting data for this study. We also thank the editorial team.
Related Research Data
References
- Aimoni, C., Ciorba, A., Hatzopoulos, S., Ramacciotti, G., Mazzoli, M., Bianchini, C. et al. 2016. Cochlear implants in subjects over age 65: quality of life and audiological outcomes. Medical Science Monitor, 28(22):3035–3042. doi: 10.12659/MSM.896869
- Aschendorff, A., Briggs, R., Brademann, G., Helbig, S., Hornung, J., Lenarz, T. et al. 2017. Clinical investigation of the nucleus slim modiolar electrode. Audiology and Neurotology, 22(3):169–179. doi: 10.1159/000480345
- Aschendorff, A., Kromeier, J., Klenzner, T., Laszig, R. 2007. Quality control after insertion of the nucleus contour and contour advance electrode in adults. Ear and Hearing, 28(2 Suppl):75S–79S. doi: 10.1097/AUD.0b013e318031542e
- Basta, D., Todt, I., Ernst, A. 2010. Audiological outcome of the pull-back technique in cochlear implantees. The Laryngoscope, 120(7):1391–1396. doi: 10.1002/lary.20942
- Bond, M., Mealing, S., Anderson, R., Elston, J., Weiner, G., Taylor, R.S. et al. 2009. The effectiveness and cost-effectiveness of cochlear implants for severe to profound deafness in children and adults: a systematic review and economic model. Technology Assessment, 13(44):1–330.
- Boothroyd, A., Hanin, L., Hnath, T., 1985. A sentence test of speech perception: Reliability, set equivalence and short term learning (internal report RCI10). New York City: University of New York.
- Carlson, M.L., Driscoll, C.L., Gifford, R.H., Service, G.J., Tombers, N.M., Hughes-Borst, B.J., et al. 2011. Implications of minimizing trauma during conventional cochlear implantation. Otology and Neurotology, 32(6):962–968. doi: 10.1097/MAO.0b013e3182204526
- Cohen, L.T., Saunders, E., Knight, M.R., Cowan, R.S. 2006. Psychophysical measures in patients fitted with contour and straight nucleus electrode arrays. Hearing Research, 212(1–2):160–175. doi: 10.1016/j.heares.2005.11.005
- Courtade, N. 1966. The Lafon test and retardation. Revue de Laryngologie – Otologie – Rhinologie, 87(3):181–201.
- Filipo, R., Mancini, P., Panebianco, V., Viccaro, M., Covelli, E., Vergari, V. et al. 2008. Assessment of intracochlear electrode position and correlation with behavioural thresholds in CII and 90K cochlear implants. Acta oto-Laryngologica, 128(3):291–296. doi: 10.1080/00016480701633733
- Finley, C.C., Holden, T.A., Holden, L.K., Whiting, B.R., Chole, R.A., Neely, G.J. et al. 2008. Role of electrode placement as a contributor to variability in cochlear implant outcomes. Otology and Neurotology, 29(7):920–928. doi: 10.1097/MAO.0b013e318184f492
- Gordin, A., Papsin, B., James, A., Gordon, K. 2009. Evolution of cochlear implant arrays result in changes in behavioral and physiological responses in children. Otology and Neurotology, 30(7):908–915. doi: 10.1097/MAO.0b013e3181b236b0
- Guerra-Jiménez, G., Ramos De Miguel, Á., Falcón González, J.C., Borkoski Barreiro, S.A., Pérez Plasencia, D., Ramos Macías, Á. 2016. Cochlear implant evaluation: prognosis estimation by data mining system. The Journal of International Advanced Otology, 12(1):1–7. doi: 10.5152/iao.2016.510
- Hahlbrock, K.H. 1953. Über sprachaudiometrie und neue wörterteste. Arch Obienheilk, 162:394.
- Holden, L.K., Finley, C.C., Firszt, J.B., Holden, T.A., Brenner, C., Potts, L.G., et al. 2013. Factors affecting open-set word recognition in adults with cochlear implants. Ear and Hearing, 34(3):342–360. doi: 10.1097/AUD.0b013e3182741aa7
- Hughes, M.L., Stille, L.J. 2008. Psychophysical versus physiological spatial forward masking and the relation to speech perception in cochlear implants. Ear and Hearing, 29(3):435–452. doi: 10.1097/AUD.0b013e31816a0d3d
- Hughes, M.L., Vander Werff, K.R., Brown, C.J., Abbas, P.J., Kelsay, D.M., Teagle, H.F., et al. 2001. A longitudinal study of electrode impedance, the electrically evoked compound action potential, and behavioral measures in nucleus 24 cochlear implant users. Ear and Hearing, 22(6):471–486. doi: 10.1097/00003446-200112000-00004
- Jeong, J., Kim, M., Heo, J.H., Bang, M.Y., Bae, M.R., Kim, J., et al. 2015. Intraindividual comparison of psychophysical parameters between perimodiolar and lateral-type electrode arrays in patients with bilateral cochlear implants. Otology and Neurotology, 36(2):228–234. doi: 10.1097/MAO.0000000000000672
- Kaplan-Neeman, R., Henkin, Y., Yakir, Z., Bloch, F., Berlin, M., Kronenberg, J., et al. 2004. NRT-based versus behavioral-based map: a comparison of parameters and speech perception in young children. Journal of Basic and Clinical Physiology and Pharmacology, 15(1–2):57–69. doi: 10.1515/JBCPP.2004.15.1-2.57
- Lai, W., Dillier, N. 2009. Neural adaptation and the ECAP response threshold: a pilot study. Cochlear Implants International, 10(Suppl 1):63–67. doi: 10.1179/cim.2009.10.Supplement-1.63
- Lassaletta, L., Calvino, M., Sánchez-Cuadrado, I., Pérez-Mora, R.M., Gavilán, J. 2015. Which ear should we choose for cochlear implantation in the elderly: The poorer or the better? Audiometric outcomes, quality of sound, and quality-of-life results. Acta Oto-Laryngologica, 135(12):1268–1276. doi: 10.3109/00016489.2015.1077391
- Lathuilière, M., Merklen, F., Piron, J.P., Sicard, M., Villemus, F., Menjot de Champfleur, N., et al. 2017. Cone-beam computed tomography in children with cochlear implants: the effect of electrode array position on ECAP. International Journal of Pediatric Otorhinolaryngology, 92: 27–31. doi: 10.1016/j.ijporl.2016.10.033
- Lazard, D.S., Vincent, C., Venail, F., Van de, Heyning, P., Truy, E., Sterkers, O., et al. 2012. Pre-, per- and postoperative factors affecting performance of postlinguistically deaf adults using cochlear implants: a new conceptual model over time. PLoS One, 7(11):e48739. doi: 10.1371/journal.pone.0048739
- Leigh, J.R., Moran, M., Hollow, R., Dowell, R.C. 2016. Evidence-based guidelines for recommending cochlear implantation for postlingually deafened adults. International Journal of Audiology, 55(Suppl 2):S3–S8. doi: 10.3109/14992027.2016.1146415
- Lenarz, T., Muller, L., Czerniejewska-Wolska, H., Vallés Varela, H., Orús Dotú, C., Durko, M. et al. 2017. Patient-related benefits for adults with cochlear implantation: a multicultural longitudinal observational study. Audiology and Neurotology, 22(2):61–73. doi: 10.1159/000477533
- Marx, M., James, C., ElHadi, T., Martin-Dupont, N., Laborde, M.-L., Deguine, O., et al. 2011. Probability of improvement after cochlear implantation as a function of preoperative residual hearing. Audiology and Neurootology, 16(suppl 1): 19–20.
- Migirov, L., Kronenberg, J., Volkov, A. 2011. Local tissue response to cochlear implant device housings. Otology and Neurotology, 32(1):55–57. doi: 10.1097/MAO.0b013e3182009d5f
- Mittmann, P., Todt, I., Wesarg, T., Arndt, S., Ernst, A., Hassepass, F. 2015. Electrophysiological detection of intracochlear scalar changing perimodiolar cochlear implant electrodes: a blinded study. Otology and Neurotology, 36(7):1166–1171. doi: 10.1097/MAO.0000000000000766
- Müller, A., Hocke, T., Mir-Salim, P. 2015. Intraoperative findings on ECAP-measurement: normal or special case? International Journal of Audiology, 54(4):257–264. doi: 10.3109/14992027.2014.969410
- Nadol, J.B., Jr, Eddington, D.K. 2004. Histologic evaluation of the tissue seal and biologic response around cochlear implant electrodes in the human. Otology and Neurotology, 25(3):257–262. doi: 10.1097/00129492-200405000-00010
- Noble, W., Gatehouse, S. 2004. Interaural asymmetry of hearing loss, Speech, Spatial and Qualities of Hearing Scale (SSQ) disabilities, and handicap. International Journal of Audiology, 43(2):100–114. doi: 10.1080/14992020400050015
- Parkinson, A.J., Arcaroli, J., Staller, S.J., Arndt, P.L., Cosgriff, A., Ebinger, K. 2002. The nucleus 24 contour cochlear implant system: adult clinical trial results. Ear and Hearing, 23(21 Suppl):41S–48S. doi: 10.1097/00003446-200202001-00005
- Pedley, K., Psarros, C., Gardner-Berry, K., Parker, A., Purdy, S.C., Dawson, P. et al. 2007. Evaluation of NRT and behavioral measures for mapping elderly cochlear implant users. International Journal of Audiology, 46(5):254–262. doi: 10.1080/14992020601014979
- Peterson, G., Lehiste, I. 1962. Revised CNC lists for auditory tests. Journal of Speech and Hearing Disorders, 27:62–70. doi: 10.1044/jshd.2701.62
- Polak, M., Hodges, A.V., King, J.E., Balkany, T.J. 2004. Further prospective findings with compound action potentials from Nucleus 24 cochlear implants. Hearing Research, 188(1–2):104–116. doi: 10.1016/S0378-5955(03)00309-5
- Poley, M., Overmyer, E., Craun, P., Holcomb, M., Reilly, B., White, D. et al. 2015. Does pediatric cochlear implant insertion technique affect intraoperative neural response telemetry thresholds? International Journal of Pediatric Otorhinolaryngology, 79(9):1404–1407. doi: 10.1016/j.ijporl.2015.05.038
- Potts, L.G., Skinner, M.W., Gotter, B.D., Strube, M.J., Brenner, C.A. 2007. Relation between neural response telemetry thresholds, T- and C-levels, and loudness judgments in 12 adult nucleus 24 cochlear implant recipients. Ear and Hearing, 28(4):495–511. doi: 10.1097/AUD.0b013e31806dc16e
- Robinson, K., Gatehouse, S., Browning, G.G. 1996. Measuring patient benefit from otorhinolaryngological surgery and therapy. Annals of Otology, Rhinology, and Laryngology, 105: 415–422. doi: 10.1177/000348949610500601
- Sanchez-Cuadrado, I., Lassaletta, L., Perez-Mora, R., Muñoz, E., Gavilan, J. 2015. Reliability and validity of the Spanish Glasgow Benefit Inventory after cochlear implant surgery in adults. European Archives of Oto-Rhino-Laryngology, 272(2):333–336. doi: 10.1007/s00405-013-2844-y
- Saunders, E., Cohen, L., Aschendorff, A., Shapiro, W., Knight, M., Stecker, M. et al. 2002. Threshold, comfortable level and impedance changes as a function of electrode-modiolar distance. Ear and Hearing, 23(21 Suppl):28S–40S. doi: 10.1097/00003446-200202001-00004
- Shepherd, R.K., Hatsushika, S., Clark, G.M. 1993. Electrical stimulation of the auditory nerve: the effect of electrode position on neural excitation. Hearing Research, 66(1):108–120. doi: 10.1016/0378-5955(93)90265-3
- Silverman, S., Hirsh, I. 1955. Problems related to the use of speech in clinical audiometry. Annals of Otology, Rhinology, and Laryngology, 64(4):1234–1244. doi: 10.1177/000348945506400424
- Spivak, L., Auerbach, C., Vambutas, A., Geshkovich, S., Wexler, L., Popecki, B. 2011. Electrical compound action potentials recorded with automated neural response telemetry: threshold changes as a function of time and electrode position. Ear and Hearing, 32(1):104–113.
- Telmesani, L.M., Said, N.M. 2015. Effect of cochlear implant electrode array design on auditory nerve and behavioral response in children. International Journal of Pediatric Otorhinolaryngology, 79(5):660–665. doi: 10.1016/j.ijporl.2015.02.008
- UK Cochlear Implant Study Group. 2004. Criteria of candidacy for unilateral cochlear implantation in postlingually deafened adults I: theory and measures of effectiveness. Ear and Hearing, 25(4):310–335. doi: 10.1097/01.AUD.0000134549.48718.53
- van Dijk, B., Botros, A., Battmer, R., Begall, K., Dillier, N., Hey, M., Lai, W.K, Lenarz, T., Laszig, R., Morsnowski, A., Müller-Deile, J., Psarros, C., Shallop, J., Weber, B., Wesarg, T., Zarowski, A., Offeciers, E. 2007. Clinical results of AutoNRT, a completely automatic ECAP recording system for cochlear implants. Ear and Hearing, 28(4):558–570. doi: 10.1097/AUD.0b013e31806dc1d1
- Venail, F., Mura, T., Akkari, M., Mathiolon, C., Menjot de Champfleur, S., Piron, J.P., et al. 2015. Modeling of auditory neuron response thresholds with cochlear implants. Biomed Research International, Volume 2015: Article ID 394687–10 pages.
- Wagener, K., Brand, T., Kollmeier, B. 1999. Entwicklung und Evaluation eines Satztests für die deutsche Sprache III: Evaluation des Oldenburger Satztests (Development and evaluation of a German sentence test part III: Evaluation of the Oldenburg sentence test). Zeitschrift für Audiologie, 38, 86–95.