Abstract
Abrasion of a concrete pavement is habitually due to the continued movement of wheels on the concrete surface. Starting from the theoretical model developed by Horszczaruk, this paper proposes the development of a new model, which expresses the material volume loss as a function of the work done by the wheel and the total abrasion time, as well as the composition of the concrete. For the verification of the model, samples of an experimental pavement were used, in which a dry shaking treatment with corundum had been applied. Finally, with this model an engineer could predict the concrete pavement lifetime from the parameters of the concrete and its traffic characteristics.
1. Introduction
Wear phenomena occur between the pavement and moving vehicles by scraping or by the sliding action due to the friction between the wheels and the surface, mainly influencing the skidding properties of the pavement and its resistance to traffic loads in a specific traffic situation, i.e. studded tyres. The weakness of concrete to abrasion causes a reduction in its thickness and the increase of dusting on the pavement surface. The reduction in thickness of concrete slabs causes an increase in the tensile stress which leads to tensile cracking that shortens the service life of concrete. Moreover, dusting or wear of pavements can diminish their sliding resistance (Hosking, Citation1992).
It has been reported that the abrasion resistance of concrete depends mainly on variables such as strength, aggregate properties, the finishing method of concrete surface and type of hardeners or toppings. Different authors state that abrasion resistance increases with an increase in strength (Hadchti and Carrasquillo, Citation1988) and that this characteristic is the most important governing factor for the abrasion resistance of concrete (Laplante, Aitcin, & Vezina, Citation1991). Naik, Singh, & Hossain Citation(1994) indicated that the relationship between the compressive strength and the abrasion resistance is linear. However, Atis Citation(2002) stated that this relationship was hyperbolic.
Kettle and Sadegzadeh Citation(1987) reported that in the case of a concrete pavement, concrete strength or curing type are not be very important in assessing the abrasion resistance if some kind of surface finishing exists; for example dry-shaking treatments such as corundum or quartz particles applied to fresh concrete and then floated and trowelled. Thus, it can be said that the types of finishing and curing practices also have a large influence on the abrasion resistance (Naik, Singh, & Hossain, Citation1995; Ytterburg, Citation1971) improving it considerably when they are correctly applied. These authors obtained results (Kettle & Sadegzadeh, Citation1987) in which there were almost no differences between concrete pavements when tested after 28 days and after 6 months from when they were made.
Therefore, to analyse the abrasion resistance of concrete, it will not be sufficient simply to specify an appropriate concrete compression strength. Sadegzadeh et al. (1987) studied the relationship between the surface microstructure and abrasion resistance of concrete. The results indicated that different surface finishing techniques produced distinct pore structures and hardness within a thick on the surface of a few millimetres, and the abrasion resistance was greatly affected by the pore structure of the surface zone. Thus, the cement paste at the surface of the concrete (1–2 millimetres) can be made stronger and denser by hard trowelling, because this pushes the cement particles closer together, allowing the hydrated cement to hold each individual aggregate particle very tightly. Omoregie, Gutschow, & Russell Citation(1994) found that in the case of the abrasion of concrete by means of the water effect, the hard trowelled pavement showed better abrasion resistance.
Where very high abrasion resistance is required, special aggregates or surface treatment, such as metallic or mineral aggregate hardeners, may be needed, which are either added to the surface or used as a topping, and then floated and trowelled in. The use of these materials is cost-effective and produces a surface that is highly resilient to wear and impact stresses, typically encountered in warehouses and manufacturing plants.
The degree to which a concrete floor where a hardener has been used, can resist abrasion will vary widely, depending on which hardener is used. Three of the most commonly used aggregates are quartz, iron and emery, which should be placed as defined in ACI 302 (ACI, Citation1992). The problem with surface hardeners is that they provide initial abrasion improvement, but once the hardening layer is penetrated, the abrasion resistance reverts to that of an untreated concrete.
The majority of the abrasion resistance tests for concrete consist in measuring the effects of its destruction by means of sand blasting or the penetration depth with dry friction (Omoregie et al., Citation1994; Ytterburg, Citation1971). There are other types of tests which simulate abrasion in conditions similar to those that the material under study will undergo, ASTM C 1138-97 (Citation1997), for example, causing the abrasion by means of a mixture of aggregates and water. In this paper, the method considered to approximate most to the effect of a wheel on a pavement has been used.
The main objective of this paper is to develop a model which can be used for future research in estimation of the service life of a concrete pavement, providing engineers with a theoretical tool to assess the evolution of the pavement's surface characteristics under traffic loads.
2. Experimental methods and materials
2.1. Abrasion test
The abrasion resistance test was carried out according to UNE-EN 1338 (Citation2004). The test device consists of a steel wheel, 200 mm diameter and 70 mm wide, rotating at 75 rpm, which is in contact with the surface of the sample under study. shows the components of the used test equipment.
Figure 1. Description of test equipment.
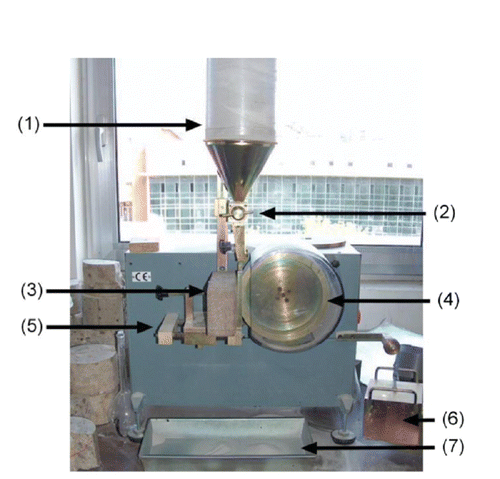
In , Equation(1) is the deposit of abrasive; Equation(2)
the abrasive stopcock; Equation(3)
a test specimen; Equation(4)
the steel wheel; Equation(5)
instrumented with LVDT wagon; Equation(6)
the plummet; Equation(7)
the plate to receive the used abrasive.
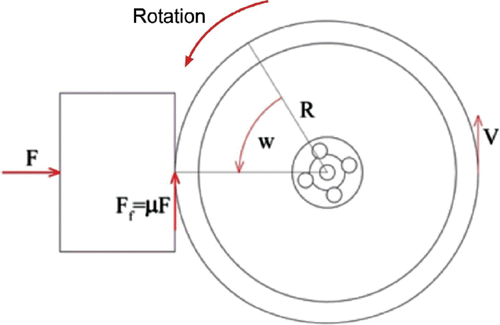
The strength between the wheel and the sample is gravity related (). During the process, an abrasive agent composed of white fused alumina is dropped between the wheel and the sample. The abrasive agent discharge rate is of 2.5 l/min and the total test duration was 2 minutes. The equipment was equipped with two LVDT transducers and a data-logger placed in a sample bracket so that they could measure its displacement over time, which correspond to the penetration depth of the wheel in the pavement.
Figure 2. Forces distribution where F is the weight, μ is the kinetic coefficient of friction between the pavement and wheel, R is the radius of the wheel, W is the angular velocity and V the tangential velocity.
2.2. Materials
To confirm the theoretical results, an experimental concrete pavement was prepared. The quantity of cement used to make the concrete slab was 315 kg/m3 CEM IV/A 32.5 N/SR (according the EN 197-1), with a water to cement ratio of 0.48. The maximum aggregate size was 20 mm. A fluidificant additive was added to obtain a fluid slump. This pozzolanic cement contains a mass fraction of 84% clinker, 14% flying ash, 1% gypsum and 1% filler. The specific Blaine surface was of 368.5 m2/kg and the density was 2845 kg/m3. The initial setting time of cement paste as described in ASTM C 191-04 (Citation2004), with a water: cement ratio of 0.29 to obtain “normal consistency” was 191 minutes.
The compressive strength of mortar made with this cement at 28 days curing was 46.5 MPa.
The total aggregate distribution used in the concrete was designed by: (i) the percent aggregate retained method, so that the total combined aggregate particles have a tolerance with an acceptable size distribution, and by (ii) combined aggregate distribution, with the purpose of obtaining an appropriate mixture for the manual placement of concrete (Harrison, Citation2004). The aggregate distribution proportions are given in .
Table 1. Combined aggregate distribution.
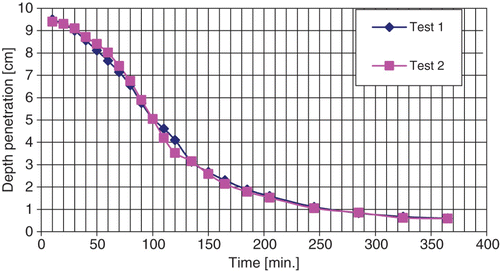
The pavement surface was repeatedly power finished, which involves floating and trowelling operations carried out with a 5 KW power float. The dry-shaking treatment agent applied to the concrete was made up of a mixture of 50 kg silica quartz, 25 kg corundum and 35 kg Portland cement. shows the curve of workability of the concrete determined by a sphere of 4.6 cm radius of and a mass of 395.7 g released with energy of 20.45 N according to the procedure described in García, Castro-Fresno and Polanco (Citation2008a, Citationb) and García, Fresno, & Polanco (2008c).
Figure 3. Workability of the concrete by depth penetration–time curve.
2.3. Experimental procedure
The consistency of concrete measured with the Abram's cone method was plastic. After it was placed, the mixture was first vibrated, then flattened and finally trowelled. When the pavement was completely finished, it was covered with a plastic membrane to avoid humidity loss. After 24 hours, the samples were extracted from the pavement or removed from the moulds in the case of those for the compressive tests and half of them kept at room temperature 20°C and 98% humidity for 28 days. Then they were soaked until constant weight was achieved and then subjected to abrasion for 2 minutes. The abrasive substance was made up of white fused alumina. For each pavement studied, six different plummets were used with weights of 2, 6.4, 10, 14 and 18.4 kg. Each weight was used five times. Tests were carried out on the flat face of cylindrical samples of 15 cm diameter and 6.3 cm height.
3. Results
shows changes of abraded volume (v a ) as a function of the force exerted by the plummet weight (v a =f (F)) varying with time. The abraded volume was calculated taking into account the dimensions of the wheel and its penetration depth in the concrete. In this is shown as a function of the plummet weight; volume decreases are the average of the five specimens obtained from the same slab. Penetration depth data were subjected to noise due to the test apparatus vibrations. Moreover, note that the noise due to the measurement of the penetration depth (LVDT) due to the test apparatus vibrations is appreciable when abraded volume is calculated.
Figure 4. Volume changes for different plummet weights.
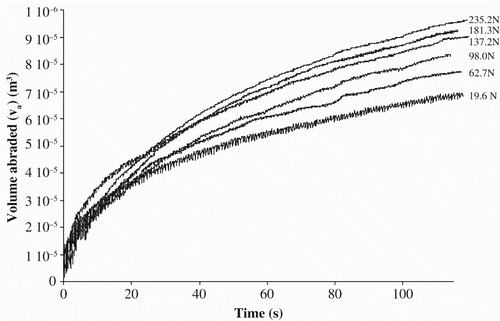
Moreover, it can be appreciated that this noise is higher when the plummet weight is lower. Furthermore, the existence of two different stages in the concrete abrasion ratio development can be appreciated when depth penetration is transformed to volume abraded. The first (25 seconds approximately and m penetration) has a higher abrasion rate than the second.
According to the procedure established in the standard UNE-EN 13892-4 (Citation2004), in order to measure the width of the abrasion traces between the longitudinal outer limits, a line can be drawn in the centre of the trace, perpendicular to its centreline and the distance measured. However, abraded volume can be calculated by determination of the volume of a non-stick plastic material after applied in the gap resulting from the erosion of the surface of the specimen (Thomas, Lombillo, Polanco, Villegas, Setién, & Biezma, Citation2010). Also, the volume can be calculated from the depth penetration in concrete, measured with the transducers. This last method is the most appropriate when penetration is low. The results obtained with these tests and from the model show that abrasion rate in a concrete pavement is proportional to the force between the wheel and the abraded material and to the application time. Similar results with other materials were obtained.
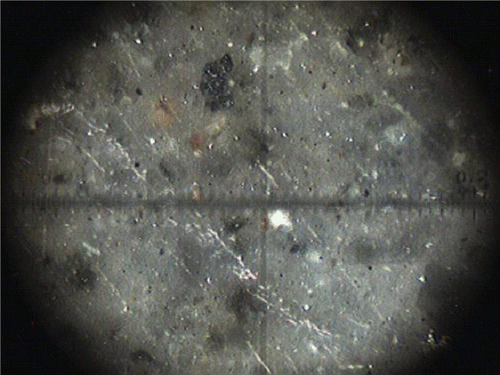
shows an optical micrograph of the studied pavement surface. The existence of a layer (effect of polishing) can be observed. That causes the brightness of the pavement. Under it, quartz and corundum particles can be appreciated.
Figure 5. Optical micrograph (200 magnifications) of the studied pavement surface.
4. Theoretical model
The theoretical model for concrete abrasion was based on the one developed by Horszczaruk Citation(2004) for abrasive wear of concrete in hydraulic structures, modifying it, so that it could be adapted to the test machine used. In this model, concrete is considered to be a uniform substance made of individual particles, which bond together because the energy applied to them is less than the activation energy (E a ) needed to break the existing bonds. When concrete is abrasion tested, energy is added to the system up to a certain level (E a ), so that interaction strengths disappear and a grinded zone materialises.
In accordance with Maxwell and Boltzmann distribution law the probability pi of the particular molecule being in an energetic state E m is described by the following formula:
Considering a system of N + 1 particles, to obtain a energy between E
i
and E
i
+dE
i
, with a total energy E
m
, the probability will be proportional to the number of states for which E
i
lies between E
i
and E
i
+dE
i
. The energy in the rest of the concrete lies between E
m
−E
i
and E
m
−E
i
−E
i
. Therefore the following formula, equivalent to EquationEquation (6) obtained by Horszczaruk Citation(2004), is obtained:
In this test device, the machine power will be proportional to the force of the plummet on the sample and the wheel and to the tangential velocity of the abrasion wheel. Moreover, as the angular velocity of the wheel is constant, the force between the wheel and the sample will be equal to the sliding resistance of concrete:
As the energy applied to the system by the wheel will be approximately constant over time and proportional to the test machine power (P) energy variation with time, E i will be:
If the volume of concrete abraded is v
a
and the initial volume of the sample studied is v
0 (note that this parameter is used to make the formula adimensional), EquationEquation (3) becomes:
Abrasion of a concrete pavement will depend on the abrasion resistance of the different surface hardeners added as toppings and on the mortar quality. Thus it can be considered that different a values exist in the pavement, each of them depending on the local properties of the concrete (behaviour of the aggregate, water/cement ratio, porosity or density):
Wear variation with time for all the materials in concrete is given by:
As shown in , the total abraded volume of concrete is the sum of two sections, so hypothesising that both are continuous:
Figure 6. Plot of changes of relative volume with time.
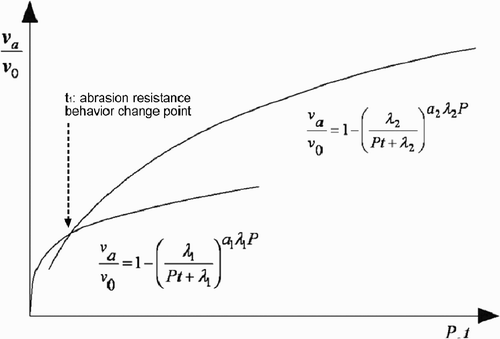
Referring to the time when the curve loses continuity as t
1 and integrating EquationEquation (10) from 0 to t
1, the formula which describes the increment of the abraded pavement during the first stage will be obtained:
Then, integrating EquationEquation (11) from t
1 to t, the formula which describes the increment of the abraded zone during the second stage is obtained:
Combining EquationEquations (5) and Equation(14)
, the following equation is obtained, which shows the relationship between the plummet weight and the abraded volume of concrete. This is the formula for the abrasion surface of concrete (EquationEquation (15)
):
As Horszczaruk Citation(2004) shows, a value is given by:
5. Analysis of the results
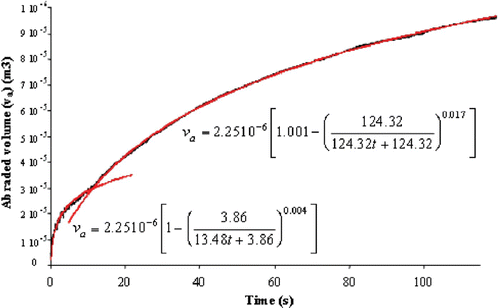
From the test results shown in , depth penetrations obtained from the transducers were transformed in the following way to obtain volume of concrete abraded (v a ) as:
shows abraded volume variation with time obtained from the mean of five tests with a constant plummet weight of 235 N. In this figure, two different parts can be observed in the abraded concrete volume variation with time. Abrasion resistance changes rapidly until a 3.5310−5 m penetration depth, probably due to the existence of a dense zone of cement matrix as an effect of the mechanical surface finishing procedure.
Figure 7. Abraded volume variation of concrete with time for a constant plummet weight of 235 N.
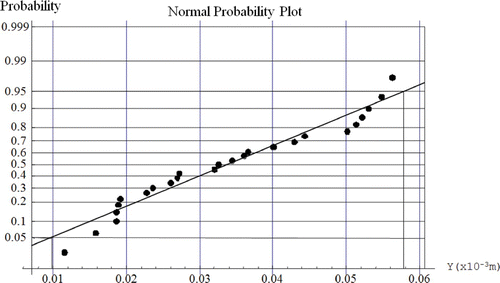
In the normal probability plot for the penetration depth at the point between the two curves () is shown for all the samples studied. In this figure, after applying Chauvenet's criteria to the data, Pearson's correlation coefficient is 0.976 and the p value exceeds 0.25, so this value will be independent of the strength between the sample and the wheel, depending only on the material studied. The 5% and 95% confidence intervals were and
m respectively and the medium depth value is
m.
Figure 8. Normal probability plot for the penetration depth at the point between the two curves shown in .
In , regression parameters for the curves in are shown. From these data, it can be deduced how parameters α and λ will determine concrete abrasion rate, evaluated from the volume variation versus time and the other test parameters, depending on factors such as the abrasion test chosen or the material characteristics. To prove the validity of the model, in the parameter v
0 has been represented in a normal probability plot. Here, Pearson's correlation coefficient is 0.953 and the p value exceeds 0.25. The 5% and 95% confidence intervals were and
m3 respectively and the medium depth value is
m3. As expected, the normal probability plot is almost linear, which confirms the hypothesis of normality; so it can be concluded that this parameter is independent of the plummet weight used. Finally, in the value λ has been represented in a normal probability plot, obtaining a Pearson's correlation coefficient of 0.953, a p value that exceeds 0.25 and a λ value of 227.01 Nm. Data dispersion is due to the material heterogeneity and to the measurement uncertainty.
Figure 9. Normal probability of the parameters of EquationEquation (18) for the parameter v
0.
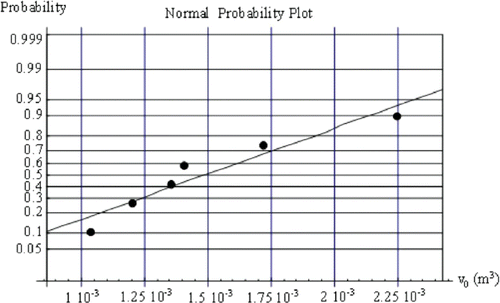
Figure 10. Normal probability of the parameters of EquationEquation (18) for the parameter λ.
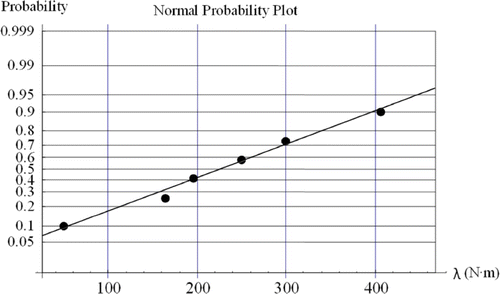
Table 2. Regression parameters of the curves shown in .
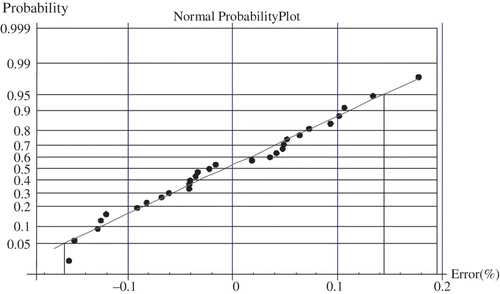
EquationEquation (17) was also applied to the abraded volume obtained at a particular time, varying force (F) by means of changes in the plummet weight. As shown in a good correlation exists between the theoretical model and the experimental data obtained. This sample shows the volume of concrete after ninety seconds of abrasion in different samples of polished pavement with different plummet weights. In this case, after applying Chauvenet's criterion to the data, Pearson's correlation coefficient is 0.991 with p-value exceeding 0.25% and the 95% confidence interval for the penetration depth error was approximately 15% of the depth in each case. In the case of the samples analysed, the correlation coefficient was always greater than 0.97 (pavements abraded for 60 seconds). Moreover, for all the abrasion times studied, there is a probability that 95% have a confidence interval greater than 26% for the penetration depth. One of the best proofs of the validity of a model is the normality of its errors, in this case, in the distribution of the error percentage is shown with regard to the model in a normal probability plot. Here, Pearson's correlation coefficient is 0.99 and the p value exceeds 0.25. As expected, the normal probability plot is almost linear, which confirms the hypothesis of normality. The distribution of errors was normal in all samples.
Figure 11. Normal probability plot of errors.
In abraded volume changes over time (v a ) are shown, depending on the force exerted by the plummet weight (v a =f(F)). In this figure, volume decreases are the average results of five samples obtained from the same slab and with the same curing type. In this figure, after applying Chauvenet's criterion to the data, the correlation coefficient was always greater than 0.994. In regression parameters for curves in are shown.
Figure 12. Change of abraded volume with one of the plummet weights studied and its confidence intervals.
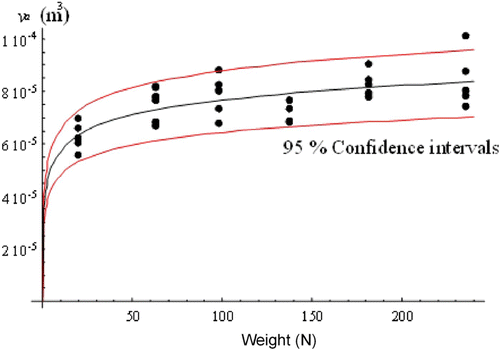
Table 3. Regression parameters for the curves shown in .
Finally, shows a three-dimensional view of the surface represented by EquationEquation (18), where it can be seen how for a particular angular velocity an increase in time will cause an increase in the abraded volume of concrete and also that increasing the force between the wheel and the concrete will cause an increase in the abrasion rate. Recently Wang and Roque Citation(2011), analysing the effects of truck tyre types on near-surface pavement responses evaluated via finite element analysis, have found that the wide-based tyre produced less damage to the pavement. The proposed model suggests a relationship between the applied force per unit area and damage to the pavement.
Figure 13. Abrasion surface of concrete. F(N); v a (m3); t (s).
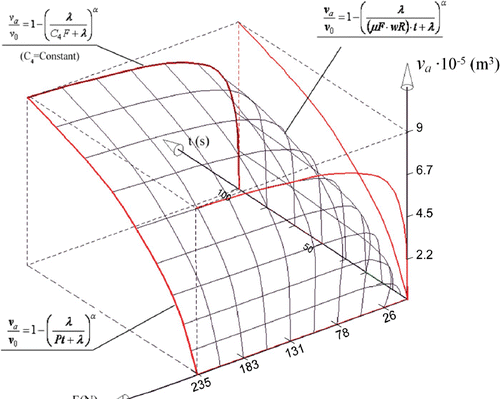
The initial point in the surface () for a material in which the abrasion process is just starting would be at the intersection of the time, force and abrasion axes. When the abrasion process takes place, this point will move through the surface as a function of the abrasion time and the strength between the concrete and the wheel. At an infinite time or force, this surface will become a plane where v a →v 0.
In general, the engineer can use the proposed model, known specific α and λ parameters of the pavement, and be able to compare the concrete pavement lifetime. In this regard, known traffic conditions (vehicle weight, speed of transit) and imposed durability conditions (maximum allowable loss of volume and lifetime) the model allows designing concrete suitable with these conditions.
6. Conclusions
In this paper a model for the study of the abrasion in concrete has been described. This model can easily be applied to pavements under real traffic conditions, simply knowing the model parameters representing the material characteristics and the traffic characteristics. New lines of research have also been proposed.
This theoretical model of abrasion has been experimentally tested for the test device used. In a similar model, made to evaluate the abrasion wear of concrete caused by the movement of rubble carried by water in hydraulic construction, Horszczaruk demonstrated, that abrasion in concrete can be defined by a single parameter depending on its composition.
EquationEquation (15) has been proposed to predict the volume abraded of the pavement. In this case, it has been demonstrated that the abrasion resistance evolution depends directly on the force and on the friction coefficient between the concrete and the wheel. The analysed case corresponds to a dry-shaking treated pavement. In this case the volume abraded presents two different behaviours that can be modelled with the different parameters of EquationEquation (15)
.
The proposed model extents the model of Horszczaruk Citation(2004) in two ways. First, the method uses greater and different forces and the use of abrasive to obtain the behaviour curves quicker. Also, the model introduces the applied force parameter. This parameter can be associated with the weight of the vehicle on the pavement.
Finally, analysis of the results shows the existence of two different zones for the abrasion resistance tests on a polished concrete pavement; the first corresponding to the mortar layer as an effect of the hard trowelling of concrete, and the second one, less resistant than the first.
Related Research Data
References
- ACI (American Concrete Institute) (1992). Committee 302. Guide for concrete floor and slab construction. ACI manual of concrete practice, ACI 302.1R-04, 302.1R-37 to 302.1R-40.
- ASTM C 1138-97. (1997). Standard test method for abrasion resistance of concrete (underwater method).
- ASTM C 191-04a. (2004). Standard test methods for time of setting of hydraulic cement by vicat needle.
- Atis , C. D. 2002 . High volume fly ash abrasion resistant concrete . Journal of Materials in Civil Engineering , 14 ( 3 ) : 274 – 277 .
- García , A. , Castro-Fresno , D. and Polanco , J. A. 2008a . Evolution of penetration resistance in fresh concrete . Cement and Concrete Research , 38 ( 5 ) : 649 – 659 .
- García , A. , Castro-Fresno , D. and Polanco , J. A. 2008b . Maturity approach applied to concrete by means of vicat tests . ACI Materials Journal , 105 ( 5 ) : 445 – 450 .
- García , A. , Fresno , D. C. and Polanco , J. A. 2008a . Effect of dry-shaking treatment on concrete pavement properties . Construction and Building Materials , 22 ( 11 ) : 2202 – 2211 .
- Hadchti , K. M. and Carrasquillo , R. L. 1988 . “ Abrasion resistance and scaling resistance of concrete containing fly ash (Research Report 481-3) ” . Austin, Texas : Center for Transportation Research, Bureau of Engineering Research, University of Texas at Austin .
- Harrison , P. J. 2004 . For the ideal slab on ground mixture . ACI Concrete International , 26 ( 3 ) : 49 – 55 .
- Horszczaruk , E. 2004 . The model of abrasive wear of concrete in hydraulic structures . Wear , 256 : 787 – 796 .
- Hosking , R. 1992 . Road aggregates and skidding , London : TRL .
- Kettle , R. J. and Sadegzadeh , M. 1987 . Field investigations of abrasion resistance . Materials and Structures , 20 ( 2 ) : 96 – 102 .
- Laplante , P. , Aitcin , P. C. and Vezina , D. 1991 . Abrasion resistance of concrete . Journal of Materials in Civil Engineering , 3 ( 1 ) : 19 – 28 .
- Naik , T. R. , Singh , S. S. and Hossain , M. M. 1994 . Abrasion resistance of concrete as influenced by the inclusion of fly ash . International Journal of Cement and Concrete Research , 24 ( 2 ) : 301 – 312 .
- Naik , T. R. , Singh , S. S. and Hossain , M. M. 1995 . Abrasion resistance of high-strength concrete made with class C fly ash . ACI Materials Journal , 92 ( 6 ) : 649 – 659 .
- Omoregie , F. A. , Gutschow , R. A. and Russell , M. L. 1994 . Comparison of cement-hardened materials for abrasion-erosion in hydraulic structures . Concrete International , 16 ( 7 ) : 47 – 50 .
- Sadeyzadeh , M. , Page , C. L. and Kettle , R. J. Surface microstructure and abrasion resistance of concrete, Cement and Concrete Research , 17 ( 4 ) 581 – 590 .
- Thomas , C. , Lombillo , I. , Polanco , J. A. , Villegas , L. , Setién , J. and Biezma , M. V. 2010 . Polymeric and cementitious mortars for the reconstruction of natural stone structures exposed to marine environments . Composites Part B: Engineering , 41 ( 8 ) : 663 – 672 .
- UNE-EN 1338. (2004). Concrete pavement blocks. Requirements and tests methods.
- UNE-EN 13892-4. (2004). Methods of test for screed materials. Part 4: Determination of wear resistance BCA.
- Wang , G. and Roque , R. 2011 . Impact of wide-based tires on the near-surface pavement stress states based on three-dimensional tire-pavement interaction model . Road Materials and Pavement Design , 12 ( 3 ) : 639 – 662 .
- Ytterburg , R. F. 1971 . Wear-resistant industrial floors of Portland cement concrete . Civil Engineering (NY) , 41 ( 1 ) : 68 – 71 .