
 ?Mathematical formulae have been encoded as MathML and are displayed in this HTML version using MathJax in order to improve their display. Uncheck the box to turn MathJax off. This feature requires Javascript. Click on a formula to zoom.
Abstract
The widespread use of Electric Vehicles (EVs) has been one of the main directions for pursuing a sustainable future of road transport in which the deployment of the associated charging infrastructures, static or dynamic, has been included as one of the main cornerstones for its success. Different electrified road (eRoad) systems which allow for dynamic charging of EVs by transferring electrical power from the road to the vehicle in-motion, either in a conductive or contactless way, are under active investigation. One of the important tasks in feasibility analysis of such infrastructure is to quantitatively assess its environmental performance and, thus, the consequential influences to the sustainability of road electrification as a whole. Having this concern in mind, in this study, a systematic LCA study is carried out in which the environmental impacts from the different life cycle stages have been calculated and compared among several promising eRoad systems. In a next step, suitable strategies can be accordingly made to minimise these impacts in a most effective way; and more importantly, the LCA results of this study can serve as one of the important bases for conducting a more comprehensive and objective evaluation of the potential environmental benefits EVs could bring.
1. Introduction
1.1. Background
Transportation infrastructure becomes sustainable when the negative environmental, social and economic impacts of using it are minimised. Given the reported high energy efficiency and zero tailpipe emission, the Electric Vehicle (EV) has been given focus as a potential solution for enhancing the sustainability in our road transportation sector. To support the huge charging demands of using electric vehicles at large-scale in the near future, an important solution emerged is the electrified road (eRoad), which allows transferring electrical power from the road to the Electric Vehicles (EVs) in-motion by using conductive or contactless power transfer systems. To implement the eRoad system, the matureness of the entire technology has to be ensured on three sides: (1) the vehicle charging; (2) the electrical grid; (3) the road infrastructure. Supposing that all the technical limitations can ultimately be removed, there is still a great need to reflect upon the original aim of pursuing the EV technology to effectively reduce the environmental impacts of our transportation system. Studies (Jorgensen, Citation2008; Pistoia, Citation2010; Poullikkas, Citation2015; van Vliet, Brouwer, Kuramochi, van den Broek, & Faaij, Citation2011; Zhou, Ou, & Zhang, Citation2013) have shown that compared to the conventional Internal Combustion Engine vehicles, EVs can reduce the energy consumption and GHG emissions significantly during the total life cycle, especially when the energy source is shifted from high GHG intensity power sources (e.g., oil, coal) to cleaner energy sources (e.g., wind and solar powers). However, these studies do not necessarily take the physical road infrastructure into account whereas, in reality, road infrastructure play an important role in the overall life cycle production of environmental impacts in the transportation sector (e.g., Butt, Citation2014; Miliutenko, Citation2012). In order to ensure high functionality of the eRoad, regular operational maintenance and rehabilitation actions will be performed throughout the operation phase. In these stages, new infrastructural materials, new on-site processes and extra waste disposals can be involved, and the consequential environmental impacts are unclear nowadays. Therefore, this study aims to conduct a study to make a quantitative assessment of the environmental impacts of the changed road construction and maintenance in an eRoad life cycle, in comparison to a traditional asphalt road. The outcomes will help decision-makers in industry organisations and governmental agencies adopt more sustainable eRoad design practices, contributing thus to the improved sustainability of our road transport sector through electrification as a whole.
1.2. Focus of the paper
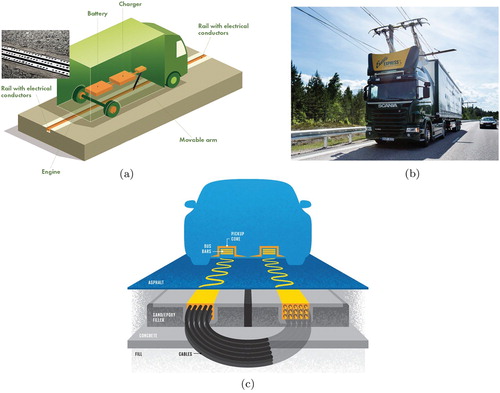
Depending on the power transfer systems, the available major eRoad technologies can be categorised into three types: (i) the conductive rail solution (Figure (a)); (ii) the conductive solution using a pantograph (Figure (b)); and (iii) the wireless solution using Inductive Power Transfer (IPT) technology (Figure (c)). Systematic Life Cycle Assessment (LCA) was conducted to evaluate the sustainability potentials of these different eRoad systems and to do so the following detailed objectives are included: (i) development of an LCA framework for detailed analyses, in which the components of the eRoad infrastructure over its lifetime are defined; (ii) inventory data on construction and maintenance operations are collected in a rational way; and (iii) detailed analysis are performed towards a good understanding of the life cycle environmental performance of the specific eRoad systems, and based on which strategies for improving the sustainability of the infrastructure as a whole are further made.
Figure 1. Typical electrified road systems: (a) Elways® solution with conductive rails (https://eroadarlanda.se/press-media); (b) eHighway® solution with pantograph (https://www.siemens.com/press) and (c) wireless solution with Inductive Power Transfer (IPT) (https://spectrum.ieee.org/transportation/advanced-cars/the-allelectric-car-you-never-plug-in).
2. Methods
This study adopts the ISO 14040 framework (Environmental Management–Life Cycle Assessment–Principles and Framework). The potential environmental impacts during a certain lifetime of the three different solutions are evaluated with an LCA model. In this model, the emissions, resources and energy of the construction, operation and rehabilitation phases are considered. As no clear ‘end of life’ exists in the pavement (Butt, Citation2014), this paper presents thus a cradle-to-gate model. This cradle-to-gate model includes the raw materials production of both asphalt and charging system, the asphalt mixing process, the construction of the eRoad, the winter maintenance operations and the rehabilitations of the road. There is a plenitude of way of assessing the environmental impacts of a system such as climate change, ozone depletion, terrestrial acidification, human toxicity, natural land transformation or fossil depletion. As climate change is related to emissions of greenhouse gases to air, in this study, the results are highlighted for climate change impacts.
2.1. Functional unit and boundaries of the model
The Functional Unit (FU) considered is a 1km highway lane constructed with the pantograph, conductive rails or embedded IPT systems, with a lifetime of 20 years. The pavement material considered is Hot Mix Asphalt (HMA) and the geographical area is restricted to Sweden. To ensure the required energy need for the processes, the energy consumed by Swedish mixing plants are considered in this model.
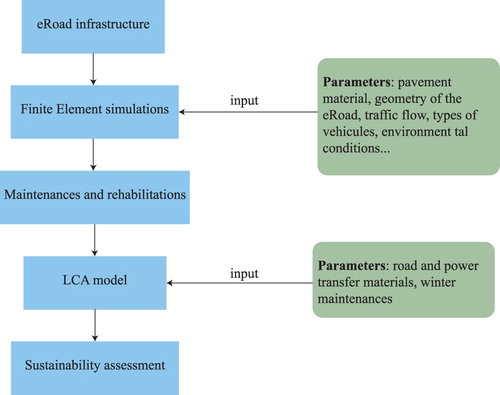
The study belongs to the transport infrastructure system including all processes and transports. The economic and social aspects of the solutions are thus ignored. Since the aim of this study is to compare the different eRoads together, the common data related to foundation, terracing, base and sub-base construction, road marking, fences and railing, road signs, lighting and traffic lights are not considered. On the other hand, since winter maintenance operations such as snow clearance, sand and salt gritting and sweeping could differ depending on the power transfer solution used, these operations are included in the model as maintenance, rehabilitation and reconstruction processes which are required for proper usage of the eRoad. The maintenances, rehabilitation and reconstruction operations ensuring the functionality of the infrastructure are determined with long-term performance predictions carried by Finite Element simulations (Chen, Balieu, & Kringos, Citation2018). For these simulations, a constitutive model including viscoelasticity, viscoplasticity and damage developed for asphalt material (Balieu & Kringos, Citation2015; Chen, Balieu, Cordoba, & Kringos, Citation2019; Chen, Balieu, & Kringos, Citation2017; Chen, Coronado, Balieu, & Kringos, Citation2018) has been used to predict the structural behaviour of the three eRoad technologies as well as the traditional road. The results of the finite element simulations are thus an input in the proposed LCA framework. For illustration purpose, the complete framework proposed for the analysis is given in Figure . Finally, as a last boundary of the model, the fuel and electricity consumption as well as the emissions of the vehicles during the operation phase are not considered in the model in order to not overshadow the results of the other phases (Butt, Citation2014).
Figure 2. Complete framework of the presented approach for sustainability assessment of eRoads.
2.2. Asphalt raw materials for the construction phase
The volume and quantity of the asphalt raw materials is firstly determined. According to the Functional Unite (FU), the dimension of the road is . The pavement structure is composed of 3 layers with different thickness. The surface (top) course is 4 cm, the binder (middle) course is 9 cm and the base (bottom) course is 10 cm. Furthermore, for the IPT and conductive rail solutions, there is a charging unit embedded in the road material; the reduced asphalt quantities are then calculated accordingly. The section of the prefabricated CU embedded in the road used with the IPT system is
cm and the size of the conductive rail system is
cm. An example of the calculation of asphalt quantities needed for the IPT solution is presented in Table . The summary of the quantity of asphalt needed for the different layers and for the different solutions is given in Figure .
Figure 3. Asphalt quantities for the three courses for different solutions. (a) Asphalt quantities for the IPT solution; (b) asphalt quantities for the pantograph solution; (c) asphalt quantities for the conductive rails solution; (d) asphalt quantities for the traditional road.
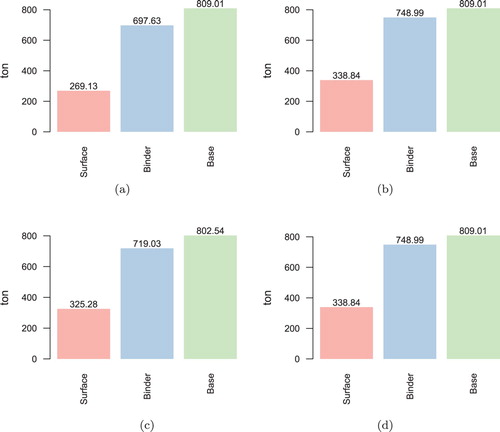
Table 1. Calculation of the asphalt quantities for the IPT solution.
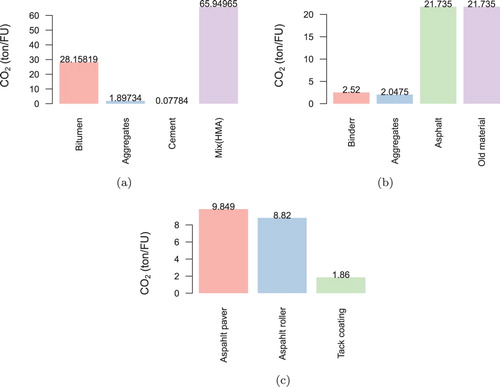
Asphalt mixture consists of aggregates, sand, gravel and a few percentage of bitumen binder. As the different courses of the pavement have different mixture-recipes, the type, volume and quantity of raw materials is calculated for each layer. Table shows the type and quantity of raw materials needed for the fabrication of the eRoad built with the pantograph solution. The impacts associated with the production of raw materials for the four different solutions are presented in Figure . In addition to the production of raw materials, Hot Mix Asphalt (HMA) is produced in a plant where aggregates are blended, dried, heated, and mixed with bitumen at high temperature (around 160°C). The
impacts associated with the use of diesel fuel and electricity necessary to perform the mixing operations are included in the proposed LCA assessment and are based on the study carried out by Stripple (Citation2001).
Figure 4. associated with the raw material quantities necessary for the construction of the pantograph solution. (a) Surface course; (b) binder course; (c) base course; (d) asphalt layer.
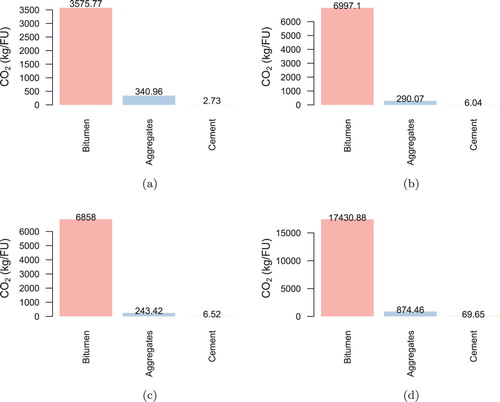
Table 2. Calculation of the raw material quantities for the surface course of the pantograph solution with their  impacts.
2.3. Charging system raw materials
For the sake of simplicity, the electrical components such as connector, capacitors embedded in the road (IPT and conductive tracks solutions) are not included in the proposed LCA model. Furthermore, since the aim of this study is to assess the impact of the road infrastructure, the power supply, distribution shelter distribution lines and power electronics (DC/HF) are not considered in this work.
2.3.1. Pantograph solution
Although the overhead charging solution does not require any component in the pavement, this technology requires the usage of pillars in steel spaced of 50 m and copper cables. Table presents the quantitiesFootnote1 of steel and copper per FU needed for the construction of the pantograph solution associated with their impacts.
Table 3. Raw material quantities for the construction of the pantograph solution with their impacts.
2.3.2. IPT solution
The solution proposed by SAET Industrial Automation Systems (SAET) and reported in KTH, QIE, POLITO (Citation2018) is used in order to build the LCA model with the inductive charging technology. In this solution, pre-cast concrete blocks containing the coils with dimensions of m are embedded in the road. The primary coil is one single winding with a rectangular shape of
cm and weight of 5.23 kg; 500 coils are needed in one FU with the IPT solution. The cross section of the coils is
cm which is deduced from the concrete volume. The summary of the quantity of raw materials per FU used for the construction of the IPT solution with the associated
impacts is given in Table .
Table 4. Raw material quantities for the construction of the IPT solution with their impacts.
2.3.3. Conductive rail solution
The elways® technology is used to assess the environmental impact of the eRoad using the conductive rail solution. In this technology, without taking into account the electronics components, the unique material embedded in the road are the steel rails. The quantity of steelFootnote2 necessary for the construction of a FU with its associated impacts is given in Table .
Table 5. Raw material quantities for the construction of the conductive rail solution with their impacts.
2.4. eRoad construction
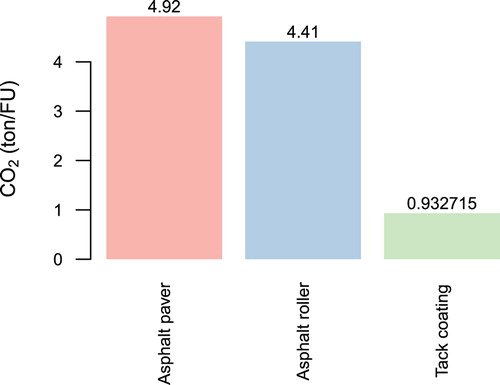
The manufactured asphalt mixture is filled into trucks or lorries and transported from the plant to the construction site, with a temperature maintained between 110°C and 120°C. Several machines and vehicles are needed for the pavement construction which can be summarised as follows: the asphalt mixture is transported to the construction area by trucks and the drivers fill them into an asphalt paver's hopper, which is preheated in order to prevent the mix from sticking to the sensitive parts of the machine. Following that, conveyors transport the asphalt through the paver to the rear, where it is uniformly distributed. Besides that, the machine couches the mixture, compact it, so as a result, the rollers behind the paver require fewer passes to achieve the specified final degree of compaction. Between the layers, bitumen emulsion is sprayed (with a bitumen sprayer) in order to ensure an adequate adhesion between the different asphalt layers. Since the paved area is similar in the four roads under investigation, the same number of machines as well as their operating times is considered in this work for the different solutions. The calculation of the paver's hopper and road rollers (finisher)is based on the study carried out by Stripple (Citation2001), in which the highest emission coming from these machines is due to the fuel consumption. The summary of the
impacts induced by the paving operations is given in Figure .
Figure 5. impacts of the paving operation per FU.
For the sake of simplicity, the impact of manufacturing coils, rails and pillars from raw material is not taken into account in this work. The transport of bitumen and aggregates to the mixing plant is assured by lorries with a size of 32 metric ton. The distances between the mixing plant to the bitumen refinery and to the aggregate quarry site are 100 and 5 km, respectively. The transport of the asphalt mixture to the construction site is also assured by 32 metric ton lorries, and the distance is assumed to be 50 km. The transport of the concrete is also done by 32 metric lorries with an assumed distance of 50 km. Finally, the transport of the coils and rails is assured by lorries with a size of 14 metric ton and the assumed distance to the construction site is 50 km. An example of the ton-kilometre of each material with their associated impacts for the pantograph solution is given in Table .
Table 6. impacts of the material transport per FU for the construction of the pantograph solution.
2.5. Winter maintenance and rehabilitation operations
In this study, the rehabilitations of the road to prevent any premature damage of the pavement as well as winter maintenance operations are considered. Because of the long-term behaviour of pavement depends on many factors, e.g. load, temperature, humidity, mixing process, construction process, ultraviolet (UV), it is very difficult to predict accurately the need of rehabilitation for a particular type of road. The rehabilitation operations are thus variable in this model and the results of the Finite Element analysis carried out by Chen, Balieu, et al. (Citation2018) will help in deciding the maintenance frequency of each eRoad solution. An example of the impacts of the raw material production needed to perform the replacement of the top layer 3 times and every layer one time during the considered life cycle of the road (20 years) on the pantograph solution is presented in Figure (a). In Figure (b), the
impacts associated with the material transport is presented. Except for the old material where the considered transport is from construction site to recycling site with a distance of 50 km, the analysis considers the same distance as the construction phase (Section 2.4) for the binder, aggregates and asphalt mixture. Finally, the
impacts associated with the paving operations needed for the considered rehabilitations is presented in Figure (c).
Figure 6. impacts associated raw material, transport and paving operations needed for the replacement of the top layer 3 times and every layer one time for the pantograph solution. (a)
impacts associated with the production of the raw material needed for the considered rehabilitation operations. (b)
impacts associated with the material transport needed for the considered rehabilitation operations. (c)
impacts associated with the paving operations needed for the considered rehabilitations.
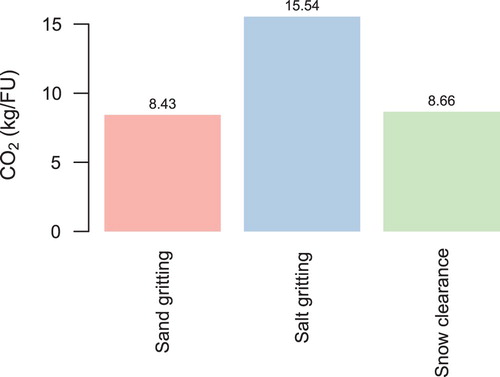
Furthermore, winter maintenances such as sand and salt gritting and snow clearance are considered in the model. Since some winter maintenances should be carried out more frequently to maintain the functionality of the system, the winter operations are also variables in the model and sensibility analysis is performed and presented in Section 3.2. A summary of the impacts associated with the material quantities, transport and operations (10× snow clearance, 2× sand gritting and 40× salt gritting) for one year of the road usage is presented in Figure . The distance between the materials needed for the winter operations and the road is assumed to be 3 km.
Figure 7. impacts of the winter operations per year.
3. LCA analysis results
In this section, the impacts associated with the construction, operation (winter maintenance) and rehabilitation phases will firstly be analysed for the three different eRoad solutions and compared to the traditional one. Since the winter maintenance and rehabilitation operations are variable in the proposed model, a sensitivity analysis will be presented in order to investigate the effect of these parameters on the total life cycle of the considered infrastructure.
3.1. Construction phase
The results of the inventory analysis related to the production of raw materials needed for the construction phase for the three different eRoad solutions and a traditional one are presented in Figure . Due to the large amount of copper and steel required in the pantograph solution, this technology presents the highest impact with a total of 112.91 ton/km. It is obvious that all the eRoad solutions present a higher
impact than a traditional road since there are more raw materials involved in their constructions. The technology with the lowest impact is the eRoad with conductive rails. It is also interesting to notice a large amount of
arising from the concrete used for the fabrication of the charging system in the IPT technology. Since this technology is still under development, an optimisation of the size of the charging system could reduce considerably the environmental impact induced by the concrete production. Finally, the
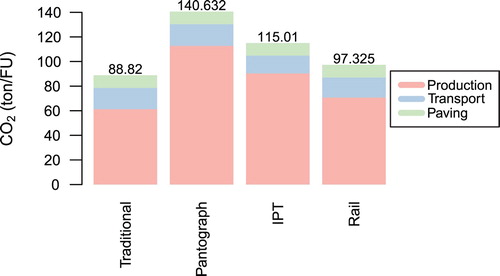
impacts of the entire construction process including paving operations and transport of the four different roads are presented Figure .
Figure 8. impacts related to the production of raw materials needed for the construction of different roads.
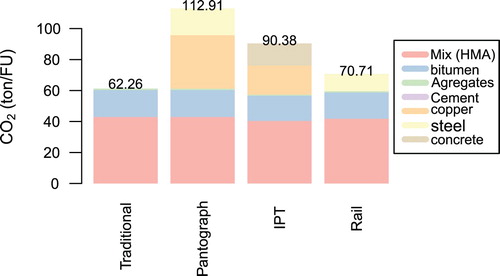
Figure 9. impacts related to the entire construction process of the different roads.
3.2. Entire life cycle including winter maintenance and rehabilitation operations
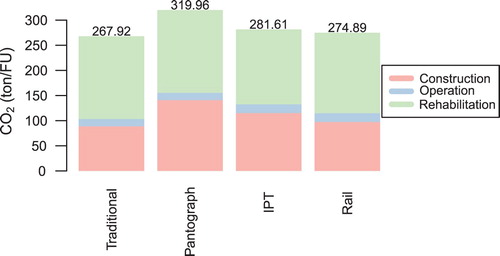
A first study has been performed with the same frequency of winter maintenance and road rehabilitations for all the solutions in order to compare their impacts with the construction process and to compare the different solutions between them. In this analysis, the rehabilitations on the considered life time of the roads are the replacement of the top layer (3 times) and the replacement of the entire pavement (1 time). The frequency of the sand and salt gritting are 2 and 4 per year, respectively and the frequency of the snow clearance is assumed as 10 times per year. The impacts of the entire life cycle considered (20 years) including construction, winter maintenances and rehabilitation operations of the four different roads are presented in Figure . For all the solutions, the maintenance operation is the phase with the highest
impacts on the entire life of an eRoad as well as on a traditional road. The maintenance operations represent respectively 61.43%, 51.44%, 53.08% and 58.21% of the total
impacts of the traditional, pantograph, IPT and conductive rail solutions.
Figure 10. impacts related to the entire life cycle of the different roads.
3.2.1. Sensitivity analysis
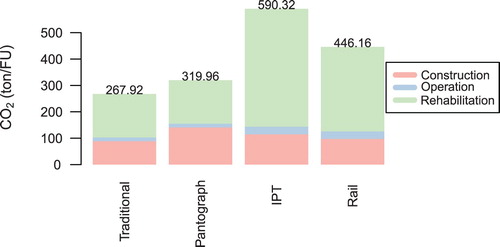
The rehabilitation operations of a road require an important quantity of raw materials and have a large impact on the final assessment. The maintenance operation frequency is thus a key parameter in the sustainability of a road infrastructure and unfortunately, accurate predictions of the maintenance frequency of one particular solution is not possible due to the huge number of parameters influencing the long-term behaviour of a road, electrified or not, e.g. load, temperature, humidity, mixing process, construction process. Finite element simulations carried out by Chen, Balieu, Cordoba, et al. (Citation2019) and Chen, Balieu, et al. (Citation2018) have shown higher damages in the pavement where the charging systems are embedded in the asphalt. In order to take these results into account in the final assessment, a second analysis with increased frequency of the rehabilitation operations is performed for the IPT system (frequency of all the rehabilitations multiplied by 3) and the conductive rail solution (frequency of all the rehabilitations multiplied by 2). The choice of the number of frequency for each solution has been done in accordance with the results presented in Chen, Balieu, et al. (Citation2018). The eRoad solution presenting higher damage after 1,000,000 passes of heavy vehicles is the IPT solution followed by the conductive rails technology. Furthermore, in order to ensure the good efficiency of the power transfer, the frequency of the winter maintenance operations has been multiplied by 2 for the IPT and conductive rails charging solutions. The impacts of the entire life cycle considered (20 years) including construction, winter maintenance and rehabilitation operations of the four considered roads are presented in Figure . The solution presenting the highest
impact becomes the eRoad with Inductive Power Transfer followed by the conductive rail solution. The increase in the frequency of the winter operations has only a moderate impact on the total impact of the solutions. In another way, by multiplying the number of rehabilitation operations of the eRoad with the IPT charging system by 3, an increase of more than 200% is observed for the
emission of the entire considered life cycle. Without taking into account the gain from the reduction of the vehicle emissions, the total
emission of transport infrastructures such as eRoads built with IPT and rail systems are thus 220 and 166% higher than a traditional road. It is thus of paramount importance to ensure that the gain obtained by the reduction of the
emissions of the vehicles will not be overshadowed by extra rehabilitation operations. These results emphasise the importance of the rehabilitation of the pavement in the life cycle of the road. It is crucial to propose electrified roads with good structural performance in order to limit the maintenances required to ensure the proper functionality of the system.
Figure 11. impacts with increased winter maintenance and rehabilitation operation for the IPT and rail system.
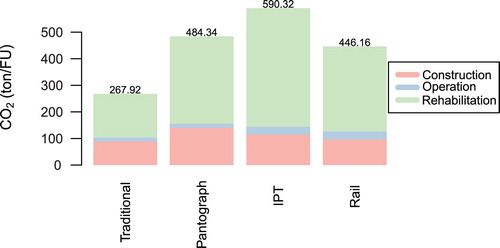
Finally, even if the pantograph solution does not have extra material in the pavement structure, the behaviour of the driver following the overhead charging system could lead to a reduction of the wheel wander. Chen, Balieu, and Kringos (Citation2016) have shown that a reduction of wheel wander leads to an increase of permanent deformations into the road surface also called rutting. Extra rehabilitation operations could also be required with the pantograph solution and in order to evaluate its environmental impact, a last analysis is performed with a frequency of all the rehabilitation operations multiplied by 2. The impacts of the entire life cycle considered (construction, winter maintenance and rehabilitation operations) of the four different roads are presented in Figure . The
impacts of the eRoad built with the pantograph charging system increase by 151.3% by considering extra rehabilitation operations induced by wheel wander reduction. In this case, the
impact of the entire considered life cycle of an eRoad with the pantograph system becomes 180% higher than a traditional road.
Figure 12. impacts with increased winter maintenance and rehabilitation operation for the IPT and rail system and increased rehabilitation for the Pantograph solution.
4. Conclusions and future works
Different electrified road (eRoad) systems have been found under investigation with the aim to support EVs' dynamic charging, whereas, in comparison to a normal road, the potential environmental impacts of using such kind of infrastructure are, still, unclear. In this paper, a series of LCA calculations have been carried out to probe into the life cycle environmental performance of the e-Road infrastructure in a quantitative way, integrating as well with the inputs from the structural performance analyses, the construction, maintenance and operation experiences. Four specific scenario cases are included in the analyses, one normal road and three eRoads with different charging systems enabled which are: (i) the conductive solution with overhead Pantograph; (ii) the conductive solution with rails fixed on the road surface; and (iii) the wireless solution using Inductive Power Transfer technology embedded inside road structure. From the results of the LCA analyses, several conclusions can be drawn:
Without considering the reduction of
In service operation phase, winter maintenance and rehabilitation actions are important considerations. It has been found that huge impacts are produced due to the rehabilitation of the road, which plays as the most important role in the life cycle performance of an electrified road. As the frequency of rehabilitation operations are fundamentally determined by the structural performance of the road, an infrastructure with high structural performance is thus of essential importance to reach the original aim of the electrified road solution, i.e. to enhance the sustainability of the transport network.
Moreover, the LCA results of this study provide further important boundary inputs for the assessment of life cycle performance of road electrification as a whole, in which the major components from the infrastructure, the vehicle and the fuel are included in the assessment framework in a complete way.
Disclosure statement
No potential conflict of interest was reported by the authors.
Additional information
Funding
Notes
1 The quantities used for the pantograph solution are chosen according to Schulte (Citation2015).
2 The quantity of steel per FU is provided by the VD of Elways®.
Related Research Data
References
- Balieu, R., & Kringos, N. (2015). A new thermodynamical framework for finite strain multiplicative elastoplasticity coupled to anisotropic damage. International Journal of Plasticity, 70, 126–150. doi: 10.1016/j.ijplas.2015.03.006
- Butt, A. A. (2014). Life cycle assessment of asphalt roads (Doctoral dissertation). KTH Royal Institute of Technology, Stockholm.
- Chen, F., Balieu, R., Córdoba, E., & Kringos, N. (2019). Towards an understanding of the structural performance of future electrified roads: A finite element simulation study. International Journal of Pavement Engineering, 20(2), 204–215. doi: 10.1080/10298436.2017.1279487
- Chen, F., Balieu, R., & Kringos, N. (2016). Potential influences on long-term service performance of road infrastructure by automated vehicles. Transportation Research Record: Journal of the Transportation Research Board, 2550, 72–79. doi: 10.3141/2550-10
- Chen, F., Balieu, R., & Kringos, N. (2017). Thermodynamics-based finite strain viscoelastic-viscoplastic model coupled with damage for asphalt material. International Journal of Solids and Structures, 129, 61–73. doi: 10.1016/j.ijsolstr.2017.09.014
- Chen, F., Balieu, R., & Kringos, N. (2018). Comparative assessment of long-term structural performance of different electrified road systems. Journal Construction and Building Materials (under review).
- Chen, F., Coronado, C. F., Balieu, R., & Kringos, N. (2018). Structural performance of electrified roads: A computational analysis. Journal of Cleaner Production, 195, 1338–1349. doi: 10.1016/j.jclepro.2018.05.273
- KTH, QIE, POLITO (2018). Detailed LCA/LCCA assessment of environment and cost impact of E-roads.
- Jorgensen, K. (2008). Technologies for electric, hybrid and hydrogen vehicles: Electricity from renewable energy sources in transport. Utilities Policy, 16(2), 72–79. doi: 10.1016/j.jup.2007.11.005
- Miliutenko, S. (2012). Life cycle impacts of road infrastructure: Assessment of energy use and greenhouse gas emissions (Doctoral dissertation). KTH Royal Institute of Technology, Stockholm, Sweden.
- Pistoia, G., ed. (2010). Electric and hybrid vehicles: Power sources, models, sustainability, infrastructure and the market (Chap. 5). Amsterdam: Elsevier.
- Poullikkas, A. (2015). Sustainable options for electric vehicle technologies. Renewable and Sustainable Energy Reviews, 41, 1277–1287. doi: 10.1016/j.rser.2014.09.016
- Schulte, J. P. M. (2015). Smarta steg på väg mot hållbara transporter? Snabbladdningsinfrastruktur och elvägar ur ett strategiskt livscykelperspektiv (Master thesis). Linnaeus University, Department of Biology and Environmental Science, Växjö Kalmar.
- Stripple, H. (2001). Life cycle assessment of road. A pilot study for inventory analysis (Research Report). IVL Swedish Environmental Research Institute Ltd.
- van Vliet, O., Brouwer, A. S., Kuramochi, T., van den Broek, M., & Faaij, A. (2011). Energy use, cost and CO2 emissions of electric cars. Journal of Power Sources, 196(4), 2298–2310. doi: 10.1016/j.jpowsour.2010.09.119
- Zhou, G., Ou, X., & Zhang, X. (2013). Development of electric vehicles use in China: A study from the perspective of life-cycle energy consumption and greenhouse gas emissions. Energy Policy, 59, 875–884. doi: 10.1016/j.enpol.2013.04.057