
 ?Mathematical formulae have been encoded as MathML and are displayed in this HTML version using MathJax in order to improve their display. Uncheck the box to turn MathJax off. This feature requires Javascript. Click on a formula to zoom.
Abstract
Reliable determination of material properties is a key component for modelling and performance prediction of asphalt pavements. This paper deals with the potential use of instrumented indentation tests for viscoelastic characterisation of asphalt mortar as a new alternative to existing techniques. The main focus lies on the potential of indentation tests for multi-scale measurement of the shear relaxation modulus. A three-dimensional finite element model of a rigid spherical indenter penetrating an asphalt mortar sample is developed and used to model indentation tests performed at different material scales. The asphalt mortar is modelled as an idealised fine aggregate composite with elastic spheres, suspended within a viscoelastic bitumen mastic matrix. Based on the obtained numerical results the scale-dependency of the shear relaxation modulus measured with the indentation test is investigated. It is shown that the measurement scale is effectively controlled by the size of the indenter-specimen contact area, while the effect of indentation depth is minimal. The minimum contact area size required for obtaining representative properties, measured at the mortar scale, is determined. The viscoelastic parameters obtained from the indentation model are compared to those obtained using a representative volume element (RVE) for the asphalt mortar. In this way, the paper provides a new impulse for linking the mortar and asphalt scales in the multiscale modelling of asphalt mixtures. Feasibility of the proposed testing technique is further evaluated experimentally. Viscoelastic indentation tests are performed on asphalt mastics and mortar at two different sizes of contact areas. Experimental results indicate that indentation tests allow reliable characterisation of mortars relaxation modulus on both macro-scale as well as on individual component level.
Introduction
Instrumented indentation tests have been used to measure the viscoelastic and adhesive properties of asphalt binders at micro- as well as macro-scales cf. (Jäger, Lackner, & Eberhardsteiner, Citation2007; Jelagin & Larsson, Citation2013; Veytskin, Bobko, & Castorena, Citation2016; Zofka & Nener-Plante, Citation2011). Indentation tests of bituminous materials, (i.e. bitumen, bitumen-filler mastics and bitumen- fine sand asphalt mortar), have several potential advantages as compared to the conventional rheological characterisation methods, such as dynamic shear rheometer (DSR) and bending beam rheometer (BBR). In particular, due to highly localised stress field induced in indentation testing, the measurements are not significantly influenced by the remote boundary conditions and thus the test does not have strict requirements on the specimen geometry, except for the flat surface. Furthermore, the length-scale of the indentation test measurements is proportional to the contact area and can be controlled in a relatively straightforward manner. Accordingly, the same testing technique may be applied to measure the linear viscoelastic properties across different structural size scales, i.e. for both probing individual phase properties in bitumen-aggregate composites and measuring the composite properties at macro-scale. Provided that the indentation test applicability for multi-scale characterisation of bitumen-aggregate composites is established it may potentially provide a relatively simple tool to measure the material properties at size scales relevant for the asphalt mixtures macro-scale mechanical behaviour, aging processes as well as for various local and global asphalt damage mechanisms, such as fatigue, rutting and moisture damage, cf. (Tarefder & Faisal, Citation2014; Tarefder & Zaman, Citation2011).
In a recent study by (Fadil, Jelagin, & Larsson, Citation2018) a new methodology for viscoelastic characterisation of bituminous material with spherical indentation test has been proposed, which allows extracting the linear viscoelastic properties of materials at arbitrary non-decreasing loading. The method developed in (Fadil et al., Citation2018) has been applied to measure viscoelastic properties of bitumen and bitumen-filler mastics. The intention of the present study is to extend the methodology developed in (Fadil et al., Citation2018) to the multi-scale characterisation of bituminous materials.
Consequently, this paper aims to investigate numerically and experimentally the effect of the indentation test parameters on the measured apparent shear relaxation modulus of a bitumen-aggregate composite and to identify test parameters corresponding to bitumen-aggregate composite characterisation on macro-scale as well as on individual component scale. The focus is on the viscoelastic characterisation of asphalt mortar, i.e. a mixture of bitumen with the aggregates smaller than 2.36 mm. The present study is focused on mortar with a volumetric composition representative for porous asphalt mortar, i.e. a material with comparatively high bitumen-to-aggregate ratio. In order to determine macro-scale viscoelastic properties of mortar, a finite element model (FE) is developed with a representative volume element (RVE) for mortars, where the aggregate phase is represented with randomly distributed elastic spheres in a viscoelastic matrix. Multi-scale modelling is applied for improving computational efficiency. The influence of the indentation test parameters on the measured viscoelastic properties of mortar is investigated numerically with the FE model for spherical indentation on inhomogeneous specimens. The shear relaxation functions, , from the indentation tests are then compared with those from RVE modelling. Based on the numerical results, the indentation test parameters for the macro-scale characterisation of asphalt mortar as well as its individual components are identified.
In order to further evaluate the feasibility of indentation testing for multiscale characterisation of asphalt mortar a brief experimental study is performed. Indentation testing technique proposed in (Fadil et al., Citation2018) is used to measure shear relaxation modulus of bitumen-filler mastics as well as of asphalt mortar at two different indenter-specimen contact area sizes. In order to establish baseline for comparison, relaxation modulus of bitumen and of bitumen-filler mastics is also measured with the DSR. Accuracy and repeatability of the indentation test measurements is evaluated based on comparisons with the DSR measurements as well as with the modelling outcomes. Obtained experimental and modelling results indicate that the measurement scale in indentation tests can be controlled efficiently by performing indentation tests with different indenter-specimen contact areas. Accordingly, indentation tests may be used for reliable characterisation of mortars viscoelastic properties on macro-scale as well as on the individual component level.
Problem formulation and computational study
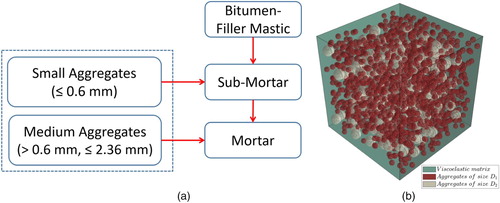
Presently, asphalt mortar is considered to be composed of bitumen-filler mastics and aggregates in a size range from 0.3 to 2.36 mm. This aggregate size range attributed to the mortar scale follows the definition proposed by (Asphalt Institute, Citation2001). The present study is focused on the numerical and experimental evaluation of the indentation test potential to be used for multi-scale viscoelastic characterisation of mortar. In order to investigate the influence of indentation test parameters on the measurement scale numerically a micro-mechanical FEM modelling is employed as detailed below.
The micro-mechanical FEM model for asphalt mortar is used for two types of numerical analysis. First, in order to identify homogenised viscoelastic properties of asphalts mortar, strain-controlled periodic boundary conditions (PBC) are specified for a material’s RVE, the PBC is utilised to reduce the size of the model. Secondly, a model of instrumented indentation test on asphalt mortar is set up and the analysis procedure proposed in (Fadil et al., Citation2018) is used to obtain the apparent material properties from the analysis results.
The mortar is modelled in the present study as a composite material consisting of elastic aggregates in a size range 0.3 to 2.36 mm, embedded into viscoelastic bitumen-filler mastics. The aggregates concentration in mortar is assumed to be 33% by volume (), corresponding to the porous asphalt mortar as in (Zhang & Leng, Citation2017). The assumed size distribution of the aggregates in the mortar is reported in Table along with the resulting proportion of each aggregate size in the total volume of mortar
, which is calculated according to Equation (1).
Table 1. The assumed aggregate size distribution for the model.
Where represents the passing % for a certain sieve size.
(1)
(1)
The model uses two separate size scales, in order to improve computational efficiency. In particular, aggregates smaller than 0.6 mm are relegated to the smaller scale, here denoted sub-mortar, where the material is assumed to be comprised of bitumen based mastic, as a matrix, and randomly distributed spherical aggregates. The mortar scale model is in turn composed of randomly distributed spherical aggregates in the range between 0.6 and 2.36 mm, embedded in a viscoelastic matrix with properties as obtained for the homogenised viscoelastic sub-mortar scale. These scales are illustrated in Figure (a). Figure (b), shows a representation of the models with spherical aggregates randomly distributed within a viscoelastic matrix.
Figure 1. (a) A schematic illustrating the different scales and their constituents (b) composite material model used spheres of = 0.3 and 1.18 mm,
= 0.6 and 2.36 mm for sub-mortar and mortar models respectively.
The aggregate concentration of the mortar phase is distributed between the two scales, sub-mortar and mortar, according to the aggregate size distribution shown in Table ; correspondingly the sub-mortar model has an aggregate volume percentage of
and mortar model has an aggregate volume percentage of
cf. Table .
Aggregates are assumed to be linear elastic, with Young’s modulus, GPa and Poisson’s ratio
, corresponding to elastic parameters of limestone (Wang, Citation2011). The aggregates are idealised as spheres to simplify the modelling.
Viscoelastic matrix in mortar and sub-mortar models is assumed to be incompressible with constant Poisson’s ratio of 0.499. The matrix at the sub-mortar model is assumed to be comprised of bitumen-filler mastics, with its obtained as a power law fit, as shown in Equation (2), of the measured shear relaxation modulus of bitumen mixed with 20% by weight of hydrated lime filler at
reported in (Fadil et al., Citation2018). The power-law fit was found to be suitable for the time range with
.
(2)
(2) where:
The spherical aggregates are modelled explicitly and randomly distributed within the matrix as follows: spheres of 0.6 mm diameter and
spheres of 0.3 mm diameter, these are calculated according to Equation (3).
(3)
(3) where
is the volume of the sub-mortar RVE and
and
are the volumes of a sphere with the diameters 0.6 and 0.3 mm respectively.
The mortar phase is assumed to be comprised of a matrix with the obtained as the homogenised shear relaxation modulus of the sub-mortar. The homogenised sub-mortar
is obtained using periodic boundary conditions model as described below. The spherical aggregates are randomly dispersed within the matrix and are represented by
and
spheres of 1.18 and 2.36 mm diameters respectively, these are calculated according to Equation (4).
(4)
(4) where
is the volume of the mortar RVE and
and
are the volumes of a sphere with the diameters 1.18 and 2.36 mm respectively.
It has to be pointed out, that the scale division assumption shown in Figure , is fully accurate only when there is no interaction between mortar and sub-mortar aggregates other than volume filling effect. The validity of this assumption for the present case of 33% aggregate volume concentration has been evaluated by performing comparative simulations with mortar modelled as viscoelastic mastics with 33% single size spherical aggregates embedded into it. The average difference between the effective mortar obtained with the two models has been found to be below 20%. As the single sized spheres model used for comparison represents the case with the highest potential for the aggregate interaction, it may be argued that the scale division assumption employed presently is justified.
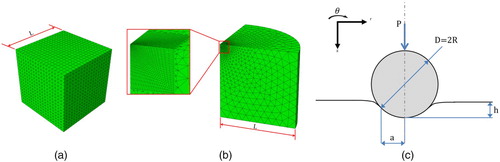
The finite element meshes used in the present study are shown in Figure (a,b) for the RVE and the indentation test analysis respectively. As seen in Figure (a), the RVE model has a cubical form with a side length 10 times the size of the largest aggregate, i.e. mm. The periodic boundary conditions are applied, where strain constraint equations are enforced on the facial nodes of the mesh in order to simulate the deformation of a RVE as part of an infinite medium (Pontuso, Citation2005). The ABAQUS plugin HOMTOOLS (Lejeunes & Bourgeois, Citation2011) was used to automate the generation of the equations, coupling the displacement of the nodes on opposing faces of the RVE cube.
Figure 2. (a) periodic boundary conditions mesh, (b) indentation model with a zoomed in indentation area mesh, (c) sketch of the indentation test with relevant parameters.
To simulate a Heaviside function loading, the RVE is loaded with a prescribed, uniform effective strain , in a static analysis and the strain for viscoelastic analysis is maintained during 10 s. The effective values of the resulting stresses are recorded in the three Cartesian directions x, y and z, namely
,
and
respectively. The 3D Hooke’s law, in conjunction with the viscoelastic correspondence principle, is utilised to calculate the apparent shear relaxation function,
, for the material. The PBC is used to obtain the homogenised
of sub-mortar and mortar models. In order to examine the validity of incompressibility assumption for sub-mortar and mastics materials, the effective Poisson’s ratio,
, for the mortar was calculated using
and the average of the transverse strains
and
. The Poisson’s ratio was found to be nearly constant; increasing from 0.493 at t = 0, to 0.499 at t = 10 s. It has to be pointed out, that low time-dependency of the Poisson’s ration observed at the present case is due to relatively low volume fraction of aggregates in mortar (i.e. 33%) and to the absence of the air voids. Accordingly this conclusion may not be generalised to other types of mortars. It has to be pointed out that, the mortar in this study is idealised as a material with no air voids and large content of binder compared to the aggregates, i.e. as a material similar to asphalt mastics. Mortars with higher aggregate content and/or including air voids, however, can also be understood through the packing-concept, similar to an asphalt concrete with small aggregates, and thus could not be considered incompressible. In several recent studies, Poisson’s ratio of bitumen and bitumen aggregate mixtures were shown to be dependent on temperature and load time / loading frequency (Alanazi, Kassem, Grasley, & Bayomy, Citation2017; Benedetto, Delaporte, & Sauzéat, Citation2007; Gudmarsson, Ryden, Di Benedetto, & Sauzéat, Citation2015; Perraton, Di Benedetto, Sauzéat, Nguyen, & Pouget, Citation2018). In particular, (Benedetto et al., Citation2007) reports measured Poisson’s ratios at 0°C for bitumen and bitumen-filler mastics with 32% filler volume concentration, to be close to 0.5 at low loading frequencies and decrease to approximately 0.48 at loading frequency of 5 Hz. For a hot mix asphalt (HMA) time and temperature dependence of Poisson’s ratio is reported to be more profound; e.g. (Perraton et al., Citation2018) measured for HMA with 4.5% binder content by weight υ(t) varying from approximately 0.25 to 0.47 at 0°C.
The influence of indentation radius on the measured , is investigated with the FE model depicted in Figure (b). A sketch of the indentation test is shown in Figure (c), along with the relevant geometric parameters; where
is the curvature radius of the indenter,
is the indentation depth,
is the contact area radius and
is the indentation load. The FE model is composed of two segments, the cubic model of mortar material with a side
mm modelled with the micromechanical approach outlined above; where the spheres are modelled explicitly, and a volume surrounding the indentation model is used to extend the model to
mm for mitigating the edge effects as described in (Fadil et al., Citation2018). In order to facilitate computations, this surrounding material is modelled as homogeneous viscoelastic material with properties obtained from the mortar RVE model above.
An indentation relaxation test, i.e. , where
is a prescribed indentation depth and
is the Heaviside step function, is modelled for the duration of 10 s. The
history obtained numerically is used in Equation (5) to calculate the corresponding shear relaxation function,
, cf. (Fadil et al., Citation2018):
(5)
(5) where
is obtained by Equation (6):
(6)
(6)
As discussed in e.g. (Johnson & Keer, Citation1986), the scale of the stress field induced in the linear elastic or viscoelastic specimen during the spherical indentation is controlled by the radius of the contact area, . In the experiment, the size of the contact area can be controlled by either changing, the indenter curvature radius R or the indentation depth h, as defined by Equation (6). Presently, the indenter curvature radii are varied which results in contact area sizes a in a range of 0.45–18.0 mm. Furthermore, in order to evaluate the influence of the indentation depth h on the measurements, comparative simulations are performed for indentations with the same indentation areas but different indentation depths. Two sets of simulations are performed with the same indentation area; in the first set, the indenters with the curvature radii
and 200 mm are indented to
and 0.004 mm respectively. In the second set the curvature radii
and 800 mm indented to
and 0.4 mm respectively.
Experimental study
Materials and samples preparation
In order to experimentally evaluate the feasibility of the indentation testing for multi-scale characterisation of mortar as well as to verify the proposed modelling approach a brief experimental study is performed as follows.
Bitumen-filler mastics and an asphalt mortar were manufactured using the same bitumen; an unmodified 70–100 penetration grade bitumen provided by Nynas AB (Nynashamn, Sweden). The bitumen has a softening point of 46°C and its kinematic viscosity at 135°C is 181 mm2/s. For a detailed description of the material is provided in (Nynas 70/100 Paving Grade Bitumen Specifications, Citation2010).
The bitumen-filler mastic samples were prepared by mixing bitumen with 30% by volume of quartz sand powder passing 325 mesh. Both the bitumen and the sand were weighed in a scale in order to provide the desired volume concentration of filler, the bitumen density was taken as 1 g/cm3 according to (Nynas 70/100 Paving Grade Bitumen Specifications, Citation2010), and the quartz sand density was measured using the pycnometer method to be 2.687 g/cm3 according to ISO standard ISO 1183-1:2012. Before mixing, the bitumen was heated for two hours at 164°C in a temperature controlled oven. During the mixing, the filler was added slowly to the bitumen, and once the target amount of filler was added, the mixing was continued for additional 10 min. While mixing, the material was kept at 165°C using a heating apparatus at the bottom. Afterward the mastic was poured into metallic containers for testing; small containers as a one-time use for the DSR samples and a large container to be used in indentation tests. The containers were left in room temperature to cool.
The mortar samples were prepared by mixing the prepared bitumen-filler mastics with 33% by volume of limestone aggregates. The limestone aggregates have a particle density of 2.58 g/cm3 with the size distribution as shown in Table . This size distribution and stone phase content was chosen to be as close as possible to the one used in the numerical study.
Table 2. Aggregate size distribution for mortar specimens.
DSR tests
DSR was used to obtain the complex modulus () of the bitumen and bitumen-filler mastic. The tests were performed according to EN-14770. Frequency sweep tests were performed at three different temperatures 0°C, 5°C and 10°C from 0.1 to 10 Hz for each temperature. Strain sweep tests were performed at 1.59 Hz before the frequency sweep tests in order to establish the linear viscoelastic limit and ensure that all the tests are performed in the linear range. One sample was used to perform the strain sweep tests and 2 replicates were used for the frequency sweep tests.
To compare the results to indentation tests the master curve was first constructed using the time-temperature superposition principle and Arrhenius’ law. Subsequently, the master curve was converted to
using the approximate analytical method developed in (Schapery & Park, Citation1999).
Figure shows the complex modulus and phase angle
as measured with the DSR for the bitumen and bitumen-filler mastics used. It can be seen from Figure (a) that the
for mastic is approximately 3.5 times stiffer than the bitumen. At the same time, as shown in Figure (b) the phase angle does not differ significantly between bitumen and mastics. Table shows the standard error from the mean of the DSR measurements at two frequencies.
Figure 3. (a) and (b)
measured with DSR for the bitumen and mastic used in the experiments at 0°C, error bars showing the standard error from the mean.
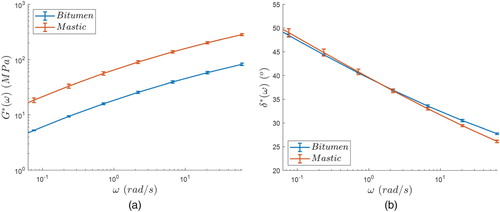
Table 3. Standard error from the mean of the DSR results at two frequencies.
Indentation tests
Spherical indentation tests were performed on the prepared bitumen-mastic and the mortar specimen. Two steel spherical indenters, with diameters of = 9.5 and 31.75 mm for the mortar specimen were used as shown in Figure , and the
= 31.75 mm indenter was used for the bitumen-filler mastic sample.
Figure 4. The indentation experimental setup including the environmental chamber, as well as the indented mortar sample and different spherical indenters used.
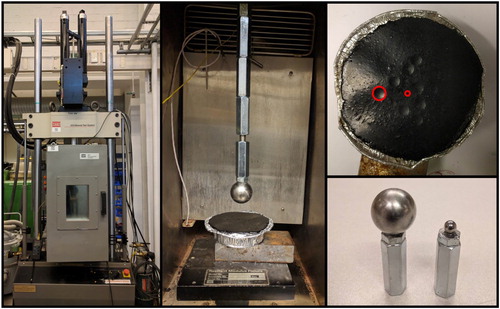
The MTS servohydraulic load frame (shown in Figure ) was used fitted with a 2 kN load cell with an accuracy of 0.5% of the measured load, in the range 10 N to 2 kN. The tests were performed at 0°C and controlled within ±1°C using an MTS environmental chamber. The samples were conditioned for 2 h before performing the indentation test. The piston position was used as the control variable for the experiments. As proposed in an earlier study by the authors, (Fadil et al., Citation2018), the load is applied with linear ramp in one second ( s) followed by a 49 s hold at constant indentation depth, as shown in Equation (7), also corrected for machine compliance effects:
(7)
(7) here
is the indentation depth and
represent the measured indentation load and
is the machine compliance.
is the final depth reached after the ramp period which is taken to be 0.6 and 0.7 mm for
and 9.5 mm respectively. The resulting maximum contact area radius is 3.1 and 0.7 mm for big and small indenters correspondingly.
Cm was measured using a stiff steel plate that was loaded using the setup and the load and piston position were measured during the unloading period. Since the measured loads do not go over 1.3 kN it was assumed that all the deformations during the loading range against the steel plate happen due to the machine compliance. Cm was measured to be 0.084 µm/N.
The viscoelastic shear relaxation modulus, G(t), is calculated from the measured P(t) and h(t) by using the method developed in (Fadil et al., Citation2018). The method proposed by (Fadil et al., Citation2018) is advantageous as it allows to obtain accurate mechanical properties at finite loading times as well as in the presence of significant machine compliance effects. To simplify the problem Poisson’s ratio was assumed to be constant based on the aforementioned small range of change in the simulations, i.e. υ(t) ≈ 0.5.
Five replicate tests were performed for the bitumen-filler mastic sample, and 10 tests were performed for the asphalt mortar sample; which consists of 5 replicates for each indentation contact area radius a. In order to reduce boundary effects, indentations were not placed closer than 5 contact area radii to the specimen boundaries, as reported by Fadil et al. (Citation2018) the resulting effect of the remote boundary conditions on the measured is in this case below 10%.
Results and discussion
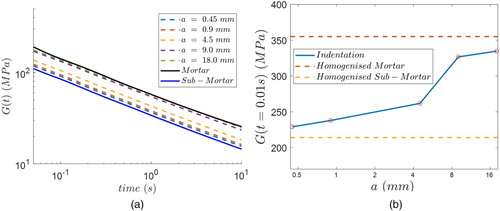
The influence of indentation test parameters on the shear relaxation modulus, , measured is examined first numerically, for the case of asphalt mortar composed of bitumen-filler mastic with its viscoelastic properties defined in Equation (2) and of 33% by volume of aggregates with their gradation defined in Table . The
results back-calculated from simulations of indentation tests at different contact area sizes are shown in Figure (a) along with the homogenised
for the sub-mortar and mortar models. Homogenised
functions are obtained from PBC simulations, cf. Figure (a) and accordingly represent the respective phase properties on the macro-scale. From the graph it can be concluded that in the indentation tests, the measurements correspond to the effective viscoelastic properties of sub-mortar matrix and homogenised mortar properties can be obtained depending on the contact radii during the test. In particular, at smaller
obtained
is close to the homogenised sub-mortar
, with the average difference between indentation test and the homogenised cases being below 8% for the measurement period. At larger values of
, especially at 9 and 18 mm, the obtained
is very close to the homogenised mortar properties. The average difference between the homogenised
and the ones obtained with indentation at
and
is 6.5% and 1.4% respectively. Figure (b), depicts the change in the obtained
for different values of
. It also shows that the measured
approaches both the sub-mortar and mortar homogenised properties asymptotically for small and large values of
respectively. Due to the simplification of the model, the aggregate size chosen to distinguish the sub-mortar from mortar, in this case 0.6 mm, determines the
obtained at small values of
, however, its effect on the obtained
of mortar needs further investigation. From the results presented in Figure , it may be concluded that the indentation test measurement length scale is effectively controlled by the size of the indenter-specimen contact area, a, with measurements performed at smaller a values corresponding to the individual phase properties while the results obtained at sufficiently large a are close to the macro-scale properties of the mortar.
Figure 5. (a) obtained using indentation, at different indenter-specimen contact radii, compared to the homogenised mortar and sub-mortar
, (b)
as a function of contact area radius.
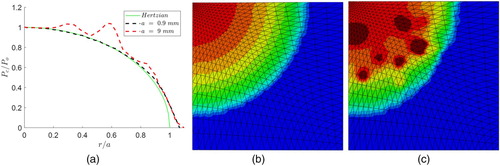
In order to gain some micromechanical insight into the problem, Figure (a), shows the normalised distribution of the contact pressure along a line from the centre of indentation to the boundary of the contact area is presented for and
and compared to the Hertzian contact pressure. It can be seen clearly that the small
, the contact pressure distribution shape is similar to the Hertzian contact, which explains the fact that the measured properties are closed to the homogenised sub-mortar matrix. However, for large
, the contact pressure distribution does not match the Hertzian shape, showing a number of spikes. This is illustrated further in Figure (b,c) where the contact pressure distribution over the contact area is presented for
and
. According to Figure (b), the contact pressure distribution for the 0.9 mm indentation radius is smooth whereas for 9 mm indentation radius pressure concentrations occur, see Figure (c). This explains the observed spikes in Figure (a) for the 9 mm contact pressure curve, since the indenter interacts with more aggregates near the surface.
Figure 6. Pressure distribution under the indenter, (a) contact pressure normalised with the contact pressure at the centre
vs. distance from centre of contact
normalised with the indentation radius
, (b) pressure distribution for 0.9 mm indentation radius, (c) pressure distribution for 9 mm indentation radius.
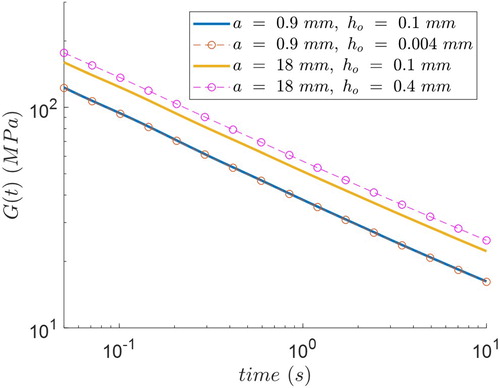
In order to explore whether the indentation depth, h, has an independent effect on the measurements, in Figure , the simulations were performed at the same a, and different h values. The influence of the indentation depth on the measurements is examined in Figure for the cases of and
, i.e. measurements on the sub-mortar and on mortar scale. The results in Figure are shown for the following simulation cases; one case with
and
and
; the other case with
,
and
. As seen in Figure , provided that the contact radius does not change the influence of the indentation depth on the measurements is quite small – less than 1% and 12% for the cases of
and 18 mm respectively. The higher effect of indentation depth observed for the case of
as compared to the case of
can be attributed to the fact that at larger
, more aggregates are interacting with the indenter and accordingly increasing
will result in formation of more aggregate-to-aggregate load transferring chains in the material.
Figure 7. for indentations with similar indentation areas but two different depths.
From the computational results presented above it may be concluded that the measurements scale of the indentation tests performed on asphalt mortar may be effectively controlled by the size of indenter-specimen contact area. Below, the results of the trial indentation experiments, are examined and compared to the DSR measurements and modelling results. It has to be emphasised that, for practical reasons, the experimental results presented are limited to only one material case and two indenter-specimen contact area sizes. Accordingly, the main intention here is feasibility evaluation, while large scale technique verification and validation will be done as part of future work.
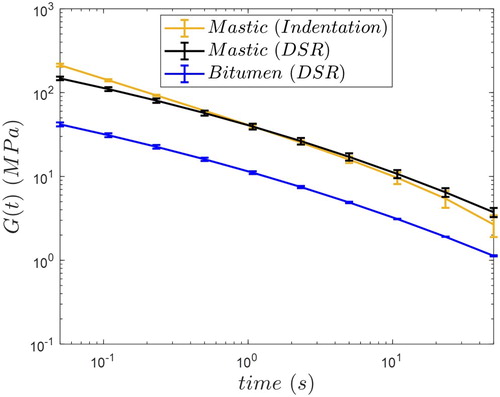
Five indentation tests have been performed on bitumen-filler mastics, at maximum contact area sizes of mm. In Figure ,
of bitumen-filler mastics measured with indentation tests is compared with the relaxation modulus for bitumen and bitumen-filler mastics obtained from the DSR data, reported in Figure . The indentation data in Figure represents the average result of the 5 measurements performed. As seen in Figure , the G(t) measured using both test methods are in quite good agreement; with both DSR and indentation test measuring mastics to be approximately 3.5 times stiffer as compared to pure bitumen. It can be noticed that the results differ mainly at the start and end of the measurement time, with a maximum difference of 44% difference between the indentation and DSR
; this difference can be explained by the very low loads measured at the beginning of the ramp and the end of the relaxation periods, for which the load cell measurement errors will affect results more profoundly.
Figure 8. measured using the indentation test vs. the
measured using the DSR for bitumen-filler mastic together with the
measured using the DSR for bitumen, error bars showing the standard error from the mean.
Results of indentation tests performed on mortar at contact area sizes of and 0.7 mm are presented in Figure (a,b), together with the measured relaxation modulus for mastics. The standard error from the mean for the indentation results is shown in Table . Also in Figure , effective
for mortar is presented as obtained computationally with the PBC modelling approach. In the model mastic properties have been defined based on the indentation test measurements as shown in Equation (8):
(8)
(8) where:
Figure 9. (a) measured using indentation test for mastic and mortar (for the two values of indenter-specimen contact radii) together with the model result, (b) scatter of the values of
for the two values of indenter-specimen contact radii.
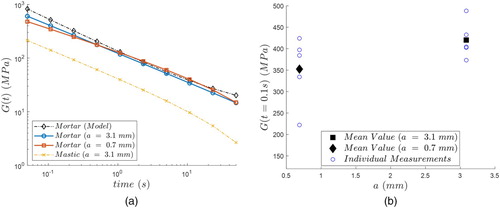
Table 4. Standard error from the mean of the indentation results at two frequencies.
As seen in Figure (a) the average for mortar using both indenter-specimen contact radii are basically identical. However, the results are more scattered for the indentation tests performed at a smaller scale a (i.e.
mm); this is illustrated in Figure (b) where the individual
(
s) for each indentation test are shown. It can be seen that there is a large scatter at the small
mm when it is compared to the indentation performed at larger
mm; accordingly, it may be argued that the higher variability of measurement at smaller contact area sizes is due to the effect of individual material phases, i.e. of mastics and aggregates, on the measured response. It may be argued accordingly, that minimum
curves measured with indentation tests at
mm should be more representative for mastics. This is further examined in Figure , where the individual indentation tests that resulted in the minimum
curves are presented for mortar using both indenter-specimen contact radii. It can be shown that the
value obtained with the small
is less than its counterpart value at larger a for all time periods. And thus the properties measured with indentation tests at
mm are closer to the mastic properties than to the homogenised mortar properties. Additionally, Figure (a) compares the
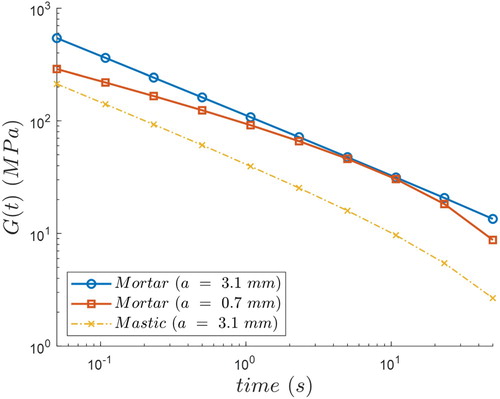
obtained using the simulations for mortar as compared to the indentation results. As seen mortar properties predicted computationally are in quite good agreement with the average properties measured with indentation tests.
Figure 10. for the softest tests measured of the indentation of the mortar at two different indenter-specimen contact radii and the average
for mastic.
Conclusions
From the modelling results presented, it’s clear that the indentation test can capture the multiscale properties of asphalt mortars. The indentation scale, as represented by the contact area radius , has a profound effect on the measured shear relaxation modulus
: the smaller the indenter-specimen contact area, the closer is the measured
to the corresponding value for the sub-mortar phase (aggregates 0.6 mm and smaller). Increasing the indentation radius
increases the value of
as it approaches the homogenised
of the mortar phase (aggregates between 0.6 and 2.36 mm) obtained using the PBC on the RVE, which acts as an asymptote for the results.
The smallest indenter-specimen contact radius to obtain representative mortar properties was about 8 mm, i.e. about 3.4 times the diameter of the largest aggregate. This resulted in an average measurement difference below 10% as compared to the homogeneous mortar.
The contact pressure distribution deviates from the Hertzian distribution due to the presence of aggregates, especially for larger values of . As
increases, the indentation test interacts with more aggregates resulting in increase in measured
.
Based on the performed simulations, the influence of indentation depth on the test measurements is small as long as the contact area remains the same.
These conclusions are further supported with the results of the brief experimental study performed. It is shown that the indentation of bitumen-filler mastics provides results that are in close agreement with the
obtained using DSR. Comparative indentation tests performed on mortar at two different indenter-specimen contact areas show that indentation tests can be used to capture mortar viscoelastic properties with high repeatability. Furthermore, in-line with the computational findings, the obtained experimental results indicate that the indentation tests performed at smaller contact areas allow to capture the properties of individual phases in mortar composites. Thus the indentation testing has a high potential in obtaining multiscale mechanical properties of asphalt mortars. Reliable determination of individual phase properties in mortars would however require tests performed at smaller contact areas and at more accurate load control. Furthermore, the accuracy of indentation testing in multi-scale characterisation bitumen-aggregate composites will, of course, depend on their volumetric composition, aggregate sizes used, etc. Comprehensive evaluation of the indentation testing applicability to characterisation of different specific asphalt mortar types is, however, beyond the framework of this paper and is intended as a part of future research.
Acknowledgments
The authors would like to thank Dr X. Lu, Nynas AB for providing the material used for the experimental study. The authors are also indebted to Mr M. Öberg for the indispensable help in setting up the load cell used in the indentation experiments.
Disclosure statement
No potential conflict of interest was reported by the authors.
ORCID
Hassan Fadil http://orcid.org/0000-0001-9875-3913
Denis Jelagin http://orcid.org/0000-0002-0596-228X
Per-Lennart Larsson http://orcid.org/0000-0001-6232-8819
Manfred N. Partl http://orcid.org/0000-0002-1041-0244
References
- Alanazi, N., Kassem, E., Grasley, Z., & Bayomy, F. (2017). Evaluation of viscoelastic Poisson’s ratio of asphalt mixtures. International Journal of Pavement Engineering, 1–8. doi: 10.1080/10298436.2017.1398550
- Asphalt Institute. (2001). HMA construction, manual series no. 22 (MS-22). Lexington, KY: Asphalt Institute.
- Benedetto, H. Di, Delaporte, B., & Sauzéat, C. (2007). Three-dimensional linear behavior of bituminous materials: Experiments and modeling. International Journal of Geomechanics, 7(2), 149–157. doi: 10.1061/(asce)1532-3641(2007)7:2(149)
- Fadil, H., Jelagin, D., & Larsson, P. L. (2018). On the measurement of two independent viscoelastic functions with instrumented indentation tests. Experimental Mechanics, 58(2), 301–314. doi: 10.1007/s11340-017-0342-7
- Gudmarsson, A., Ryden, N., Di Benedetto, H., & Sauzéat, C. (2015). Complex modulus and complex Poisson’s ratio from cyclic and dynamic modal testing of asphalt concrete. Construction and Building Materials, 88, 20–31. doi: 10.1016/j.conbuildmat.2015.04.007
- Jäger, A., Lackner, R., & Eberhardsteiner, J. (2007). Identification of viscoelastic properties by means of nanoindentation taking the real tip geometry into account. Meccanica, 42(3), 293–306. doi: 10.1007/s11012-006-9041-7
- Jelagin, D., & Larsson, P. L. (2013). Measurement of the viscoelastic properties of bitumen using instrumented spherical indentation. Experimental Mechanics, 53(7), 1233–1244. doi: 10.1007/s11340-013-9725-6
- Johnson, K. L., & Keer, L. M. (1986). Contact mechanics. Journal of Tribology, 108, 659. doi: 10.1115/1.3261297
- Lejeunes, S., & Bourgeois, S. (2011). Une Toolbox Abaqus pour le Calcul de Propriétés Effectives de Milieux Hétérogènes [An Abaqus toolbox for the calculation of effective properties of heterogeneous media]. 10ème Colloque National En Calcul Des Structures, 1–9. Retrieved from https://hal.archives-ouvertes.fr/hal-00592866
- Nynas 70/100 Paving Grade Bitumen Specifications. (2010). Retrieved from https://notes.nynas.com/Apps/1112.nsf/wpds/GB_EN_Nynas_70_100/$File/Nynas_70_100_GB_EN_PDS.pdf
- Perraton, D., Di Benedetto, H., Sauzéat, C., Nguyen, Q. T., & Pouget, S. (2018). Three-dimensional linear viscoelastic properties of two bituminous mixtures made with the same binder. Journal of Materials in Civil Engineering, 30(11), 04018305. doi: 10.1061/(asce)mt.1943-5533.0002515
- Pontuso, J. F. (2005). Havel’s vanek plays: Disobedience and responsibility. Perspectives on Political Science, 34(1), 4–15. doi: 10.3200/PPSC.34.1.4-15
- Schapery, R. A., & Park, S. W. (1999). Methods of interconversion between linear viscoelastic material functions. Part II - an approximate analytical method. International Journal of Solids and Structures, 36(11), 1677–1699. doi: 10.1016/S0020-7683(98)00060-2
- Tarefder, R., & Faisal, H. (2014). Nanoindentation characterization of asphalt concrete aging. Journal of Nanomechanics and Micromechanics, 4(1), A4013003. doi: 10.1061/(asce)nm.2153-5477.0000061
- Tarefder, R. A., & Zaman, A. (2011). Characterization of asphalt materials for moisture damage using atomic force microscopy and nanoindentation. Nanotechnology in Civil Infrastructure, 237–256. doi: 10.1007/978-3-642-16657-0_9
- Veytskin, Y., Bobko, C., & Castorena, C. (2016). Nanoindentation investigation of asphalt binder and mastic viscoelasticity. International Journal of Pavement Engineering, 17(4), 363–376. doi: 10.1080/10298436.2014.993393
- Wang, L. (2011). Mechanics of asphalt: Microstructure and micromechanics - access engineering. [s.l.]: McGraw-Hill Education.
- Zhang, Y., & Leng, Z. (2017). Quantification of bituminous mortar ageing and its application in ravelling evaluation of porous asphalt wearing courses. Materials and Design, 119, 1–11. doi: 10.1016/j.matdes.2017.01.052
- Zofka, A., & Nener-Plante, D. (2011). Determination of asphalt binder creep compliance using depth-sensing indentation. Experimental Mechanics, 51(8), 1365–1377. doi: 10.1007/s11340-011-9464-5