
 ?Mathematical formulae have been encoded as MathML and are displayed in this HTML version using MathJax in order to improve their display. Uncheck the box to turn MathJax off. This feature requires Javascript. Click on a formula to zoom.
Abstract
Field ageing is investigated based on recovered binders. Fifteen sections were considered, consisting of unmodified and polymer-modified binders (PmB). Binders were recovered from the wearing course, after slicing the cores horizontally. To assess field and laboratory ageing tendencies, recovered binders were compared to a set of reference binders, tested before and after laboratory ageing. For three sites, the binders recovered from bottom slices were long-term aged and compared to the properties of top slices. Stiffness-based rheological parameters showed good relations to the carbonyl index. Field and laboratory ageing induced the same trends, but field ageing often turned out to be more severe. It was shown, for three sections, that a standard ageing test applied to the bottom slices is not enough to reach the ageing levels of the top slices. Finally, a relation between the vertical ageing profile and the void content of the corresponding asphalt mixtures was observed.
1. Introduction
The ageing of bituminous binders is one of the key factors determining the lifetime of an asphalt pavement. Over time, the binder keeping the aggregates together hardens and becomes brittle, resulting in a higher sensitivity for crack formation, ravelling and stone loss. Recently, several binder indicators have been proposed to evaluate surface, non-load associated cracks (Blankenship et al., Citation2010; Anderson et al., Citation2011; Anderson, Citation2019; Elwardany et al., Citation2019; Hajj et al., Citation2019; King et al., Citation2012; Reinke et al., Citation2016; Rowe, Citation2011). An example is delta Tc (ΔTc), defined as the difference between the limiting temperature for stiffness and m-value measured by a bending beam rheometer (BBR). Another proposal, in fact based on older correlations between binder ductility and crack formation, is the value of G′/(η′/G′) at 15°C and 0.005 rad/s. King et al. (Citation2012) showed that a direct graphical presentation of the risk for block cracking is obtained, by plotting G* and δ, at 0.005 rad/s, 15°C, in a Black diagram together with limiting levels. Parameters related to crossover values (G′′ = G′) have also been investigated (Cucalon et al., Citation2019; Farrar et al., Citation2013), as well as correlations with phase angle data (Daniel et al., Citation2018) and the R-index (Rowe & Sharrock, Citation2016).
In the literature, many authors have reported differences between binder properties in field ageing and in accelerated laboratory ageing tests (Daniel et al., Citation2018; Elwardany et al., Citation2018 & Citation2017; Farrar et al., Citation2013; Li et al., Citation2017; Liu et al., Citation2014, Lu et al., Citation2011; Mirwald et al., Citation2020, Citation2021; Petersen and Glaser (Citation2011); Planche et al., Citation2018; Reinke et al., Citation2016). For example, Daniel et al. (Citation2018) and Reinke et al. (Citation2016) observed that field ageing, specifically for recovered top layer material, appeared to be more age-hardened as would be predicted by standard protocols. In van Lent et al. (Citation2016) the authors report that in laboratory ageing, unwanted ageing side-effects may take place in the binder, because of higher temperatures and higher pressures in, for example, the pressure ageing vessel (PAV), and due to the absence of other pavement constituents such as filler, sand and aggregates. These authors propose to perform laboratory binder ageing directly in an asphalt concrete mixture. Elwardany et al. (Citation2018, Citation2017) developed a procedure to determine the laboratory ageing duration, best reflecting field ageing as a function of climatic conditions, pavement depth and pavement age. This was based on the long-term ageing of loose asphalt mixtures. Among other recommendations, Hagos (Citation2008) proposed the use of a weatherometer to simulate field ageing of porous asphalt. Li et al. (Citation2006) observed minimal differences for an unmodified binder between lab and field ageing. But, for two PmBs, the polymer effect was still present after PAV ageing, while it was less clear in the recovered field-aged binders. In papers by Mirwald et al. (Citation2021, Citation2020), the authors propose to combine atmospheric oxygen with traces of reactive oxygen species as a more realistic simulation of field ageing in the laboratory.
Field ageing is dependent on the climatic conditions and on the pavement itself (e.g. thickness, air void content and distribution). It has been reported that open-graded pavements with a high void content age much faster compared to dense asphalt concrete (Lu et al., Citation2011). It has also been demonstrated that pavements with low levels of air voids are ageing very little, at least this was shown when investigating binders recovered from the whole surface layer. But, in a pavement the ageing is a non-homogenous phenomenon, ageing is more at the surface and decreases with depth into the pavement (Daniel et al., Citation2018; Farrar et al., Citation2013; Gallet et al., Citation2010; Jing, Citation2019; Li et al., Citation2006; Lopes et al., Citation2014). Although this has been demonstrated clearly in the literature, only recently it has become common practice to cut the asphalt cores along pavement depth into thin horizontal slices (typically of a height between 13 and 5 mm) and to recover the binder from slices at different depths separately. When investigating recovered binders from top slice portions, it has become clear that also dense mixes can undergo extensive ageing (Farrar et al., Citation2013).
In this study, a substantial number of sites have been considered, mainly situated in Europe, one site was located in Morocco. A variety of asphalt surfaces were incorporated, ranging from highways, intercity roads, an airport section and even a race track. The asphalt mixes consisted of unmodified as well as PmBs. Binders were recovered from the wearing course, after cutting the cores into thin slices. In addition, chemical tests, including Fourier Transform Infrared Spectroscopy (FTIR) and fractionation into Saturates, Aromats, Resins and Asphaltenes (SARA), were conducted. Rheological tests, based on 25, 8 and 4 mm plates were carried out, so that the complete rheological master curve from the glassy up to the flow region could be assessed. Traditional as well as newly proposed parameters were considered. Preliminary results have been published (Soenen et al., Citation2021, Citation2022). A first objective of this paper is to evaluate how bituminous binders age in field sites, when embedded in a road surface, in particular how the rheological properties change. A second objective is to compare field ageing to the pressure ageing vessel (PAV) test. A final objective is to evaluate the ageing gradient inside the wearing course, and how this depends on the void content of the asphalt mixture. As this study has resulted in a lot of data, it further allows one to evaluate trends within the rheological factors and between chemical and rheological data. At this stage, climatic data, traffic or performance-evaluations are not considered.
2. Experimental
2.1. Pavement sites
A geographical overview of the sites is presented in Figure . In Table further details, such as the binder and mix type of the various sections are presented. From the 15 sections, 14 consisted of asphalt cores while for 1 section, FR4, the wearing course was already milled. This is referred to as reclaimed asphalt (RA). Eight sections contained PmBs, all based on styrene–butadiene copolymers. Five sections were unmodified and two sections, DK2 and DK3, were based on a crumb rubber modification (CR). In cases the penetration of the original binders was known, it is included in Table .
Figure 1. Overview of the pavement sites, including the service life in years (y).
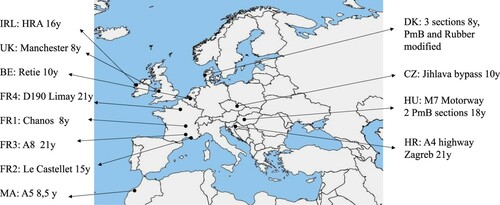
Table 1. Information of the field sections: original binder, pavement age and mix type.
2.2. Coring, slicing and binder recovery
Field cores could only be taken, combined with road works, such as resurfacing or maintenance measures. Typically, the cores were taken between the wheel path, although in some cases, as in Czech Republic, they were taken from the side of the road. In Le Castellet (FR2), cores were taken all along the racetrack. In Belgium and Hungary, the cores were taken in a small part of the road (within a few metres). The core diameter varied between 90 and 150 mm, except for IRL, where it was 200 mm, as that section contained large aggregates. On all the cores, the bulk density was measured by gamma rays according to EN 12697-7. ‘Bituminous mixtures – Test method for Hot mix asphalt – Part 7: Determination of the bulk density of bituminous specimens by gamma rays.’ The maximum density was either measured or known from old mix design records. The pavement site in Denmark was a test site, for these three test sections more information was available, such as the polymer content of the PmB binder and some rheological data on the original binder. Original binders as such were not available, for none of the sections.
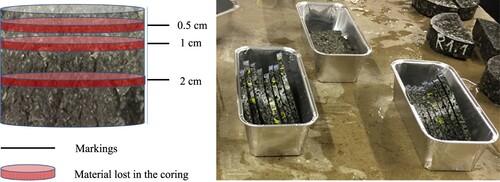
The asphalt cores were cut into slices before recovering the binder. The number of cores used in the slicing and recovery procedure varied between 3 and 9, depending on the core diameter and the number of available cores. Before cutting these cores, markings were placed on the asphalt. Typically, the marking for slice 1 (S1) was set at 0.5 cm from the top surface, for slice 2 (S2) at 1 cm, for slice 3 (S3) at 2 cm and further slices every cm. After setting the markings, the cutting was conducted on these lines. As the sawing blade had a thickness of 2.3 mm, some material was lost in the cutting procedure. The lowest slice was larger as it was practically not possible to cut the last slice at 1 cm spacing. Slices from different cores, but from the same slice depth, were recovered as one sample. This resulted in binder amounts per slice varying between 15 and 75 g. The procedure and the collection of the slices are illustrated in Figure .
Figure 2. Schematic of the slicing and some photographs of the slices before recovery.
In Table , the average void content of the cores used in the recovery is represented. The highest and lowest levels, measured on individual cores, are indicated between brackets. The wearing course thickness, with minimum and maximum values, is indicated, and the number of slices for each section. Normally, the top slice was cut at 0.5 cm, except for FR1 and IRL, where it was 1 cm. The binder percentage, in Table , was determined in the recovery step, the average of all slices is indicated.
Table 2. Void contents, thickness wearing course, binder content and number of separately recovered slices for each section.
Recovery was conducted according to EN 12697, with an automated asphalt analyser and trichloroethylene as the solvent. In the literature, several problems have been associated with binder recoveries from asphalt (Hospodka et al., Citation2018; Nösler et al., Citation2008). The most important effects are related to the presence of rest solvent, the presence of filler, incomplete recovery, possible contaminations and continued ageing.
In this study, two problems were noted. For two sections, MA (all the slices) and FR3 (all the slices), the presence of the rest solvent was observed. Upon heating, small bubbles were noted, although no solvent signals were seen in the FTIR spectra. An extra vacuum sweep was conducted on these samples to remove all the solvents. The extra vacuum sweep did not influence the FTIR spectrum, but it affected the rheological properties. It was also verified on a standard reference binder that this extra vacuum treatment did not influence the properties of this binder. The second problem was related to contamination, for several recovered binders the presence of silicon compounds was observed in the FTIR spectra. In these spectra, a small absorption was noted at 1260 cm−1 wavenumber, typical for a C–Si stretch. Further testing indicated that the weight percentage of these silicon compounds was below 0.3%, without further influence on the properties.
2.3. Other samples
A reference set of unmodified binders was collected in the market between 2012 and 2014, consisting of a total of 13 binders, nine 50/70 pen grade and four 70/100 pen grade binders. This reference set consisted of straight-run, solvent-precipitated, visbroken and blended binders, including binders with very low and extreme ageing sensitivities. This set was investigated before and after laboratory ageing, by the test methods as described in Section 2.4. The ageing consisted of the short-term rolling thin film oven test (RTFOT), EN 12607, followed by the long-term pressure ageing vessel (PAV) test, under standard conditions 100°C, EN 14769.
Finally, for three sections, HR, BE and UK, the binder from the bottom slice was aged in the PAV, at 100°C, according to EN 14769. These tests were conducted to check if a PAV cycle, which is considered a long-term ageing test, induces a change comparable to the property difference between top and bottom slice. Another aim was to see what levels can be reached by a standard PAV-ageing at 100°C. Is this ageing test sufficient to reach the ageing levels of the top slices? For these samples smaller containers were used, adapting the amount of binder as is allowed in EN 14769.
2.4. Test methods
2.4.1. FTIR
FTIR measurements were conducted with a Nicolet IS 10 with an attenuated total reflection (ATR) set-up, based on a diamond crystal. To prepare the test sepcimens, samples were heated to about 170°C so that a drop of material could be placed on the ATR crystal. Heating times varied between 10 and 30 min and were kept as short as possible. A measurement consisted of 32 scans, recorded at a data spacing of 0.482 cm−1. Before each test, a new background scan was recorded. Most samples were tested in two repeats.
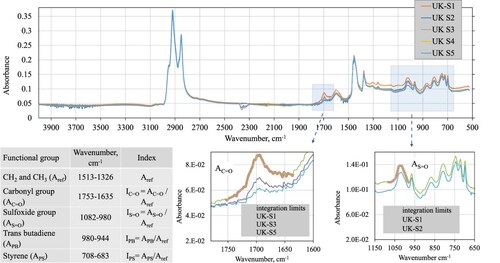
From the spectra, the C–H bending, the carbonyl, the sulphoxide and polymer-related absorptions were integrated. For SBS, a polystyrene-related absorption was noted at 699 cm−1, assigned to an out-of-plane bending of the CH groups in the aromatic ring, and a polybutadiene-related absorption at 966 cm−1, assigned to an out-of-plane wagging of the CH groups near the double bond in trans-polybutadiene units (Munteanua & Vasile, Citation2005). Indices were obtained by dividing the respective absorptions with the sum of the –CH2– absorption at 1460 cm−1 and the –CH3 absorption at 1376 cm−1. Different integrating procedures are available (Hofko et al., Citation2017 & Citation2018), in this study the integration was performed according to Dony et al. (Citation2016). In Figure , some FTIR spectra are illustrated, including the limits of the respective integrations, some examples of integrations and calculations of various indices. The main changes in the FTIR spectra when comparing slices were seen in the carbonyl region and the region below 1360 cm−1.
Figure 3. An example of FTIR spectra, peak integrations and the calculation of indices.
In Table , a repeatability check, based on the HU2 section, is presented. All slices were tested in four repeats. Average values, standard deviation (SD) and the coefficient of variation (COV) are calculated. It seems that the COV increases as the absorption decreases. This is most obvious for the carbonyl index. It indicates that repeatability is worse for smaller absorption levels. Therefore, in the graphs of FTIR indices, absolute values were used to indicate the repeatability error bars. Maximum levels were used, for carbonyl and sulphoxide this was 0.004 and for the SBS indices, it was 0.001.
Table 3. Example of the repeatability of the FTIR indices for one site.
2.4.2. SARA fractionation
For the SARA fractionation, the asphaltenes were first separated based on IP143, afterwards the maltenes were further divided into saturates, aromats and polar I (resins) based on IP 469. Only top and bottom slices were investigated by the SARA fractionation. Repeatability levels reported in the respective norms were used. More information on precision and reproducibility are available in Simnofske and Mollenhauer (Citation2019). More details on the technique can be found in Ray et al. (Citation1981).
2.4.3. Rheological tests
Dynamic shear rheometer (DSR) measurements were conducted using Anton Paar Rheometers; frequency-temperature sweeps from 0.01 to 10 Hz were recorded with the 25, 8 and 4 mm plate-plate geometry: 25 mm plate tests were recorded at the following conditions; 1 mm gap, 1% strain and from 50 to 90°C, in steps of 10°C. 8 mm plate tests at 2 mm gap, 0.05% and from 10°C to 50°C (or 60°C), and 4 mm plate tests at 1.75 mm gap, 0.02% strain and from 6°C to −24°C (−30°C) in steps of 6°C (with an extra sweep at 10°C). The 4 mm plate tests were recorded in two replicates, one measurement was conducted for 8 and for 25 mm plate tests. Equilibrium times were 10 min for 8- and 25 mm plates and 20 min for the 4 mm plate tests, at each test temperature. As the thermal history in the 4 mm DSR tests was not the same as for the standard BBR tests, the critical temperatures derived from both types of measurements are also expected to be different. The sample preparation for the rheological tests was similar to the FTIR tests. Once the samples were liquid, they were poured into silicon moulds, having the diameters of the respective plate geometries. After stiffening, the samples were loaded in the rheometer. For 8- and 4 mm tests, the plates were preheated to obtain good adhesion between sample and plate. A detailed description of the 4 mm testing procedure can be found in Gražulytė et al. (Citation2021).
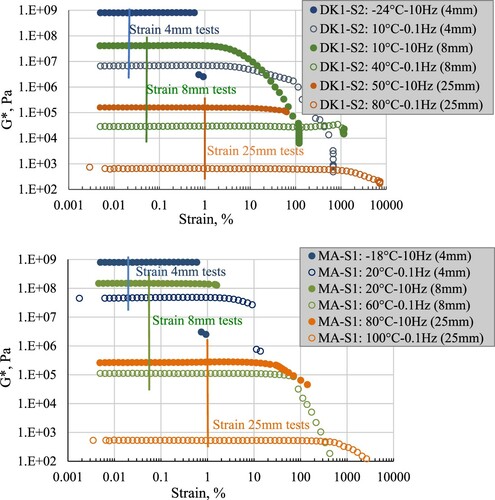
The selection of the strain levels was based on experience, and for some samples, a highly modified one and a severely aged one, strain sweeps were conducted. Two examples are presented in Figure . High and low temperature ranges of each geometry were tested. The selected strain levels are well within the linear viscoelastic range. For the tests at the lowest temperatures, the samples break inside the linear viscoelastic range, typical for a brittle fracture. It was verified visually, after the test, that this failure was related to a binder fracture and not due to a loss of adhesion between binder and plate.
Figure 4. Illustration of the selection of strain levels for two binders.
The construction of master curves and the calculation of single stiffness, phase angle or slope values were based on the Rhea software (beta version 4). Different rheological parameters were calculated, as explained in Table .
Table 4. Parameters calculated by the Rhea software (beta version 4) (Abatech).
The repeatability was estimated by performing the Rhea calculations on different repeats. For G-R and CR-stiffness and CR-frequency, the repeatability COV was below 5%. For the R-index the repeatability was <1% and for the CR temperature the error was <0.2°C. For LSTDSR and LmTDSR the maximum deviations between both repeats were respectively 0.5°C and 0.3°C, these values were used as the error bars. Besides the calculated penetration, penetrations of 16 recovered binders were also measured. Comparing calculated and measured values showed that the calculated penetration compared within 10% to the measured penetration for pen values <35 dmm, and within 20% for pen levels ≥35 dmm. These values were used as the error bar for the calculated penetration.
3. Results
The results are subdivided in three sections; the first section discusses the properties of the recovered binders, chemical as well as mechanical properties. In a second section, the recovered binders are compared to laboratory aged binders, and in a third section, the ageing profile in the wearing course is compared to the void content of the respective asphalt mixtures.
3.1. Properties of recovered binders
3.1.1. Chemical properties
As reported in the experimental section, the main changes in the FTIR spectra, when comparing slices from different depths, were seen in the carbonyl region and the region below 1360 cm−1. The absorptions related to saturated aliphatic compounds remained almost constant in all cases. Therefore, it was concluded that ultraviolet (UV) effects were not observed in these recovered binders. According to Feng et al. (Citation2016) and Soenen et al. (Citation2012), UV radiation induces C–C bond cleavage and should result in a decreased absorption of these compounds in the FTIR spectra.
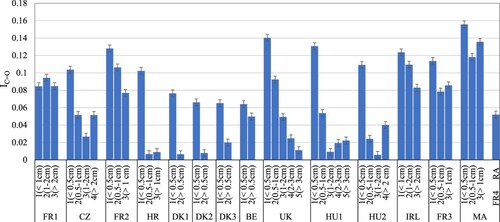
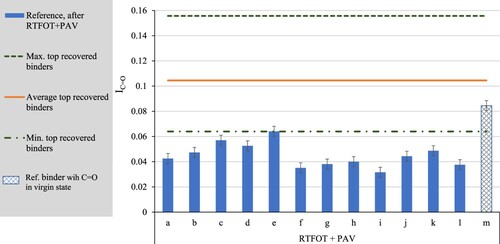
In Figure , IC=O of the various sections and slices is represented. For most sections, except for FR1, the top slice has the highest carbonyl index, and deeper slices have lower carbonyl levels. In some sections, this change is gradual, for example, the UK section, while in others the main differences take place between the first and the second slices, for example, the HR section. In some cases, the bottom slices seem to have again a higher carbonyl level, for CZ and HU2 for example, it is not clear yet how this can be explained. Trends for the IS = O were similar but less pronounced (not shown).
Figure 5. Carbonyl index of all slices.
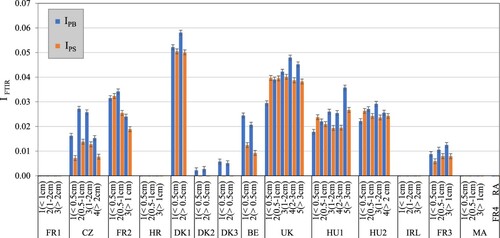
The FTIR indices related to styrene and butadiene are represented in Figure . For all PmB sections, FTIR detects the presence of polymer. For the two sections based on crumb rubber, the butadiene signal is also present. When comparing the SBS slices, it seems that the polystyrene content remains rather constant, while the butadiene double bond decreases towards the top slice. Especially for the sections with larger PmB absorptions, DK1 and UK, this is obvious. Larger PmB absorptions are related to higher PmB concentrations (Masson et al., Citation2001). In the literature, it has been shown that the double bond of polybutadiene is more reactive to oxygen as compared to the styrene ring structure (Lu & Isacsson, Citation1998 Masson et al., Citation2001;)
Figure 6. Butadiene and styrene indices for all slices.
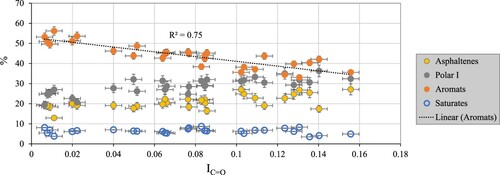
The SARA fractions of top and bottom slices are presented in Figure , only a number of representative sections are shown for clarity. The change in ageing degree between top and bottom slices is as expected: an increase in asphaltenes, combined with a decrease in aromats, and in most cases also an increase in resins. Saturates are not affected. This is also shown in the relations between the SARA fractions and the carbonyl index, Figure . As the carbonyl index increases, the percentage of aromats decreases.
Figure 7. SARA fractions of top and bottom slice, only some sections are shown.
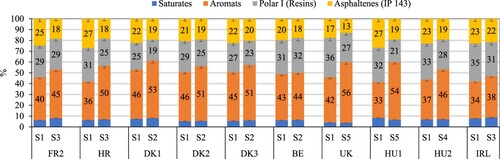
Figure 8. Relations between SARA fractions and carbonyl index.
3.1.2. Frequency sweeps and black curves
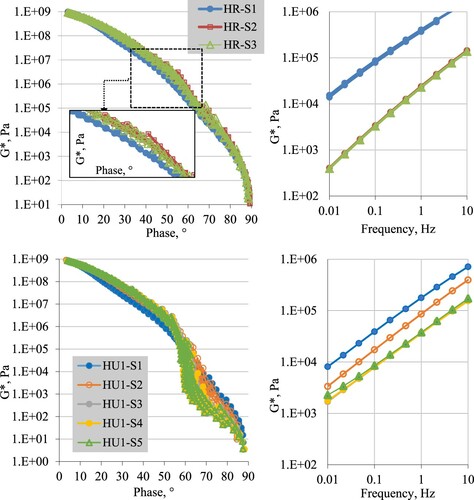
Rheological data are shown in Figure for two test sections, HR an unmodified and HU2 a polymer-modified section. For both sections, differences between top and bottom slices were already clear from the chemical properties. Black plots, left graphs and frequency sweeps at 50°C, right graphs are presented. The data show that top versus bottom slices have differences in the shape of the black curves, and differences in the stiffness at 50°C. For the unmodified section, the black curve is shifted to the more elastic side for the top slice. The effect is small but observable in the magnified image, inserted in the left graph. The change in stiffness at 50°C is obvious. For the PmB section, the trends in the black curve are similar, but combined with a decrease in the elasticity of the polymer network, which becomes obvious at lower modulus levels, below around 100 kPa. A stiffness difference between the slices at 50°C is also clear.
Figure 9. Black plots, left, and frequency sweeps at 50°C, right, of all slices derived from the HR and the HU2 section.
3.1.3. Calculated rheological parameters
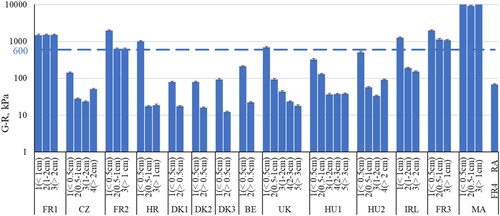
In this section, selected rheological characteristics are presented. Figure shows the calculated penetration, error bars refer to the observed variation between calculated and measured penetration. In most cases, the top slice is harder compared to the bottom slices, although in some cases the bottom slice is again stiffer than the previous slice. A similar observation was already made for the carbonyl index. In some sections, FR1, FR3 and MA, the binders have become very stiff, with penetrations down to 5–6 dmm. In Figure , G-R values are presented. The limiting level of 600 kPa is also plotted (Daniel et al., Citation2018). For some sections, all slices fall below this limit, and in other cases all slices fall above. In some cases, like the HR section, only the very thin top slice is above the 600 kPa limit, while the lower slices are below this value.
Figure 10. Calculated penetration at 25°C for all sections and all slices. The penetration of the original binder is added, if known.
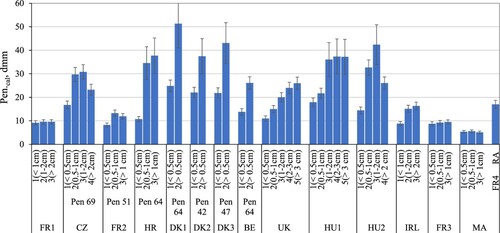
Figure 11. G-R for all sections and all slices.
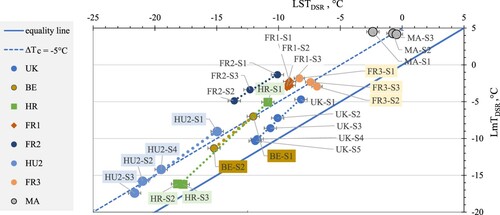
LmTDSR versus LSTDSR values are presented in Figure . In some cases, LmTDSR has increased to rather high temperatures, for example, the French sections have values around −3, −2°C and the Moroccan section reaches +4°C. This would correspond to low PG grading temperatures of around −12°C and −6°C, respectively. Regarding ΔTc DSR, in most cases ΔTc DSR becomes more negative towards the top slice, this is seen for unmodified and PmB binders. For the very stiff binders, FR3 and MA, LSTDSR of the top slices become more negative, while LmTDSR is changing in the expected direction. It is not clear yet, if this is a true field ageing effect, or if possibly other factors, related to the recovery process are involved. More clarification is needed on this observation.
Figure 12. LSTDSR versus LmTDSR for selected pavement sites (vertical error bars are equal to the symbol size).
3.1.4. Relations between data
In a first statistical approach, possible linear relations were considered, and Pearson’s correlation coefficients (r) were calculated, as is presented in Table . Only values ≤0.8 or ≤−0.8 are shown. As R-index is calculated from the CR-stiffness, only one of these parameters was included. The coefficients are deduced, including data from all binder types and slices.
Table 5. Overview of a two-variable linear regression analysis: Pearson’s correlation coefficients (r) are plotted (only r values ≥0.8 and ≤−0.8 are shown).
Table indicates linear interrelations between the rheological data: log(G-R), CR-temperature and log(CR-frequency) seem to be almost identical. These parameters relate also to Pen.Cal., LmTDSR and to some extend to LSTDSR. The less good correlation to LSTDSR could be explained by the difference in temperature range, LSTDSR being tested at very low temperatures, while the other data are tested in a different temperature frequency range. Still, it is strange to observe good correlations with LmTDSR. These rheological indicators are considered as temperature or stiffness or also point markers (Rowe, Citation2017), as opposed to parameters related to the shape of the black plot or master curve, such as the R-index, and the phase angle at a certain stiffness or the stiffness at a certain phase angle. In this study, shape parameters do not relate to any other parameter but to each other. Regarding ΔTc, Rowe (Citation2017, Citation2019) and Lesueur et al. (Citation2021) have shown that ΔTc is a shape parameter, it is the difference in position on the master curve of two specific points: one of the constant stiffness value and the other of the constant slope in the time domain. In their paper, Lesueur et al. showed that ΔTc correlates well to the R-index and explained the reasons for this. In our study, ΔTc DSR does not correlate to any of the other parameters and, therefore, it would classify as a separate type of measurement. There was a weak trend to R-index (R2 = 0.58), which improved slightly (R2 = 0.64) when removing the PmBs. Therefore, one reason for the weak trend could be related to the influence of polymer modification on the low-temperature rheology. Anderson (Citation2019) for example, stated that ΔTc is not relevant for PmBs. Probably a similar effect may be expected from binders containing natural wax. The presence of natural wax in these recovered binders was not evaluated.
Table indicates further that the FTIR data relate to rheological stiffness parameters, such as G-R, CR-frequency and CR-temperature. No relations were observed between FTIR data and rheological shape markers.
3.2. Laboratory versus field ageing
A direct comparison of field and laboratory ageing was not possible, since the original binders were not available, for none of the sections. Therefore, other ways of comparison were applied. A first possibility was based on the comparison of the field aged binders to a reference set of binders, collected from the market, aged in the laboratory and tested in the same way as the field aged binders. This comparison is not exact, but as the reference set consists of binders having extreme ageing susceptibilities, it can indicate trends. A second comparison was obtained for those sections showing a large difference between top and bottom parts. In those cases, the bottom parts were submitted to a standard long-term laboratory ageing procedure, with the aim to evaluate if, by applying this long-term ageing, the samples could reach the field-aged top parts.
In Figure , carbonyl indexes of the reference binders after RTFOT + PAV ageing are presented, together with the average, maximum and minimum levels of the field aged top parts. This comparison demonstrates that in fact all top parts are aged beyond the ageing conducted by RTFOT and PAV, as far as carbonyl index is concerned. When comparing the carbonyl indices of these reference binders to the bottom slices, these are shown in Figure , it is also obvious that some of the bottom parts have undergone less ageing as compared to the standard conditions. For one of the reference binders, the virgin binder already contained carbonyls, which explains why this binder has the largest value after ageing. Because of this reason that binder is marked in Figure . These types of acid binders have not been used in these field sections.
Figure 13. Comparison of carbonyl indices of reference binders after RTFOT + PAV to field-aged top slices.
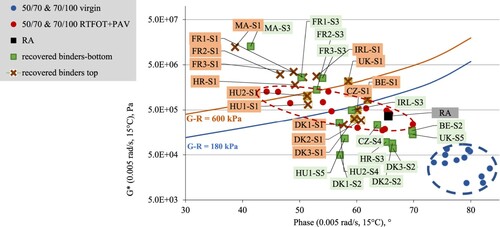
For the rheological properties, G-R data of the reference binders before and after ageing are presented in Figure , together with G-R of recovered top and bottom slices of the various sections. One can note that the direction of field ageing, moving from bottom to top slice, is similar to the changes observed due to laboratory ageing. None of the recovered binders is still located in the blue circle, representing the virgin binders. But some of the recovered bottom slices (green squares), are less aged as expected from RTFOT + PAV. And for the top slices, some are inside, and some are aged beyond what is obtained in RTOFT + PAV. The data show that comparisons between field and laboratory ageing depend on how the recovery is performed: the slice’s thickness and its depth in the wearing course.
Figure 14. Phase angle versus G* at 0.005 rad/s and 15°C, representing top and bottom slices and reference binders, before and after laboratory ageing.
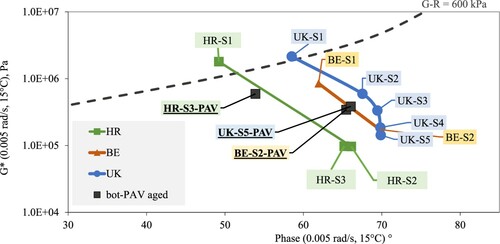
For three sections, HR, BE and UK, the bottom slice was aged in the PAV and its properties compared to the top slice. In Figure , G-R values are plotted in a black diagram, the PAV aged binders are marked by adding PAV to the country code and the slice number. One can note that upon ageing the bottom slices move in the correct direction, but one PAV ageing cycle is not enough to reach the top slices for these three examples. This corresponds to observations made in the literature: for example, Reinke et al. (Citation2016) showed that 40-h PAV is a better predictor of in-service bitumen ageing compared to 20-hour PAV ageing. This was reported for the Minnesota climate, considering top slices of 12.5 mm and eight years in service.
Figure 15. Phase angle versus G* at 0.005 rad/s and 15°C, including aged bottom slices.
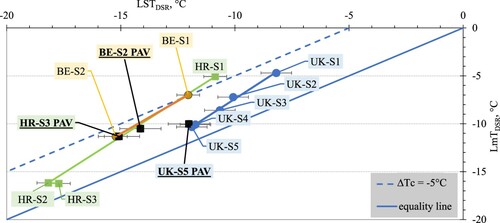
In Figure , data of various slices and the PAV aged bottom slice are plotted in an LSTDSR versus LmTDSR diagram. In this case, the PAV ageing of the bottom slice again moved the properties towards the top slice for the HR and BE sections, but for the UK section, the PAV aged bottom part did not change a lot. This binder was highly modified, as can be derived from the large IPB and IPS, in Figure . A possible explanation for the strange result in the limiting temperatures could be related to the fact that the binder sample is at rest in the PAV, a reason that has been mentioned before in the literature (Airey, Citation2003), and which led to the development of the Rotating Cylinder Aging Test (RCAT) (Verhasselt, Citation2003). RCAT ageing was not considered in this study.
Figure 16. LSTDSR versus LmTDSR, including the aged bottom slices.
3.3. Influence of mixture properties on the ageing profile
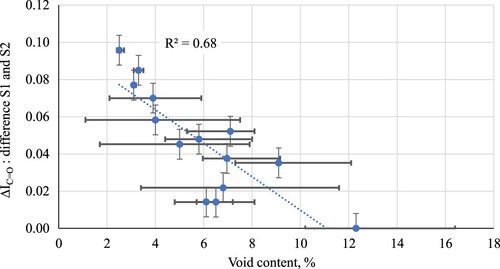
In this section, the ageing profiles of the surface course are compared to pavement or asphalt mixture properties. From the various parameters, such as pavement lifetime, binder content, only the void content showed a relation to the measured binder properties. In Figure the difference in carbonyl absorption of the first two top slices is presented as a function of the void content. The data show a trend, indicating that this difference becomes zero as the voids increase, and that oxygen penetrates easier when the void content is higher. It is expected that also the pavement lifetime as well as climatic conditions will further influence the ageing profile, therefore it is surprising to find already a good relation. Similar trends were noted with the change in rheological stiffness parameters and the void content.
Figure 17. Difference in carbonyl index of top and second slice versus the void content of the surface layer. Error bars for the void content are equal to the variation in void contents of the individual cores. For ΔIC = O the absolute error on IC = O is doubled.
4. Conclusions
In this study, binder ageing is investigated based on 15 field sections. The ageing profile is assessed by slicing the wearing course and evaluating the recovered binder from each slice separately. Chemical as well as rheological properties were determined. Several conclusions can be taken from this study.
From FTIR tests, carbonyl and SBS related indices have been calculated; the observations show that binders from top slices typically have a larger carbonyl index as compared to binders from lower slices. FTIR also distinguished PmBs from unmodified binders and from crumb rubber modified binders.
Rheology frequency-temperatures sweeps indicate that in most sections, due to an ageing gradient, top slices become stiffer compared to bottom slices. This is combined with a shift in the shape of the black curves. The presence of a polymer network and its degradation can be followed in the black curves in the lower stiffness ranges. The elasticity of the network decreases towards the top slice.
A large number of rheological indicators have been calculated from the frequency temperature sweeps; these parameters can be subdivided into stiffness and shape parameters, which relate well within their groups but not in-between. In this study, ΔTc DSR did not relate to the other rheological properties, only a weak trend with R-index was observed. The carbonyl and sulphoxide index related well to stiffness rheological indicators, relations to shape indicators or to ΔTc were not observed.
The relation between field and laboratory ageing was investigated in two ways, based on the comparison to a reference binder set and by submitting bottom slices to PAV ageing under standard conditions. These comparisons showed that trends between field and laboratory tests are similar, but for the top slices field ageing is often more severe when compared to the standard ageing tests. Some anomalies were observed for a highly modified PmB after PAV ageing, the low temperature limits LmTDSR and LSTDSR changed only very little due to PAV ageing. Further investigations are needed to clarify this observation.
The data also show that ageing-related binder parameters are dependent on how the binders are recovered, whether the cores are recovered in slices or whether the whole layer is recovered in one step. For the study of field ageing, and possible setting of limiting levels with regard to performance, the slice depth that is considered will have a large effect.
Finally, the changes in the carbonyl index between the first two top slices showed a trend with the mixtures void contents, despite the different pavement service lives and climatic conditions. Similar trends were observed between the change in stiffness rheological measurements and air void content, but coefficients of determination were less good.
Disclosure statement
No potential conflict of interest was reported by the author(s).
References
- Airey, G. D. (2003). State of the art report on ageing test methods for bituminous pavement materials. International Journal of Pavement Engineering, 4(3), 165–176. https://doi.org/https://doi.org/10.1080/1029843042000198568
- Anderson, R. M. (2019). Delta Tc - Concept and use, in ‘past, present, and future of asphalt binder rheological parameters’. Transportation Research Circular E-C241, 22–44. http://onlinepubs.trb.org/onlinepubs/circulars/ec241.pdf
- Anderson, R. M., King, G. N., Hanson, D. I., & Blankenship, P. B. (2011). Evaluation of the relationship between asphalt binder properties and non-load related cracking. AAPT, 80, 651–664.
- Blankenship, P. B., Anderson, R. M., King, G. N., & Hanson, D. I. (2010). AAPTP PROJECT 06-01; A Laboratory and field evaluation to develop test procedures for predicting non-load associated cracking of airfield HMA pavements, AMEC Project No. 09-119-00948, https://www.eng.auburn.edu/research/centers/ncat/files/aaptp/Report.Final.06-01.pdf
- Cucalon, L. G., Kaseer, F., Arámbula-Mercado, E., Martin, A. E., Morian, N., Pournoman, S., & Hajj, E. (2019). The crossover temperature: significance and application towards engineering balanced recycled binder blends. Road Materials and Pavement Design, 20(6), 1391–1412. https://doi.org/https://doi.org/10.1080/14680629.2018.1447504
- Daniel, J. S., Yin, F., Martin, A. E., Arámbula-Mercado, E., Newcomb, D., Planche, J.-P., Adam Pauli, A., Farrar, M., Huang, S.-C., Reinke, G., Hanz, A., Fee, F., Engber, S., Herlitzka, D., & Ryan, M. (2018). TRANSPORTATION RESEARCH CIRCULAR E-C234, Relationships of Laboratory Mixture Aging to Asphalt Mixture Performance, August, http://www.trb.org/Main/Blurbs/178080.aspx
- Dony, A., Ziyani, L., Drouadaine, I., Pouget, S., Faucon-Dumont, S., Simard, D., Mouillet, V., Poirier, J. E., Gabet, T., Boulange, L., Nicolai, A., & Gueit C. (2016, June 1–3). MURE National Project: FTIR spectroscopy study to assess ageing of asphalt mixtures. Eurasphalt & Eurobitume Congress, Prague. https://doi.org/https://doi.org/10.14311/EE.2016.154
- Elwardany, M. D., Planche, J.-P., & Adams, J. J. (2019). Determination of binder glass transition and crossover temperatures using 4-mm plates on a dynamic shear rheometer: Significance and applications. Transportation Research Record: Journal of the Transportation Research Board, 2673(10), 247–260. https://doi.org/https://doi.org/10.1177/0361198119849571
- Elwardany, M. D., Rad, F. Y., Castorena, C., & Kim, Y. R. (2017). Evaluation of asphalt mixture laboratory long-term ageing methods for performance testing and prediction. Road Materials and Pavement Design, 18(sup1), 28–61. https://doi.org/https://doi.org/10.1080/14680629.2016.1266740
- Elwardany, M. D., Rad, F. Y., Castorena, C., & Kim, Y. R. (2018). Climate-, depth-, and time-based laboratory aging procedure for asphalt mixtures. AAPT, 87, 467–511. https://doi.org/https://doi.org/10.12783/AAPT2018/33815
- Farrar, M. J., Turner, T. F., Planche, J.-P., Schabron, J. F., & Harnsberger, P. M. (2013). Evolution of the crossover modulus with oxidative aging. Transportation Research Record: Journal of the Transportation Research Board, 2370(1). https://doi.org/https://doi.org/10.3141/2370-10
- Feng, Z. G., Bian, H. J., Li, X. J., & Yu J-Y. (2016). FTIR analysis of UV aging on bitumen and its fractions. Materials and Structures, 49(4), 1381–1389. https://doi.org/https://doi.org/10.1617/s11527-015-0583-9
- Gallet, T., Dreessen, S., Dumont, A., & Pittet, M. (2010, August 1–6). Aging gradient in a 19 year-old wearing course in Switzerland. 11th international Conference on Asphalt Pavements (ISAP) Nagoya, 1624.
- Gražulytė, J., Soenen, H., Blom, J., Vaitkus, A., Židanavičiūtė, J., & Margaritis, A. (2021). Analysis of 4-mm DSR tests: calibration, sample preparation, and evaluation of repeat-ability and reproducibility. Road Materials and Pavement Design, 22(3), 557–571. https://doi.org/https://doi.org/10.1080/14680629.2019.1634636
- Hagos, E. T. (2008). Ph. D., The effect of aging on binder properties of porous asphalt concrete. Delft.
- Hajj, R., Filonzi, A., & Bhasin, A. (2019). TECHNICAL REPORT 0-6925-1, Improving the Performance-Graded Asphalt Binder Specification: Final Report, http://library.ctr.utexas.edu/ctr-publications/0-6925-1.pdf
- Heerden, J. V., Jenkins, K. J., Harmse, G., Joubert, J. C. (2011, September 11–14). The use of the dynamic shear rheometer (DSR) to predict the penetration of bitumen. 10th Conference on Asphalt Pavements for Southern Africa.
- Hofko, B., Alavi, M. Z., Grothe, H., Jones, D., Harvey, J. (2017). Repeatability and sensitivity of FTIR ATR spectral analysis methods for bituminous binders. Materials and Structures, 50(3), 187. https://doi.org/https://doi.org/10.1617/s11527-017-1059-x
- Hofko, B., Porot, L., Falchetto Cannone, A., Poulikakos, L., Huber, L., Lu, X., Mollenhauer, K., & Grothe, H. (2018). FTIR spectral analysis of bituminous binders: reproducibility and impact of ageing temperature. Materials and Structures, 51(2), 45. https://doi.org/https://doi.org/10.1617/s11527-018-1170-7
- Hospodka, M., Hofko, B., & Blab, R. (2018). Impact of distillation temperature on the solvent residue and viscoelastic properties of asphalt binders. Road Materials and Pavement Design, 19(6), 1275–1287. https://doi.org/https://doi.org/10.1080/14680629.2017.1304234
- Jing, R. (2019). Ph. D. Study, ageing of bituminous materials – experimental and numerical characterization-2019. Delft.
- King, N. G., Anderson, R. M., Hanson, D. I., & Blankenship, P. B. (2012). Using black space diagrams to predict age-induced cracking, 7th RILEM International Conference on Cracking in Pavements doi.org/https://doi.org/10.1007/978-94-007-4566-7_44 Scarpas A, Kringos N., Al-Quadi I., & Loizos A. (Eds.), Mechanisms, modelling, testing, detection, prevention and case histories. Rilem Bookseries (Vol 4., pp. 453–463). Springer .
- Lesueur, D., Elwardany, M. D., Jean-Pascal Planche, J.-P., Christensen, D., & King, G. N. (2021). Impact of the asphalt binder rheological behavior on the value of the ΔTc parameter. Construction and Building Materials, 293 . https://doi.org/https://doi.org/10.1016/j.conbuildmat.2021.123464.
- Li, X., Gibson, N., Andriescu, A., & Arnold, T. S. (2017). Performance evaluation of REOB-modified asphalt binders and mixtures. Road Materials and Pavement Design, 18(sup1), 128–153. https://doi.org/https://doi.org/10.1080/14680629.2016.1266754
- Li, X., Zofka, A., Marasteanu, M., & Clyne, T. R. (2006). Evaluation of field aging effects on asphalt binder properties. Road Materials and Pavement Design, 7(1), 57–73. https://doi.org/https://doi.org/10.1080/14680629.2006.9690058
- Liu, G., Nielsen, E., Komacka, J., Leegwater, G., & van de Ven, M. (2014). Rheological and chemical evaluation on the ageing properties of SBS polymer modified bitumen: From the laboratory to the field. Construction and Building Materials, 51, 244–248. https://doi.org/https://doi.org/10.1016/j.conbuildmat.2013.10.043
- Lopes, M., Zhao, D., Chailleux, E., Kane, M., Gabet, T., Petiteau, C., & Soares, J. (2014). Characterisation of ageing processes on the asphalt mixture surface. Road Materials and Pavement Design, 15(3), 477–487. https://doi.org/https://doi.org/10.1080/14680629.2014.922656
- Lu, X., & Isacsson, U. (1998). Chemical and rheological evaluation of ageing properties of SBS polymer modified bitumens. Fuel, 77(9-10), 961–972. https://doi.org/https://doi.org/10.1016/S0016-2361(97)00283-4
- Lu, X., Redelius, P., Soenen, H., & Thau, M. (2011). Material characteristics of long lasting asphalt pavements. Road Materials and Pavement Design, 12(3), 567–585. https://doi.org/https://doi.org/10.1080/14680629.2011.9695261
- Masson, J.-F., Pelletier, L., & Collins, P. (2001). Rapid FTIR method for quantification of styrene-butadiene type copolymers in bitumen. Journal of Applied Polymer Science, 79(6), 1034–1041. https://doi.org/https://doi.org/10.1002/1097-4628(20010207)79:6<1034::AID-APP60>3.0.CO;2-4
- Mirwald, J., Hofko, B., & Grothe, H. (2021). Utilising fluorescence spectroscopy and optical microscopy to investigate bitumen long-term ageing. Road Materials and Pavement Design, 22(sup1), S23–S36. https://doi.org/https://doi.org/10.1080/14680629.2020.1856170
- Mirwald, J., Maschauer, D., Hofko, B., & Grothe, H. (2020). Impact of reactive oxygen species on bitumen aging – the viennese binder aging method. Construction and Building Materials, 257, 119495. https://doi.org/https://doi.org/10.1016/j.conbuildmat.2020.119495
- Munteanua, S. B., & Vasile, C. (2005). Spectral and thermal characterization of styrene-butadiene copolymers with different architectures. Journal of Optoelectronics and Advanced Materials, 7(6), 3135–3148.
- Nösler, I., Tanghe, T., & Soenen, H. (2008, May 21–23). Evaluation of binder recovery methods and the influence on the properties of polymer modified bitumen. Eurasphalt & Eurobitume Congress, Copenhagen.
- Petersen, J. C., & Glaser, R. (2011). Asphalt oxidation mechanisms and the role of oxidation products on Age hardening revisited. Road Materials and Pavement Design, 12(4), 795–819. https://doi.org/https://doi.org/10.1080/14680629.2011.9713895
- Planche, J.-P., Elwardany, M., Christensen, D., King, G., & Rodezno, C. (2018). NCHRP 09-60: Addressing impacts of changes in asphalt binder formulation and manufacture on pavement performance through changes in asphalt binder specifications. https://www.asphaltpavement.org/uploads/documents/Engineering_ETGs/Binder_201805/10_Planche_NCHRP09-60update.pdf
- Ray, J. E., Oliver, K. M., & Wainwright, J. C. (1981). The application of the Iatroscan TLC technique to the analysis of fossil fuels, Petroanalysis, no. Proc., Inst. Pet. (London) Symp. Petroanalysis, London, pp. 361–388.
- Reinke, G., Hanz, A., Anderson, R. M., Ryan, M., Engber, S., & Herlitzka, D. (2016, June 1–3). Impact of re-refined engine oil bottoms on binder properties and mix performance on two pavements in Minnesota. Eurasphalt & Eurobitume Congress, Prague. https://doi.org/https://doi.org/10.14311/EE.2016.284
- Rowe, G. M. (2011). Prepared discussion following the anderson AAPT paper ref. 4. AAPT, 14(80), 649–662.
- Rowe, G. M. (2017, May 1–4). New methods for assessing rheological data such as (Tc and G-R parameter and their relation to performance of REOB in asphalt binders and other materials. Presented at Asphalt Mix and Binder ETG meeting, Ames, Iowa.
- Rowe, G. M. (2019, October 13–16). The development of the Delta Tc and Glover-Rowe parameters for the control of non-load associated cracking, proc. 12th Conference on Asphalt Pavements for Southern Africa (CAPSA 19), Sun City (South Africa).
- Rowe, G. M., & Sharrock, M. J. (2016, June 1–3). Cracking of asphalt pavements and the development of specifications with rheological measurements. Eurasphalt & Eurobitume Congress, Prague. https://doi.org/https://doi.org/10.14311/EE.2016.215
- Saal, R. N. J., & Labout, J. W. A. (1958). Rheological properties of asphalts, rheology. Academic Press Inc. 363–400.
- Simnofske, D., & Mollenhauer, K. (2019). Precision of iatroscan method for assessment of SARA compounds in bitumen. In L. Poulikakos, A. Cannone Falchetto, M. Wistuba, B. Hofko, L. Porot, & H. Di Benedetto (Eds.), RILEM 252-CMB 2018. RILEM Bookseries (Vol. 20, pp. 162–167). Springer.
- Soenen, H., Carbonneau, X., Lu, X., Robertus, C., & Tapin, B. (Eds.). (2022). Evaluation of the Properties of Bituminous Binders Recovered from Various Sites in Europe. In H. Di Benedetto, B. Hassan, E. Chailleux, G. Tebaldi, C. Sauzéat, & S. Mangiafico, Proceedings of the RILEM International Symposium on Bituminous Materials, RILEM Bookseries 27, (Vol. 27, pp. 841–847).
- Soenen, H., Heyrman, S., Lu, X., & Redelius, P. (2012, May 23–25). Aging of bituminous films under ambient conditions compared to accelerated aging in the pressure aging vessel. ISAP 2012 International Symposium on Heavy Duty Asphalt Pavements and Bridge Deck Pavements, Nanjing, China.
- Soenen, H., Lu, X., Robertus, C., Carbonneau, X., & Durand, G. (2021, June 15–17). Durability parameters evaluated on binders recovered from various field sites in Europe. Eurasphalt & Eurobitume Congress, Online.
- van Lent, D. Q., Mookhoek, S. D., van Vliet, D., Giezen, C., & Leegwater, G. A. (2016, June 1–3). Comparing field aging to artificial laboratorial aging of bituminous binders for porous asphalt concrete using black space graph analysis. Eurasphalt & Eurobitumen Congress, Prague.
- Verhasselt, A. (2003, April 14–16). Short- and long term ageing of bituminous binders – simulation with the RCAT method. 6th RILEM Symposium PTEBM’03, Zürich.