
 ?Mathematical formulae have been encoded as MathML and are displayed in this HTML version using MathJax in order to improve their display. Uncheck the box to turn MathJax off. This feature requires Javascript. Click on a formula to zoom.
ABSTRACT
An existing permanent deformation (PD) model for the unbound granular materials (UGMs) in pavements, developed based on multistage (MS) repeated load triaxial (RLT) tests, was modified to better suit to field conditions and software applications. The model was calibrated for a few UGMs with a series of moisture contents (w) using MS (to include the stress-history effect) RLT tests and was validated by predicting the PD under different sets of stress levels and w’s. Generally, it exhibited improved predictions over the Mechanistic-Empirical Pavement Design Guide (MEPDG) model. The model was further applied for field conditions and was implemented in a pavement design software entitled ERAPave PP, using data from accelerated testing of three structures employing a heavy vehicle simulator (HVS). Based on additional MS RLT tests, a guideline for the ranges of the material parameters for different types of UGMs was presented.
Introduction
Unbound granular materials (UGMs) are commonly used in the base and subbase layers of pavements. Gradual accumulation of permanent deformation (PD) in the UGM layers may lead to rutting and eventual failure of the structure (Brito et al., Citation2009; Cerni et al., Citation2012; Hornych & El Abd, Citation2004; Puppala et al., Citation1999). For pavement design, it is essential to accurately predict the PD of the different layers to control rutting within limits by adjusting the layer thicknesses and selection of materials in the different layers (Alnedawi et al., Citation2019; Hornych et al., Citation2007; Perez-Gonzalez et al., Citation2021; Qiao et al., Citation2014). Effective prediction of the PD behaviour is also essential for pavement manage systems (PMS) and life cycle cost (LCC) analysis of pavements (Di Graziano et al., Citation2020). The mechanistic-empirical (ME) approach of pavement design relies on constitutive models for this purpose (ARA, Citation2004; Chen et al., Citation2010; Lekarp, Citation1999; Puppala et al., Citation1999; Ramos et al., Citation2020; Tutumluer, Citation1995).
The PD in UGMs is a function of the number of load cycles and magnitude of stresses and is influenced by the stress history and material properties such as moisture content (w), particle size distribution (PSD), particle strength, degree of compaction (DOC), and so on (Brown & Hyde, Citation1975; Lekarp, Citation1999; Ramos et al., Citation2020). For a specific material, the constitutive models should be able to reliably predict the PD behaviour considering the major field variables such as expected traffic load and environmental conditions. The magnitude of the induced stresses in the UGMs may have a large range due to varying traffic load and lateral wander of traffic as well as due to the location of the material in the structure and the properties of the other layers (Fladvad & Erlingsson, Citation2021a). There is also the effect of stress history in the material because of the random and repeated application of loading which has a significant influence on the behaviour. Thus, the model should be able to capture the behaviour of the materials for the expected range of stresses including the effect of stress history. Furthermore, since the material properties of UGMs varies from season to season due to changes in w, the model needs to consider this variability in the calculations (Erlingsson et al., Citation2017). This is relatively difficult to achieve because of the complex and nonlinear behaviour of the materials (Gidel et al., Citation2001; Hornych & El Abd, Citation2004; Uzan, Citation2004).
Several models have been developed to capture the general PD behaviour of UGMs including parameters to take into account the above-mentioned factors (Chen et al., Citation2010; Gidel et al., Citation2001; Hornych et al., Citation2007; Korkiala-Tanttu, Citation2005; Lekarp, Citation1999; Ramos et al., Citation2020). In a study by Rahman and Erlingsson (Citation2014), the models proposed by Gidel et al. (Citation2001) and Korkiala-Tanttu (Citation2005) showed satisfactory performance in multi-stage (MS) repeated-load triaxial (RLT) tests where the effect of stress history was considered in contrast with single-stage (SS) tests. However, these models relate the amount of permanent strain to the shear strength properties of the material. The shear strength parameters are determined using static failure triaxial (SFT) tests. At least three SFT tests are required for each UGM to reliably obtain these parameters. Then the RLT test is used to evaluate the rest of the parameters of the models. Thus, the application of these models can be quite time consuming and expensive. Moreover, several researchers have criticised the idea of predicting the behaviour of UGMs in cyclic loading based on SFT tests, arguing that the behaviour of UGMs is very complex and the structural response of the materials may not be the same in these two kinds of tests (Lekarp, Citation1999). Some other models (Alnedawi et al., Citation2019; Gu et al., Citation2016; Hornych et al., Citation2007; Perez-Gonzalez et al., Citation2021; Ramos et al., Citation2020; Werkmeister, Citation2003) are quite complex with many fitting parameters. Furthermore, most of these models do not incorporate the effect of seasonal variation of w that has a significant effect on the PD behaviour. Application of these models becomes a tedious process if the influence of w needs to be investigated. From the user perspective, specifically for field applications and application in pavement analysis and design tools, it is convenient to use a simple model with a relatively small number of stable material parameters that can predict the PD behaviour of UGMs with reasonable accuracy (Alnedawi, et al., Citation2019; Ramos et al., Citation2020).
Considering all these factors, Rahman and Erlingsson (Citation2015) proposed a simpler model that relates the accumulation of PD in UGMs with the repeated application of stresses of varying magnitudes. This model can be calibrated for a specific material using a single RLT test and showed reliable performance. However, for field conditions and for application in a pavement design software, it is more convenient to use a model that relates the PD to the resilient strain instead of stress levels directly. In this regard, the Mechanistic-Empirical Pavement Design Guide (MEPDG) model, proposed by Tseng and Lytton (Citation1989) has certain advantages (ARA, Citation2004). However, this model showed some limitations in performance when used for MS RLT tests of UGMs (Rahman & Erlingsson, Citation2014) as well as in accelerated pavement tests (Fladvad & Erlingsson, Citation2021b).
Objectives and methodology
The objective of this study was to derive a model for predicting the PD of UGMs that is more suitable for field application and convenient for implementation in a pavement design software. The requirements were that: (a) the model should be simple and user friendly, (b) contain the minimum number of fitting parameters possible, (c) the values of the parameters should have a reasonable and stable range with respect to variation in material properties, and (d) should be reasonably accurate and reliable.
The study was based on MS RLT tests where it is possible to analyse the PD behaviour of UGMs for a wide range of stress conditions including the effect of stress history. The presented model is a derivative of the model proposed by Rahman and Erlingsson (Citation2015), modified to incorporate resilient strains instead of stress levels to predict the PD. With this modification, the model was conveniently applied and validated for field conditions and was implemented in a layered elastic theory-based software, ERAPave PP (Ahmed, Citation2014; Ahmed & Erlingsson, Citation2021).
Permanent deformation properties of UGMs
UGMs are inhomogeneous and anisotropic in nature. The mechanical resistance of UGMs derives mainly from particle interlocking and friction between the particles (Kolisoja, Citation1997; Lekarp, Citation1999; Ramos et al., Citation2020). UGMs in pavements are subjected to cyclic stresses of varying magnitudes from the moving traffic load. These stress pulses contain vertical, horizontal and shear components. For UGMs, the vertical and horizontal stresses can only be compressive. Because of the moving wheel load, a rotation of the principal stress axes also occurs (Lekarp, Citation1999). The total deformation due to compressive cyclic stresses in a UGM consists of two parts: (a) elastic or recoverable or resilient deformation (RD) and (b) irreversible or plastic or permanent deformation (PD). Although small compared to the RD, the PD accumulates in the material for each load cycle and may end up as a significantly large value and cause failure of the pavement (Erlingsson & Magnusdottir, Citation2002; Lekarp, Citation1999; Ramos et al., Citation2020).
The PD in the UGM is caused by compaction, crushing and material migration (Lekarp, Citation1999; Tholen, Citation1980). This develops in three phases. In the initial phase, it increases rapidly with load applications. This is the post-compaction phase which is accompanied by densification of the material, reduction in pore volume and volumetric change of the material (El-Basyouny et al., Citation2005; Werkmeister et al., Citation2004). The second phase is dominated by volume change where the deformation rate becomes almost constant and shear deformation rises at an increasing rate (Werkmeister et al., Citation2004). At failure, only shear strain occurs without any volumetric change (El-Basyouny et al., Citation2005).
For a specific UGM, the accumulation of PD is dependent on the number of load cycles and the magnitude of the stresses (Gidel et al., Citation2001; Lekarp, Citation1999). The PD is found to be directly related to deviator stress and inversely related to confining pressure. Several researchers have linked the amount of PD to some form of stress ratio consisting of both deviator stress and confining pressure. It has also been reported that reorientation of the principal stresses in pavement structures results in increased PD (Lekarp, Citation1999). The PD is also dependent on the stress history of the material. It was found that PD resulting from a certain stress level may be significantly reduced if the UGM had been subjected to another stress cycle previously (Brown & Hyde, Citation1975).
The other factors governing the PD in UGMs are material properties such as PSD, DOC, particle shape, particle strength and type, w, and so on. Among these factors, w is a seasonal variable while the others are more material specific and may not vary so much with time. The PD is generally reported to increase with increasing w, where materials with higher fines content are more affected (Erlingsson, Citation2010; Lekarp, Citation1999; Rahman & Erlingsson, Citation2013; Soliman & Shalaby, Citation2015). This has been attributed to the lubricating effect of moisture and when close to saturation due to the decrease in the effective stress by the development of pore water pressure (Lekarp, Citation1999; Thom & Brown, Citation1987).
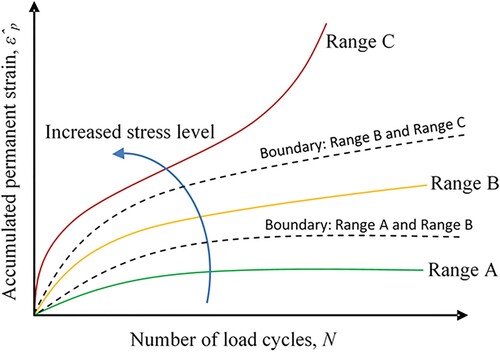
The evolution of PD in UGMs with load applications is dependent on the stress level that can be classified into three ranges based on the shakedown theory (Dawson & Wellner, Citation1999; Werkmeister et al., Citation2001; Werkmeister et al., Citation2005). In the order of ascending stress levels, the three shakedown ranges (SDRs) are defined as:
Range A – plastic shakedown range: after a finite number of load applications, the post-compaction is completed, and the material stabilises with no further permanent strain. Then the response becomes entirely resilient.
Range B – intermediate response (plastic creep): the permanent strain rate (per cycle) decreases from high to a low and nearly constant level during the first load cycles. Then the permanent strains continue to accumulate at a very slow rate.
Range C – incremental collapse: the permanent strain rate decreases very slowly compared to range A or B or not at all, or even accelerates. Accumulation of permanent strain continues with load applications, leading to failure.
A typical example of the three SDR behaviours of UGMs is shown in Figure . In a pavement structure, range A behaviour can be permitted, range B behaviour may be permitted for a limited number of load cycles, and range C behaviour should not appear at all (Werkmeister et al., Citation2001).
Figure 1. Typical PD behaviour of UGMs in different SDR classes, depending on the stress level.
The following criteria may be used to identify the SDR of a PD curve obtained from an RLT test (CEN, Citation2004a; Werkmeister, Citation2003):
(1)
(1)
where and
are accumulated permanent strains at 3000th and 5000th load cycles, respectively, in an RLT test.
One of the most cited PD models is the one from the Mechanistic-Empirical Pavement Design Guide (MEPDG) (ARA, Citation2004), originally proposed by Tseng and Lytton (Citation1989). This model implicitly considers the influence of the stress level, assuming a direct relationship between the resilient strain (ϵr) and applied stresses and combines the influence of the number of load cycles (N). This model is expressed as:
(2)
(2) where
, ρ and β are material parameters and ϵr = ϵr (N) is the resilient strain at Nth load cycle. The parameter β is estimated using the w (%) as:
(3)
(3) It should be noted that all the w’s reported in this article are gravimetric w’s (% by weight).
Experimental procedure
The model proposed in this article is based on RLT tests in the laboratory. The widely used RLT test is generally regarded as the most appropriate and convenient method to study the mechanical properties of UGMs (Jing et al., Citation2018; Lekarp, Citation1999; Uthus, Citation2007). In an RLT test, cyclic stresses corresponding to those observed in real pavements are applied on a prepared cylindrical specimen and the associated deformations are registered. By analysing the data, the stiffness and the PD properties of the material are evaluated (Rahman, Citation2015).
Most of the models available in the literature were developed based on single-stage (SS) RLT tests (Ramos et al., Citation2020). The SS RLT test refers to the approach where a single test specimen is used to study the effect of a single stress path. For analysing the effect of several stress paths, the test is repeated with a new specimen for each stress path. Thus, this approach becomes labour intensive and time-consuming even though it avoids the effect of stress history on the specimens. On the other hand, the MS RLT test applies several stress paths to the same specimen. For this reason, time and effort required for the testing are significantly reduced, enabling the application of a large range of stress paths in a relatively short time. Although the analysis of the data becomes more complex because of the effect of the stress history, it is still overweighed by the effort required for SS RLT tests. Indeed, the inclusion of the stress history effect in the MS RLT test is more realistic and the variability in tests is reduced since the same specimen is used for all the stress paths. Moreover, the fitted material parameters cover a large range of applied stresses. Considering these benefits, the MS RLT test was chosen for developing the model presented here.
The model was developed by conducting MS RLT tests on different kinds of materials having different PSDs and by varying their w’s. Some of the materials were tested using two different sets of stress levels. One set of stress levels was used for fitting the model and the other set was used to validate the model by comparing the prediction obtained using the fitted model with the measured PD. Also, the influence of moisture on the model parameters was evaluated and used in the predictions.
The MS RLT test method
The MS RLT tests were performed following the European standard EN-13286-7 (CEN, Citation2004a). For the MS loading approach, this standard presents two sets of stress levels, designated as ‘high stress level’ (HSL) and ‘low stress level’ (LSL). Each set is divided into five sequences. Each of these sequences contains several stress paths with a constant confining pressure and different deviator stresses (total 28 stress paths for the HSL and 30 stress paths for the LSL), as presented in Tables and . Each stress path is applied for 10,000 cycles. For the tests carried out here, the sequences were applied consecutively.
Table 1. Stress levels for MS RLT tests, prescribed by the European Standard (HSL).
Table 2. Stress levels for MS RLT tests, prescribed by the European Standard (LSL).
Cylindrical specimens of 150 mm in diameter and 300 mm in height were used for the tests. The vibro-compression method (according to the European standard EN 13286-52) was used to prepare each specimen with a given w and dry density (ρd). The axial deformations were measured using three linear variable displacement transducers (LVDTs), placed 120° apart and anchored to the middle third of the specimen. Average readings from the LVDTs were used in the analyses. Haversine loading pulses with a frequency of 10 Hz with no rest period were applied. The tests were carried out under free drainage conditions. The confining pressure was applied using compressed air. The tests were replicated for better reliability and to account for the experimental dispersions usually encountered in RLT tests on UGMs. Here, the mean values of the measurements are reported. Further details of the test procedure can be found in Rahman (Citation2015).
Tested materials
The materials used for this study are commonly used UGMs for different types of road constructions. The PSDs and relevant properties of these materials are presented in Figure and Table , respectively.
Figure 2. PSDs of the UGMs used for this study.
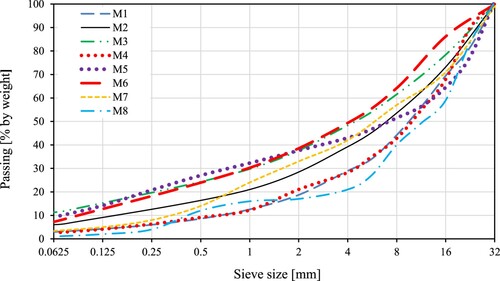
Table 3. Material properties.
A range of different PSDs was chosen to investigate the applicability of the proposed model for a relatively broad range of materials. The materials M1, M2 and M3 were crushed rock aggregates of the same origin with different PSDs. M4, M5 and M6 were also crushed rock aggregates collected from different road construction sites. M7 and M8 were natural aggregates dug out of gravel pits where the fractions of crushed material were produced by crushing the oversized particles. The maximum particle size (dmax) used for the tests was 31.5 mm. The optimum moisture contents (wopt) and the maximum dry densities (ρdmax) were determined using the modified Proctor method according to the European standard EN 13286–2 (CEN, Citation2004b). For each material, the RLT tests were performed for a series of w’s. The initial ρd ‘s of the specimens were targeted between 95% and 97% of their respective ρdmax values. The specific test conditions are summarised in Table . It should be noted that the same value of w may have a very different meaning for different UGMs and thus it does not represent much information about the moisture condition of the specimen. In this regard, the degree of saturation (S), which represents the amount of moisture in a specimen in relation to the amount required for full saturation, is a better indicator (Erlingsson et al., Citation2017). Hence, for better comprehensibility of the moisture situation, S was calculated and later used in the modelling. Furthermore, the void ratio (e) is given in Table .
Table 4. Test conditions.
Proposed model
In a previous study, based on the MS RLT tests, the following regression-based empirical model for the PD behaviour of UGMs was proposed by the authors (Rahman and Erlingsson Citation2015):
(4)
(4) where
is the accumulated permanent strain after
number of load cycles and a and b are regression parameters related to the material. The term Sf describes the effect of the stress condition on the development of PD, which is expressed as:
(5)
(5) where q is the deviator stress, p is the hydrostatic stress (one-third of the sum of the principal stresses), and α is a parameter determined using regression analysis. The term pa = 100 kPa (reference stress taken equal to the atmospheric pressure) was used to make the expression non-dimensional.
For a series of MS RLT tests with different UGMs with different w’s and DOCs, the model showed reliable and satisfactory performance (Rahman and Erlingsson Citation2015). However, for application of the model for field conditions using a layered elastic theory-based pavement analysis software ERAPave PP (Ahmed & Erlingsson, Citation2021), it may become problematic if any of the calculated lateral stresses turns out to be negative (Tutumluer & Thompson, Citation1997). For these kinds of applications, it is more convenient and appropriate to use an ϵr-based model since the calculated vertical ϵr is never negative. Thus, Equation (Equation4(4)
(4) ) was modified by simply replacing Sf with ϵr as follows:
(6)
(6) Note that the resilient strain ϵr is related to the state of stress or p/q ratio and therefore Equation (Equation6
(6)
(6) ) can be seen as the same model as presented in Equation (Equation4
(4)
(4) ) but with different material parameters a and b.
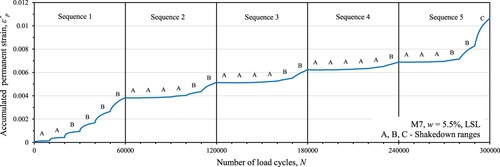
For the MS RLT tests conducted in this study, the simple power law equation is given by Sweere (Citation1990) worked better compared to some other functions, such as the hyperbolic equation. The amount of permanent strain was related to ϵr by multiplying it with the material parameter a. The ϵr was again incorporated as the exponent of N with parameter b to better simulate the different SDR slopes of the PD curve, shown in Figure . To justify the inclusion of ϵr as the exponent, an example of the various SDRs that may occur during an MS RLT test is shown in Figure . These SDRs were evaluated using the criteria given in Equation (Equation1(1)
(1) ). From this, it is obvious that the model must be able to represent all these SDRs reliably. SDR A occurs when the stress level is relatively low, so the value of ϵr would be low and thus for the model, the exponent of N will be low as well. As a result, the slope of the PD curve will be minimal corresponding to SDR A. With increased loading, ϵr will increase, leading to increased value of the exponent of the model. This will make the slope of the PD curve steeper corresponding to SDR B and SDR C. In this way, the model is suitable for a broad range of stress levels in MS RLT tests where all the SDRs are expected to occur in a single test. The number of material parameters in this model was two, which can be evaluated using a single RLT test. The values of these parameters are likely to be dependent on material characteristics such as PSD, DOC, w, mineral and surface characteristics, and so on. Based on observations of the data presented in the following sections, it may be noted that the parameter b is probably dependent mostly on the initial DOC. For the relatively narrow range of DOC used in this study, a common value of b provided good results. Parameter b tends to be lower for the lower DOC. The parameter a is highly dependent on w and DOC, among other factors. Moreover, parameters a and b showed a reciprocal relationship, meaning that if the b value tends to be lower, the a value tends to be higher.
Figure 3. Accumulation of permanent strain with the number of load cycles for M7 with w = 5.5% during MS RLT test with LSL.
The model presented in Equation (Equation6(6)
(6) ) is for one stress path only. To use this model for MS RLT test conditions where several stress paths are consecutively applied to a single specimen (thus the effect of stress history becomes important), the time hardening approach (Erlingsson & Rahman, Citation2013) was adopted. According to this method, Equation (Equation6
(6)
(6) ) can be reconstructed for MS RLT tests as:
(7)
(7) where
(8)
(8) where the suffix i refers to the ith stress path,
is the accumulated permanent strain at the end of (i–1)th stress path.
Validation of the model
The model proposed in section ‘Proposed model’ was validated in three steps. First, it was tested to fit the data from the MS RLT tests conducted. In the second step, the fitted model was used to predict the accumulation of PD in the MS RLT tests. Finally, the model was used to capture the PD behaviour of UGMs in a pavement structure. Details of the procedures are given in the following sub-sections.
Model fitting
The model, as presented in Equation (Equation7(7)
(7) ), was fitted to the data from the MS RLT tests of the UGMs for a range of w’s using the least square curve fitting method. The initial values of the parameters were estimated based on boundary conditions and engineering judgement. For the parameter a, the initial value was set equal to the accumulated permanent strain times 1000 at the end of the first stress path and was restricted to be positive. The value of the parameter b was restricted between 100 and 500. The model with the initial parameters was then used to estimate the accumulated permanent strain and the square of error (the difference between the measured and the modelled value) for each data point was calculated. The sum of the errors squared was then minimised by optimizing the parameters. For each stress path, data were collected in accordance with the European standard. For the optimization, accumulated PD after the following cycle numbers were used: 10, 20, 50, 100, 200, 400, 1000, 2500, 5000, 7500 and 10,000. The quality of fit was evaluated by the coefficient of determination R2. Also, the correct matching of the SDR between the modelled and the measured data for each stress path was evaluated and expressed as a percentage. For most of the cases, a value of b close to 250 provided reasonably good fit. Thus, to avoid complications due to multiple possible combinations of parametric values, b was fixed to 250. Using this approach, reasonable qualities of fits were achieved by only optimising the parameter a. An example of the model fitting to the MS RLT test data as well as the SDRs of the different stress paths as calculated based on the fitted model versus the test data is shown in Figure . Figure shows the plots of the measured versus modelled accumulated permanent strain as a function N for some of the materials for different w’s. The values of the parameters and the estimates of R2 and SDR matching are presented in Table . The plots in Figure show that the model fitted reasonably well with satisfactory values of R2 (mostly > 0.85) and SDR matching (mostly > 85%). The missing data for some of the tests are because of termination of the tests due to excessive deformations.
Figure 4. Typical model fitting and SDR matching.
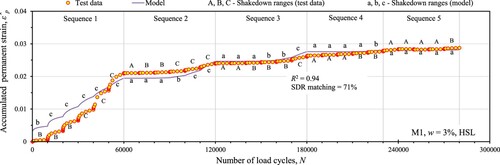
Figure 5. Measured and modelled accumulation of permanent strains for different w’s.
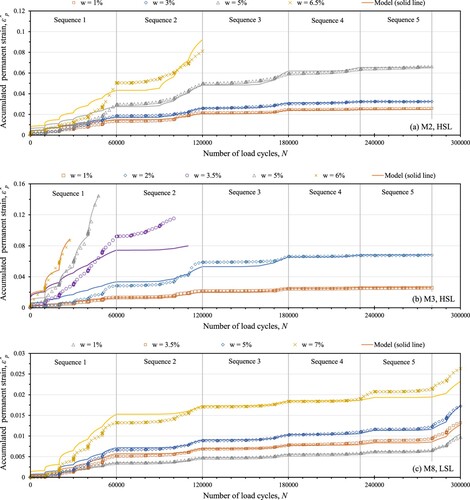
Table 5. Calibrated material parameters of the model.
The values of a for the different specimens were plotted against S in Figure , showing that a can be expressed as a linear function of S (within the range used in this study) as follows:
(9)
(9) where c1 and c2 are the regression parameters specific to each specimen and S is expressed as a percentage. The values of these parameters for the different materials and the corresponding R2 values are given in Table .
Figure 6. Parameter a as a function of w for the different materials.
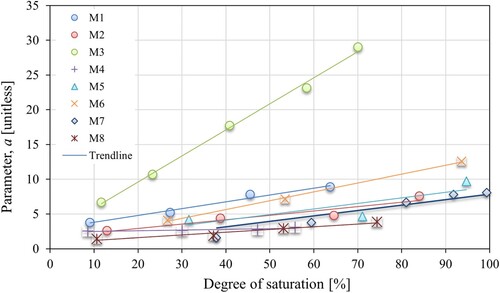
Table 6. Parameters of Equation (Equation9(9)
(9) ).
Among M1, M2 and M3, it was observed that for M3 with finer PSD moisture had the strongest impact. This is represented by a steeper slope (higher value of c1) of the a versus w line in Figure . Also, the UGMs with the lower amounts of fines (M1, M4 and M8), tended to show lower values of c1, indicating less sensitivity to moisture. Generally, it is hard to compare the impact of moisture (thus c1 values) among the different UGMs because of the differences in aggregate types and different dry densities used for the tests. Different packing arrangements of the particles in the different materials may also have had some impact (Yideti et al., Citation2012, Citation2013). The distribution of c2 values here is quite random, which may be attributed to the same reasons as well. However, this needs further investigation.
Predicting PD using the fitted models
For validation, the fitted models for the different UGMs in section ‘Model fitting’ were used to predict the accumulation of PD in different combinations of stress levels other than those used for the fittings. Thus, if HSL was used for the fitting, LSL was used for the validation and vice versa. The predicted PD were then compared to the actual measurements from the MS RLT tests. The quality of predictions was evaluated using the R2 values and SDR matching. For comparison, the MEPDG model was used in the same manner. Additionally, the parameter a was calculated for the specific w’s using Equation Equation9(9)
(9) and Table and used in the model during validation, which is represented here as ‘proposed model (moisture based)’. Some examples of the test data and the predictions by the models are shown in Figure . The R2 values and SDR matching for the models are presented in Table . These indicate that all three models worked reasonably well for predicting the PD of these UGMs in MS RLT tests. However, the proposed model showed better agreement with the measurements, especially during the last two stress paths (sequence 5) for all cases. The moisture-based version of the model also worked well. Thus, using this approach, the model may be used reliably to predict the PD behaviour of UGMs for a range of stress levels and w’s.
Figure 7. Measured versus predicted accumulation of permanent strain using the fitted models.
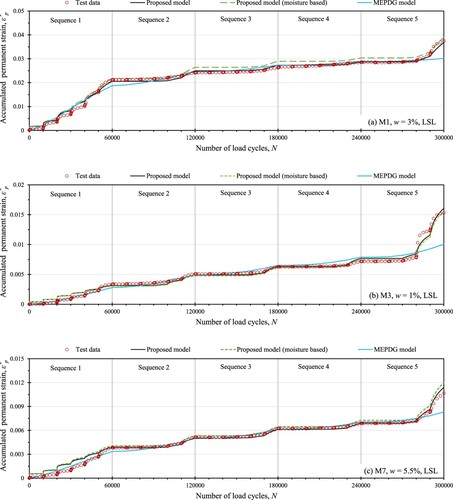
Table 7. Statistical evaluation of the quality of prediction by the models.
Field application
In addition to the RLT test environment, the model was employed to capture the PD behaviour of UGMs in a real pavement structure. For this, data from an accelerated pavement testing (APT) of an instrumented pavement test section were used. The APT was conducted in a controlled environment using a heavy vehicle simulator (HVS). The schematic of the test section and instrumentations is shown in Figure (a). During the test, the groundwater table (GWT) was raised after 486,750 load cycles, which is shown in this figure. Details of the structure and the test can be found in Saevarsdottir and Erlingsson (Citation2014). The required ϵr values as inputs for calibrating the model and the actual accumulated PD of the different layers were obtained from the readings of the instrumentations. The parameters of the model were adjusted to match the measured data with the predictions. In this case, the values of the parameter a close to those for the RLT tests worked well. Like the RLT tests, the values of the parameter b as 250 worked here too except for the base layer where a value of 60 provided the best fit (possible reasons are lower DOC or lower confining pressure due to closer position to the surface). The values of a were different for the moist and wet conditions (i.e. before and after raising the GWT, respectively) for the base and subgrade. The measured and modelled accumulated PD of the different layers of the test structure are shown in Figure (b). The values of the model parameters are presented in Table . Generally, good agreements between the measured and modelled responses were observed. The ranges of the model parameters were stable as well indicating reliability of the model. It should be noted that since the RLT test environment is not totally identical to field conditions, the parameters obtained using RLT tests may need to be adjusted for field applications. Further implementation of this model for field conditions can be found in Fladvad and Erlingsson (Citation2021b).
Figure 8. (a) Schematic of the test structure (Saevarsdottir & Erlingsson, Citation2014). (b) Measured vs. modelled PD in different layers.
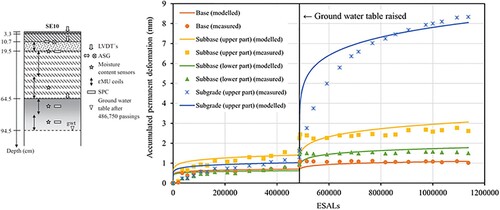
Table 8. Model parameters for the different layers of the pavement section.
Implementation of the model in ERAPave PP
The model has been implemented for the UGM layers of pavement structures in the layered elastic theory-based pavement design software ERAPave PP. To investigate the performance of ERAPave PP using this model, two heavy vehicle simulator (HVS) test structures were analysed. For this study, concrete block pavement (CBP) structures were chosen so that all layers could be treated as UGM layers, thus avoiding the use of other models and their influence on the calculations. This helped better evaluation of the proposed model. Structure 1 is a permeable type and structure 2 is a non-permeable type of CBP. The material properties and model parameters were estimated based on RLT testing, with some adjustments to match the calculated values to the measured ones. Here, the concrete blocks and the bedding layer were assumed to be acting as a system with a single elastic modulus value (estimated based on literature data and trial and error procedure). All the unbound layers were treated as linear elastic. For the HVS test conditions of these structures, variation of moisture was neglected. Details of the HVS testing and the structures can be found in Hellman (Citation2017) and Rahman et al. (Citation2020). The essential properties of the structures as well as the values of the model parameter a are presented in Table . Again, the parameter b was taken as 250. The total surface rutting predicted by ERAPave PP and the measured rutting from the HVS test are shown in Figure . In this case, the data were normalised by neglecting the post-compaction phase both for the ERAPave PP calculations and the HVS testing. Figure indicates that the predictions by ERAPave PP closely matched the HVS test results. This implies that the model can be reliably incorporated in ERAPave PP. With the proper calibration of material properties and model parameters, this model can contribute to the prediction of structural performance of pavements in the field.
Figure 9. Rut development in the two test structures: ERAPave PP predictions versus HVS test data.
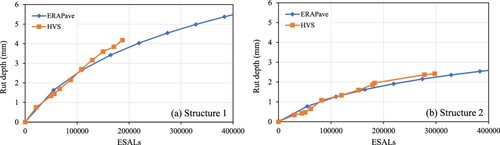
Table 9. Properties of the test structures.
Ranges of the model parameters
To study the possible range of material parameters, the model was fitted to MS RLT test data on several other UGMs in addition to those presented above. In most of the cases, a value of b = 250 worked well. In those cases, the values of a were also within the range observed in Table . However, in certain cases the value of b needed to be altered to get acceptable quality of fit. Some of these cases are presented in this section. The PSDs of these materials are presented in Figure . Here, M9 was a crushed rock aggregate. M10, M13 and M14 were blends of natural and crushed rock aggregates. M11, M12, M15 and M16 were incinerated bottom ash (IBA) materials. The tests were conducted on specimens with their respective wopt’s. The specimen densities for all the tests ranged from 95 to 97% of the maximum dry densities determined using the modified Proctor method. The LSL was used for all the tests (Table ).
Figure 10. PSDs of some additional materials tested.
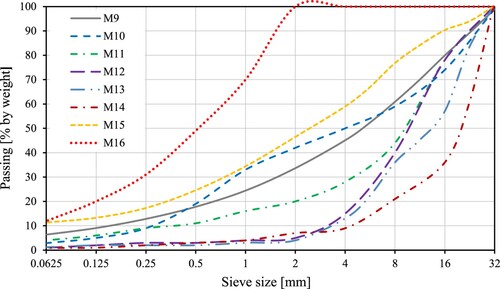
Table 10. Properties and test conditions of the additional materials.
From Tables and , it is observed that within a certain range of values of the parameters, satisfactory quality of fit (for most cases, R2 > 0.85) can be achieved with the model. The variation of the parameters appears to be more for the finer PSDs depending on the material type. It is also noted that when the value of b is higher, the value of a tend to be relatively lower (e.g. M15). Based on these observations the expected ranges of the model parameters for MS RLT test condition have been suggested in Table . Besides material type, the values will depend on the w and the DOC.
Table 11. Model parameters determined for some additional materials.
Table 12. Suggested range of model parameters for UGMs with dmax = 31.5 mm, DOC: 95–97% (modified Proctor method).
Conclusions
A model to predict the accumulation of PD in UGMs with the number of load applications and variable stress conditions was derived based on an existing model. The objective was to better suit the pre-existing model for field and software applications. The study was based on MS RLT tests since it allows for a controlled and comprehensive study of the material behaviour with minimal effort. The idea was to develop a simple and reliable model for MS loading conditions that can be calibrated with reduced effort compared to some of the existing models.
The model can be calibrated for a specific material by using a single RLT test without the requirements of SFT tests. It was validated with MS RLT test data by applying the time hardening approach. Despite its simplicity, this model showed reliable results. Some deviations in predictions compared to measured values are acceptable since experimental scatters are commonly encountered in MS RLT tests with UGMs. In this study, for simplicity, the parameter b was restricted to 250, leaving only parameter a to be regressed for different UGM specimens. Yet the model provided good quality of fit (both in terms of R2 values and SDR prediction matching). With this approach, it was possible to investigate the impact of S (or w) on parameter a. It was found that the parameter a can be considered (with reasonable accuracy) as a linear function of S (or w).
To study the range of values of the model parameters, additional data from RLT tests on different kinds of UGMs were used. It was found that the parameters were quite stable falling within a certain range. For most of the cases, b close to 250 worked well, probably because of the narrow range of DOC investigated. Outside that range, optimum b values may be different. Based on all these data, expected ranges of the parameter values were suggested.
The MS RLT test according to the European standard is a constant confining pressure (CCP) method since the confining pressure remains constant during the application of cyclic deviator stresses. In reality, the confining pressure in pavements is also cyclic or variable. However, RLT testing with variable confining pressure (VCP) is much more complicated to conduct and is not widely available. In fact, the proposed model can also be used for VCP method applying the time hardening approach. As shown in this study, the model parameters evaluated using the CCP MS RLT test can be used for predicting PD of UGMs in pavements with reasonable accuracy. For application in pavements, the initial values of the model parameters need to be estimated using RLT tests. Then those parameters may require further adjustments to fit the in-situ behaviour of the materials because of the different stress conditions. After successful calibration, the model may be further used for the same material in other structures. This is identical to introducing field calibration factor β according to the MEPDG (ARA, Citation2004). Thus, for field applications, the use of CCP or VCP method does not make much of a difference.
Since this was a limited study, the parameters of the model should be evaluated for a wider range of materials with varied w’s and DOC. With further studies, it should be possible to incorporate the influence of w, PSD and DOC into the model. The model might as well be used for subgrade materials when matric suction is properly incorporated (Cary & Zapata, Citation2011; Salour et al., Citation2016; Vanapalli et al., Citation1996). Hence, the study should be extended to more comprehensive investigations with different types of structures and a database of material parameters should be created. Further work is currently underway to extend the applicability and reliability of this model and account for the various factors involved.
Acknowledgements
Some of the materials were provided by the Danish Road Directorate.
Disclosure statement
No potential conflict of interest was reported by the author(s ).
References
- Ahmed, A. W. (2014). Mechanistic-empirical modelling of flexible pavement performance – verifications using APT measurements [Doctoral dissertation, Royal Institute of Technology]. http://urn.kb.se/resolve?urn=urn:nbn:se:kth:diva-145136
- Ahmed, A. W., & Erlingsson, S. (2021). Description of an ME program ERAPave PP (VTI Report; Unpublished draft). VTI The Swedish National Road and Transport Research Institute.
- Alnedawi, A., Nepal, K. P., & Al-Ameri, R. (2019). Permanent deformation prediction model of unbound granular materials for flexible pavement design. Transportation Infrastructure Geotechnology, 6(1), 39–55. https://doi.org/10.1007/s40515-018-00068-1
- ARA, Inc. (2004). Guide for the mechanistic empirical design of new and rehabilitated pavement structures (Final Report, NCHRP1-37A). Transportation Research Board, National Research Council.
- Brito, L. A. T., Dawson, A. R., & Kolisoja, P. J. (2009). Analytical evaluation of unbound granular layers in regard to permanent deformation. In A. Loizos, I. Al-Qadi, & T. Scarpas (Eds.), Bearing capacity of roads, railways and airfields (pp. 187–196). Taylor & Francis Group.
- Brown, S. F., & Hyde, A. F. L. (1975). Significance of cyclic confining stress in repeated-load triaxial testing of granular material (pp. 49–58; Transportation Research Record 537). Transportation Research Board of the National Academies.
- Cary, C. E., & Zapata, E. C. (2011). Resilient modulus for unsaturated unbound materials. Road Materials and Pavement Design, 12(/3), 615–638. https://doi.org/10.1080/14680629.2011.9695263
- CEN-European Committee for Standardization. (2004a). Cyclic load triaxial test for unbound mixtures. European Standard, EN 13286-7.
- CEN-European Committee for Standardization. (2004b). Test methods for the determination of the laboratory reference density and water content – proctor compaction. European Standard, EN 13286-2.
- Cerni, G., Cardoneb, F., Virgilib, A., & Camillia, S. (2012). Characterisation of permanent deformation behaviour of unbound granular materials under repeated triaxial loading. Construction and Building Materials, 28(1), 79–87. https://doi.org/10.1016/j.conbuildmat.2011.07.066
- Chen, C., Ge, L., & Zhang, J. (2010). Modeling permanent deformation of unbound granular materials under repeated loads. International Journal of Geomechanics, 10(6). https://doi.org/10.1061/(ASCE)GM.1943-5622.0000025
- Dawson, A. R., & Wellner, F. (1999). Plastic behaviour of granular materials (Final Report ARC Project 933, Reference PRG99014, April, 1999). The University of Nottingham.
- Di Graziano, A., Marchetta, V., & Cafiso, S. (2020). Structural health monitoring of asphalt pavements using smart sensor networks: A comprehensive review. Journal of Traffic and Transportation Engineering, 7(5), 639–651. https://doi.org/10.1016/j.jtte.2020.08.001
- El-Basyouny, M. M., Witczak, M., & Kaloush, K. (2005). Development of the permanent deformation models for the 2002 design guide. In Compendium of Papers of the Annual Meeting of the Transportation Research Board. Transportation Research Board of the National Academies.
- Erlingsson, S. (2010). Impact of water on the response and performance of a pavement structure in an accelerated test. Road Materials and Pavement Design, 11(4), 863–880. https://doi.org/10.1080/14680629.2010.9690310
- Erlingsson, S., & Magnusdottir, B. (2002). Dynamic triaxial testing of unbound granular base course materials. In Proceedings of the 6th International Conference on Bearing Capacity of Roads and Airfields, BCRRA ‘02 (pp. 989–1000). Transportation Research Board.
- Erlingsson, S., & Rahman, M. S. (2013). Evaluation of permanent deformation characteristics of unbound granular materials by means of multistage repeated-load triaxial tests. Transportation Research Record: Journal of the Transportation Research Board, 2369(1), 11–19. https://doi.org/10.3141/2369-02
- Erlingsson, S., Rahman, S., & Salour, F. (2017). Characteristic of unbound granular materials and subgrades based on multi stage RLT testing. Transportation Geotechnics, 13, 28–42. https://doi.org/10.1016/j.trgeo.2017.08.009
- Fladvad, M., & Erlingsson, S. (2021a). Modelling the response of large-size subbase materials tested under varying moisture conditions in a heavy vehicle simulator. Road Materials and Pavement Design. https://doi.org/10.1080/14680629.2021.1883462
- Fladvad, M., & Erlingsson, S. (2021b). Permanent deformation modelling of large size unbound pavement materials tested in a heavy vehicle simulator under different moisture conditions. Road Materials and Pavement Design. https://doi.org/10.1080/14680629.2021.1883464
- Gidel, G., Hornych, P., Chauvin, J., Breysse, D., & Denis, A. (2001). A new approach for investigating the permanent deformation behaviour of unbound granular material using the repeated load triaxial apparatus. Bulletin de Liaison des Laboratoires des Ponts et Chaussées, No. 233, 5–21.
- Gu, F., Zhang, Y., Droddy, C. V., Luo, R., & Lytton, R. L. (2016). Development of a new mechanistic empirical rutting model for unbound granular material. Journal of Materials in Civil Engineering, 28(8). https://doi.org/10.1061/(ASCE)MT.1943-5533.0001555
- Hellman, F. (2017). Accelererad provning av dränerande markstensytor med HVS-utrustning Del i Vinnova projekt, Klimatsäkrade systemlösningar för urbana ytor. Dnr 2015-00456 (In Swedish). http://klimatsakradstad.se/media/2017/11/HVS-rapport-Hellman-m-bilagor.pdf
- Hornych, P., Chazallon, C., Allou, F., & Abd, A. E. (2007). Prediction of permanent deformations of unbound granular materials in Low traffic pavements. Road Materials and Pavement Design, 8(4), 643–666. https://doi.org/10.1080/14680629.2007.9690093
- Hornych, P., & El Abd, A. (2004). Selection and evaluation of models for prediction of permanent deformations of unbound granular materials in road pavements. Competitive and Sustainable Growth (GROWTH) Programme, SAM-05-DE10.
- Jing, P., Nowamooz, H., & Chazallon, C. (2018). Permanent deformation behaviour of a granular material used in low-traffic pavements. Road Materials and Pavement Design, 19(2), 289–314. https://doi.org/10.1080/14680629.2016.1259123
- Kolisoja, P. (1997). Resilient deformation characteristics of granular materials (Doctoral thesis. Publications 223, Tampere University of Technology).
- Korkiala-Tanttu, L. (2005, June 25–27). A new material model for permanent deformations in pavements. Proceedings of the 7th International Conference on Bearing Capacity of Roads and Airfields, BCRRA ‘05, Trondheim, Norway. https://www.ntnu.no/ojs/index.php/BCRRA/article/download/3195/3079
- Lekarp, F. (1999). Resilient and permanent deformation behavior of unbound aggregates under repeated loading (Doctoral thesis, Royal Institute of Technology (KTH)). http://urn.kb.se/resolve?urn=urn:nbn:se:kth:diva-2843
- Perez-Gonzalez, E. L., Bilodeau, J. P., & Dore, G. (2021). Analysis model for permanent deformation in granular materials under the action of superheavy vehicles. Transportation Geotechnics, 28, Article 100536. https://doi.org/10.1016/j.trgeo.2021.100536
- Puppala, A. J., Mohammad, L. N., & Allen, A. (1999). Permanent deformation characterization of subgrade soils from RLT test. Journal of Materials in Civil Engineering, 11(4). https://doi.org/10.1061/(ASCE)0899-1561(1999)11:4(274)
- Qiao, Y., Dawson, A., Huvstig, A., & Korkiala-Tanttu, L. (2014). Calculating rutting of some thin flexible pavements from repeated load triaxial test data. International Journal of Pavement Engineering. https://doi.org/10.1080/10298436.2014.943127
- Rahman, M. S. (2015). Characterising the deformation behavior of unbound granular materials in pavement structures (Doctoral thesis, TRITA-TSC-PHD 15-004, KTH Royal Institute of Technology). http://urn.kb.se/resolve?urn=urn:nbn:se:kth:diva-162277
- Rahman, M. S., & Erlingsson, S. (2013). Moisture sensitivity of the deformation properties of unbound granular materials. In Proceedings of the 9th International Conference on Bearing Capacity of Roads and Airfields, BCRRA ‘13 (pp. 777–786).
- Rahman, M. S., & Sigurdur, E. (2015). A model for predicting permanent deformation of unbound granular materials. Road Materials and Pavement Design, 16(3), 653–673. https://doi.org/10.1080/14680629.2015.1026382
- Rahman, S., & Erlingsson, S. (2014). Predicting permanent deformation behaviour of unbound granular materials. International Journal of Pavement Engineering, 16(7), 587–601. https://doi.org/10.1080/10298436.2014.943209
- Rahman, S., Simonsen, E., Hellman, F., Ahmed, A., & Erlingsson, S. (2020). Structural performance evaluation of block pavements using heavy vehicle simulator. In A. Chabot, P. Hornych, J. Harvey, & L. Loria-Salazar (Eds.), Accelerated pavement testing to transport infrastructure innovation. Lecture notes in civil engineering, Vol. 96. Springer. https://doi.org/10.1007/978-3-030-55236-7_29
- Ramos, A., Gomes Correia, A., Indraratna, B., Ngo, T., Calçada, R., & Costa, P. A. (2020). Mechanistic-empirical permanent deformation models: Laboratory testing, modelling and ranking. Transportation Geotechnics, 23, Article 100326. https://doi.org/10.1016/j.trgeo.2020.100326
- Saevarsdottir, T., & Erlingsson, S. (2014). Modelling of responses and rutting profile of a flexible pavement structure in a heavy vehicle simulator test. Road Materials and Pavement Design. https://doi.org/10.1080/14680629.2014.939698
- Salour, F., Rahman, M. S., & Erlingsson, S. (2016). Characterizing permanent deformation of silty sand subgrades by using a model based on multistage repeated-load triaxial testing. Transportation Research Record Journal of the Transportation Research Board, 2578(1), 47–57. https://doi.org/10.3141/2578-06
- Soliman, H., & Shalaby, A. (2015). Permanent deformation behavior of unbound granular base materials with varying moisture and fines content. Transportation Geotechnics, 4, 1–12. https://doi.org/10.1016/j.trgeo.2015.06.001. ISSN 2214-3912.
- Sweere, G. T. H. (1990). Unbound granular bases for roads (PhD thesis, Delft University of Technology). https://repository.tudelft.nl/islandora/object/uuid%3A1cc1c86a-7a2d-4bdc-8903-c665594f11eb
- Tholen, O. (1980). Falling weight deflectometer – a device for bearing capacity measurements: Properties and performance. Degree project. Department of Highway Engineering, Royal Institute of Technology (KTH).
- Thom, N. H., & Brown, S. F. (1987). Effect of moisture on the structural performance of a crushed-limestone road base(pp. 50–56; Transport Research Record 1121). Transportation Research Board.
- Tseng, K. H., & Lytton, R. L. (1989). Prediction of permanent deformation in flexible pavement materials. In H. G. Schrauders & C. R. Marek (Eds.), Implication of aggregates in design, construction, and performance of flexible pavements, ASTM STP 1016 (pp. 154–172). American Society for Testing and Materials.
- Tutumluer, E. (1995). Predicting behavior of flexible pavements with granular bases (PhD dissertation, School of Civil and Environmental Engineering, Georgia Institute of Technology). https://smartech.gatech.edu/bitstream/handle/1853/19254/tutumluer_erol_199512_phd_413304.pdf
- Tutumluer, E., & Thompson, M. R. (1997). Anisotropic modeling of granular bases in flexible pavements. Transportation Research Record: Journal of the Transportation Research Board, 1577(1), 18–26. https://doi.org/10.3141/1577-03
- Uthus, L. (2007). Deformation properties of unbound granular aggregates (Doctoral thesis. Norwegian University of Science and Technology (NTNU)). https://ntnuopen.ntnu.no/ntnu-xmlui/handle/11250/231354
- Uzan, J. (2004). Permanent deformation in flexible pavements. Journal of Transportation Engineering, 130(1), 6–13. https://doi.org/10.1061/(ASCE)0733-947X(2004)130:1(6)
- Vanapalli, S. K., Fredlund, D. G., Pufahl, D. E., & Clifton, A. W. (1996). Model for the prediction of shear strength with respect to soil suction. Canadian Geotechnical Journal, 33(3), 379–392. https://doi.org/10.1139/t96-060
- Werkmeister, S. (2003). Permanent deformation behavior of unbound granular materials (Doctoral thesis. University of Technology). https://tud.qucosa.de/api/qucosa%3A24221/attachment/ATT-0/?L=1
- Werkmeister, S., Dawson, A. R., & Wellner, F. (2001). Permanent deformation behavior of granular materials and the shakedown concept. Transport Research Record, Journal of the Transportation Research Board (TRB), 1757(1), 75–81. https://doi.org/10.3141/1757-09
- Werkmeister, S., Dawson, A. R., & Wellner, F. (2004). Pavement design model for unbound granular materials. Journal of Transportation Engineering, 130(5), 665–674. https://doi.org/10.1061/(ASCE)0733-947X(2004)130:5(665)
- Werkmeister, S., Dawson, A. R., & Wellner, F. (2005). Permanent deformation behaviour of granular materials. Road Materials and Pavement Design, 6(1), 31–51. https://doi.org/10.1080/14680629.2005.9689998
- Yideti, T. F., Birgisson, B., & Jelagin, D. (2013). Influence of aggregate packing structure on California bearing ratio values of unbound granular materials. Road Materials and Pavement Design, 15(1), 102–113. https://doi.org/10.1080/14680629.2013.863160
- Yideti, T. F., Birgisson, B., Jelagin, D., & Guarin, A. (2012). Packing theory-based framework to evaluate permanent deformation of unbound granular materials. International Journal of Pavement Engineering, 14(3), 309–320. https://doi.org/10.1080/10298436.2012.736620