
 ?Mathematical formulae have been encoded as MathML and are displayed in this HTML version using MathJax in order to improve their display. Uncheck the box to turn MathJax off. This feature requires Javascript. Click on a formula to zoom.
Abstract
The presented study investigates the effect of a recently developed multiaxial geocomposite made of polypropylene geogrid and non-woven fabric on the delay of crack propagation, based on four-point bending tests of large asphalt concrete beams – both for reinforced and non-reinforced specimens. Several approaches are described in this study, including analysis of stiffness modulus decrease and analysis of crack propagation using dissipated energy. The study also includes investigation of the impact of reinforcement on shear resistance of the inter-layer bond. The reinforced system displays reduced decrease in stiffness during cyclic loading; it is able to bear loads over a longer period, in contrast to the unreinforced system. An increase in fatigue life by a factor of 10–22 is possible, as compared to the unreinforced system. The factor of relative increase in the number of cycles to the first initiation of crack in lower asphalt layer when reinforcement is introduced ranges from 5 to 10.
Introduction
Reinforcement of asphalt pavements with geocomposites improves bearing capacity effectively, as proved in numerous previous studies (Brown, Citation1985; Correia, Citation2014; Graziani et al., Citation2014). The benefits are notably visible when geocomposites are used in rehabilitation of old, cracked pavement sections (Canestrari et al., Citation2013; Pasquini et al., Citation2013; Zieliński, Citation2013). Although the benefits are clearly observable in the field (Al-Qadi, Citation2006; Ragni et al., Citation2020; Spadoni et al., Citation2021), the literature still lacks a detailed description (Solatiyan et al., Citation2020) of the quantified contribution of geocomposite reinforcement to an increase in bearing capacity or reduction of crack propagation in asphalt pavements. A proper design of reinforced pavement overlays is still challenging, especially due to the fact that many types of grids and geocomposite reinforcement are available on the market – they are characterised by a diversified structure and made from various materials, including polymers, steel, glass fibres and carbon fibres. In the studies of (Zofka et al., Citation2017; Zofka & Maliszewski, Citation2019) several existing approaches were compared and discussed; the authors proposed a new method, which was called a ‘rational compromise between empirical methods and mechanistic-based approaches’. Despite the fact that various methodologies for the design of reinforced pavement overlays are available, there is still a need for deeper investigation of mechanistic-based crack propagation and the bonding mechanism, due to their critical significance in overlay design. This need was pointed out by Zofka and Maliszewski (Citation2019) as well. In the presented study, laboratory tests and result analyses were performed with the aim to quantify the benefits of implementation of a recently developed multiaxial geocomposite in asphalt pavements. For this purpose, large-scale double-layered asphalt beams were tested in the four-point bending beam scheme. Two types of specimens were tested: plain and notched. On the basis of testing plain specimens fatigue characteristics were obtained. Notched specimens were used to investigate the delay of crack propagation under cyclic loads. The effect of reinforcement on bond quality was investigated as well. Such a complementary investigation of asphalt layer reinforced systems provides data, which may be useful for pavement design.
Sample preparation and materials used
Manner of sample preparation
Each specimen prepared for further laboratory testing consisted of two layers made from asphalt concrete, bonded with asphaltic emulsion applied as a tack coat. Two types of specimen systems were prepared: (1) reference system, in which two asphalt layers were used without reinforcement and (2) reinforced system, in which a multiaxial geocomposite, labelled as AX5-GN, was installed between two asphalt layers. For each system, a number of prismatic beams with the final dimensions of 170 × 100 × 850 mm were prepared. The prismatic beams were further divided into two groups: (1) plain specimens and (2) notched specimens. Prismatic beams were prepared for use in the performed fatigue tests, which are described in detail in a further part of the paper. A portion of the prismatic beams served as the source for coring out of circular specimens with a diameter of 150 mm. Cylindrical specimens were used for direct shear (Leutner) testing. The overall process of sample preparation comprised of several steps, which are presented graphically in Figure . The successive steps are as follows:
Figure 1. Sample preparation process.
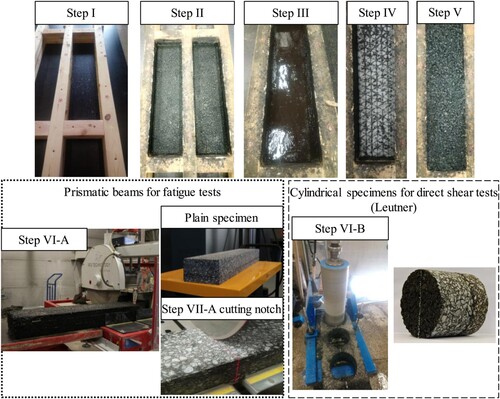
Step I – production of timber moulds with internal dimensions of 240 × 135 × 1000 mm, Step II – laying and compacting the lower AC 11W asphalt layer with the use of single drum steel roller, up to a layer height equal to 45 mm after compaction, Step III – application of tack coat of selected bitumen emulsion, Step IV – installation of geocomposite asphalt inter-layer (this step was omitted for reference samples), Step V – laying and compacting of the upper AC 16W asphalt layer with the use of single drum steel roller, up to a height of 90 mm after compaction, Step VI-A – cutting the test beams from the compacted material to the final specimen dimensions of 170 × 100 × 850 mm, so that the final AC 11W levelling course thickness of 30 mm and AC 16W binder course thickness of 70 mm was obtained. The cutting process took place 14 days after compaction. Step VII-A – cutting a 2-mm-wide and 10-mm-deep notch in the lower asphalt layer (on the bottom of the prismatic beam). Step VI-B – coring cylindrical specimens of 150 mm in diameter for inter-layer bonding tests.
Asphalt concretes
Asphalt concretes used for the lower and upper layer were designed and produced in accordance with the European standard EN 13108-1 and the Polish technical guidelines WT-2:2014, for traffic load categories KR3-4, which correspond to the range of 0.5 × 10⁶–7.3 × 10⁶ of 100-kN ESALs. The AC 11W mixture used for the lower layer represents the levelling course which is typically used in Poland when overlaying an existing deteriorated pavement in need of strengthening. The upper layer was made from the AC 16W mixture, which represents the binder course. Finer gradation of the levelling course enables filling of the existing cracks and potholes, thus providing smooth surface for the geogrid reinforcement, which is later covered by the binder course. The mineral mixture was composed of mineral limestone filler and crushed gneiss/granite aggregate. Neat bitumen classified as 35/50 according to the EN 12591 standard was used as a binder for both mixtures. The properties of the bitumen are given in Table . Composition and volumetric properties of the asphalt mixtures are presented in Table . Asphalt mixtures were prepared using a mechanical mixer. Before compaction a short-term ageing process was conducted, during which loose portions of both mixtures were kept at 135°C for 4 h. Short-term ageing of asphalt mixtures is a standard procedure in Poland which aims to obtain comparison stage of ageing for mixtures produced in laboratory conditions to those, which are produced in a plant.
Table 1. Properties of the applied bitumen.
Table 2. Composition and volumetric properties of the used asphalt mixtures.
Geocomposite with multiaxial geogrid
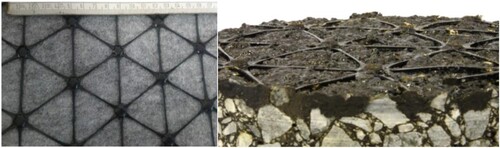
Geocomposite inter-layer AX5-GN for reinforcement of asphalt layers was produced and tested by Tensar, Blackburn, UK. The AX5-GN geocomposite contains two components: polypropylene stiff monolithic hexagonal paving grid with integral junctions is bonded to a polypropylene non-woven paving fabric. In the case of the geogrid used in the AX5-GN geocomposite, the grid is oriented in three directions. The size of hexagon pattern of the grid has a nominal value of 80 mm. In the described geocomposites, the geogrid performs the structural reinforcement function in the asphalt inter-layer. The non-woven fabric used in the geocomposite acts as a bonding layer during installation. After installation and saturation with bitumen the non-woven fabric also performs stress relief function. Another function of the non-woven fabric is that of an inter-layer moisture barrier. The fabric described in this paper has residual bitumen retention of approximately 1.5 kg/m2. Unit weight of the grid component is approximately 210 g/m2. Unit weight of the fabric component is 130 g/m2. The AX5-GN geocomposite inter-layer is shown in Figure .
Figure 2. Geocomposite asphalt inter-layer AX5-GN with multiaxial structural reinforcement geogrid and non-woven fabric, before and after installation and saturation with bitumen.
Bitumen emulsion
Bitumen emulsion was used as a tack coat for layer interfaces. At the first stage of the study the following bituminous emulsions were tested in order to select the appropriate type and quantity of emulsion for use with geocomposite reinforcement:
C60 B3 ZM – bitumen emulsion for layer interfaces, bitumen content 60%,
C60 BP3 ZM – polymer-modified bitumen emulsion for layer interfaces, bitumen content 60%,
C69 B3 PU – bitumen emulsion for surface treatments, bitumen content 69%,
C69 BP3 PU – polymer-modified bitumen emulsion for surface treatments, bitumen content 69%.
Emulsions for layer interfaces were produced from 70/100 bitumen, while emulsions for surface treatments were produced from 100/150 bitumen.
Methodology of testing and result processing
Inter-layer bonding
The direct shear test method proposed by Leutner was used to assess the inter-layer adhesion of the asphalt layers, to investigate the impact of reinforcement on the inter-layer bonding and to specify the optimum amount and type of emulsion tack coat. The test is performed in a special device on cylindrical specimens with a diameter of 150 mm. The specimens were preconditioned for 12 h at the temperature of +20°C in a drying machine with forced air circulation. The test is based on direct shearing along the assumed failure plane with a constant displacement rate of 50 mm/min, to the point of maximum shearing force and further, until complete shearing failure occurs. Reaching the maximum shearing force means that the failure is initiated, but the ultimate shearing failure of the interface does not occur immediately. Therefore, the test continues and the force gradually decreases with further displacement, until the bond between the two layers fails completely. The moment of complete shearing failure of the specimen was assumed as the point at which the value of the force decreases to 10% of the registered maximum value. During the test, the shearing force is monitored against the shearing displacement. It is important to perform direct shearing, without bending in the shear plane.
The shearing strength of the interface τmax is calculated from the maximum registered shearing force divided by the area of the cross-section. Additional bonding assessment was based on shearing failure energy Wm, given by:
(1)
(1) where Wm is the work (energy) needed to cause failure of the inter-layer bond in direct shear test (kJ/m2), τ(t) is the shearing stress as a function of time (MPa), δ(t) is the shearing displacement as a function of time (mm) and T is the time from the onset of test to failure (s).
Fatigue test
Four-point bending scheme
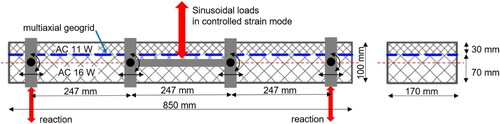
Fatigue testing was performed in the scheme of four-point bending (4PB). Dimensions of specimens and of the 4PB frame are presented in Figure . To reflect the actual working conditions of the pavement and minimise the scale effect, the specimens used in the test were significantly larger than those recommended in typical fatigue testing procedures. An assumption was made that the width of the reinforcement placed between asphalt layers must cover at least 2 rows of parallel geocomposite grid strands; therefore, the adopted sample width equalled 170 mm. As mentioned above, the specimens were prepared in a double-layer system: 30 mm of AC 11W levelling course (bottom layer) and 70 mm of AC 16W binder course (upper layer). Specimens were placed in an inverted position in the testing machine. This sample orientation was related to the manner in which the load was applied by the device. The test was performed in a climatic chamber at the constant temperature of +13°C, which is the equivalent temperature adopted in the design of flexible pavements in Poland. More details concerning the 4PB scheme used in this study are available in previous publications (Jaskula et al., Citation2022, Citation2021).
Figure 3. Scheme of four-point bending (4PB) test.
Two sets of double-layered beam specimens were used in the 4PB fatigue test: with and without a notch. Fatigue tests on specimens without notches were performed to determine fatigue curves and compare fatigue characteristics of the reinforced systems against systems without reinforcement. The notches were introduced in a certain group of specimens to initiate cracking, thus enabling monitoring of its propagation based on changes in stiffness of the tested systems and assessment of the effect of reinforcement on inhibition of crack propagation in the asphalt overlay.
Beams were exposed to cyclic loading that caused a haversine change in strain from 0 to the predetermined maximum value equal to 400, 500, 600, 700 and 800 μstrain. A single specimen was tested for each combination of parameters: presence of geocomposite reinforcement, notching and the maximum strain value. This type of fatigue test, in which the exact value of strain is applied, is described as the ‘controlled strain mode’. Bending was applied in one direction only, so that (taking into consideration the inverted position of the specimen) the reinforcement functioned in the tension zone. Loading frequency equalled 1 Hz. The justification of lower frequency of load 1 Hz instead of 10 Hz which is commonly used for 4PB test arises from accuracy of raw data. Determination of hysteresis loops of stress–strain in particular cycles was necessary to perform the experiment and it was unable to determine them at 10 Hz frequency. The lower the value of the preset strain, the greater the duration of the test. The maximum number of the applied loading cycles was 300,000 for the strain value of 400 μstrain, which resulted in a maximum testing time of 84 h per test. If the specimen failed, the test was finished before the 300,000th cycle. Test conditions were selected after deeper literature review, which is summarised in the previous work of authors (Jaskula et al., Citation2022).
Methodology of fatigue life evaluation
During the fatigue testing of asphalt mixtures in the controlled (preset) strain mode, the consecutive cycles result in a gradual decrease in the stiffness modulus (and, therefore, the stress induced in the specimen), which is indicated by the continuous decrease in the force needed to induce the adopted strain level. In the case of standard testing of asphalt mixtures, where notch is not introduced, three stages can be distinguished: (1) initial phase – characterised by a rapid drop in stiffness, (2) damage accumulation phase – characterised by a gradual, monotonic decrease in stiffness as a result of development of micro-cracks and (3) final phase of failure – characterised by visible macro-cracks leading to a rapid decrease in stiffness. When a specimen is notched the artificial macro-crack is already introduced, but it does not mean that specimen behave as plain specimen in stage 3. In other words, crack does not propagate at the first cycles but after bearing some number of cycles by specimen. The process of crack propagation is somehow comparable to phases observed for plain specimens, but with lower number of loads required to damage accumulation and to further propagation of crack from the edge of notch. In the case considered in this study, a double-layered system is tested, thus the decrease in the overall stiffness of specimen is a superposition of the decrease in stiffness modulus of the asphalt mixtures, debonding of layers and crack propagation (in the case of notched systems). In the analysis, specimens comprising a double-layer system are treated as homogenous isotropic material – which is slightly different from reality, but enables a significant simplification of the analysis. Due to this, parameters such as strain or stiffness represent substitute pseudo-values. A detailed description of the parameters considered in the analysis is given below.
Preset tensile strain [-]: maximum strain of the extreme tension fibres of the cross-section, in the case of homogenous isotropic material. In the performed fatigue tests with controlled strain mode, this value is constant for the duration of the entire test. The value of tensile strain is calculated based on vertical deflection measured at the centre of the beam by an LVDT sensor. In fact, the value of ϵt is a theoretical value, since beams are not homogenous and consist of two asphalt layers with various values of stiffness modulus. Moreover, partial slippage occurs at the interface between two layers. Therefore, the strain was defined in this study as ‘preset’, which means that it is the value set in the UTM software and actual value of tensile strain differs from the preset value.
(2)
(2) where ϵt is the peak preset tensile strain, constant value for the duration of the entire test, δ is the peak vertical deflection at the centre of the beam (mm), h is the beam height (100 mm), Sw is the support span width (740 mm) and Lw is the loading span width (247 mm).
Stiffness modulus of the double-layer system (abbreviated as stiffness) Si in any given cycle i was calculated from Equation (3):
(3)
(3) where Si is the stiffness modulus of the double-layer system in the i-th cycle of the test and σi is the maximum tensile stress in the i-th cycle calculated as for monolithic, homogenous prismatic specimen.
Initial stiffness Sini represents stiffness modulus in the 100th loading cycle. Typically, the first loading cycles in fatigue testing are intended for stabilisation of the device and sensors and avoidance of the effect of thixotropy (a rapid reduction in stiffness under loading).
Fatigue life Nf is the number of cycles required to achieve fatigue failure of the specimen. Different assumptions are used to define the moment of fatigue failure; they are discussed in the further part of the paper. The most common definition of fatigue failure is the moment at which the stiffness Si is reduced to 50% of the initial stiffness Sini. However, such approach indicates rather a theoretical failure point, which does not correspond well to real failure of specimen due to crack development. Therefore, the authors proposed a new approach to identification of the failure point and determination of fatigue life based on the graph of Si versus the number of cycles.
Fatigue curve is determined by the Nf fatigue life results obtained at various preset strain levels. The curve enables estimation of fatigue life of the system at any assumed strain level (also outside of the tested range). The general form of the equation of the curve is as follows:
(4)
(4) where A is the slope of the fatigue curve and b is the coefficient based on the obtained fatigue test results.
Critical strain at one million load cycles ϵ6 is a parameter based on the fatigue curve, equivalent to strain at which fatigue life of the system equals one million load cycles. This parameter is used to characterise asphalt mixtures in terms of their fatigue resistance. The higher value of the ϵ6 strain indicates better fatigue properties of the entire tested layered system.
Dissipated energy in the given test cycle wi is the value represents the energy (per unit of volume) spent on the formation of microfractures, the formation of plastic deformations and transformed into heat. The area within the hysteresis loop, that is the curve obtained by plotting the relative changes of stress and strain during the loading cycle, may be interpreted as the dissipated energy. In a model case, when an elliptic shape of the hysteresis loop is assumed, the dissipated energy may be calculated from the following formula:
(5)
(5) where wi is the dissipated energy in the i-th test cycle and are average amplitudes of stain, stress and phase angle, respectively, in the i-th cycle of the test.
Total dissipated energy from the start of the test to the current cycle W is expressed with:
(6)
(6) where Wi is the dissipated energy in the i-th cycle according to (5) and N is the current number of cycles. Total dissipated energy W has a non-linear course in relation to the number of cycles N. The ratio between W and actual number of cycles N was introduced by authors in this analysis and it is signed as DE. DE represents an average energy dissipated in one load cycle.
Energetic ratio was introduced first by Rowe (Citation1996) and modified and adopted in later works (Hu et al., Citation2016). According to this method, the Rσ parameter, defined by Equation (7), is calculated for every load cycle.
(7)
(7) where Rσ is the energy ratio in the i-th cycle of the test, Si is the stiffness of the system in the i-th cycle and N is the number of cycles from the beginning of the test.
Reinforcement effectiveness factor (REF) was proposed after an analogous fabric effectiveness factor introduced by Sobhan et al. (Citation2004), and it is calculated according to the following formula:
(8)
(8) where
is the number of cycles to macro-crack formation corresponding to any particular strain level.
Test results
Inter-layer bonding
Two cylindrical specimens were tested for each system, tack coat emulsion type and amount of residual bitumen after breaking and curing of the emulsion. Results are presented in Figure for both systems (reference and reinforced), along with the relative change of parameters between those systems. The charts present the average values with minimum and maximum values represented by the error bars. For the reinforced specimens, shearing failure always occurred at the interface between non-woven fabric and the lower asphalt layer and no debonding of the geocomposite was observed, which proves good internal integration of the geocomposite.
Figure 4. Results of direct shear test of reference and reinforced systems: (a) shearing strength and (b) searing failure energy.
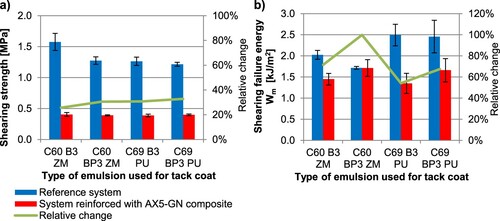
Introduction of reinforcement geocomposite with multiaxial geogrid between the two asphalt layers resulted in a reduction of inter-layer bond strength by 75%, as compared to specimens without reinforcement (see Figure (a)). While the requirements for shearing strength given in the Polish technical guidelines (Jaskula, Citation2014) specify a minimum value of 0.7 MPa for inter-layer bond between the binder course and the asphalt base, the value obtained for reinforced systems is lower and equals 0.4 MPa. It should be emphasised that shear strength of inter-layer bond in specimens with reinforcement is still higher than the maximum shear stresses (0.3 MPa) which may occur in pavement during emergency braking of heavy vehicles (Jaskula, Citation2018). The type of emulsion has a negligible impact on shearing strength of the reinforced system. Laboratory trials had indicated that in order to ensure proper inter-layer bonding and stress relief function, more tack coat is needed when applying the geocomposite. In the case of reinforced systems, quantity of emulsion equalled 1.2 kg/m2 instead of 0.2 kg/m2 used for reference non-reinforced systems. The following types and amounts of bitumen emulsion were selected for further testing: C69 B3 PU at the quantity of 1.2 kg/m2 for reinforced systems and C60 B3 ZM at the quantity of 0.2 kg/m2 for non-reinforced systems. It is also interesting that relative change in shearing failure energy (see Figure (b)) is much lower than relative change in shear strength (Figure (a)). Moreover for emulsion C60 BP3ZM no adverse effect of introducing geocomposites on shearing failure energy was observed.
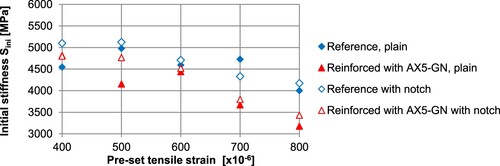
Initial stiffness modulus (Sini)
In general, introduction of reinforcement results in a slight decrease in the initial stiffness modulus Sini of the double-layer system, as visible in Figure . In most cases, systems with notch also display a slight decrease in the initial stiffness. With an increase in the preset strain, the initial stiffness decreases, indicating non-linear behaviour of double-layer systems. This observation mainly results from partial slippage between layers and in minor extend from the non-linear behaviour of asphalt mixtures. The phenomenon intensifies for greater preset strain levels.
Figure 5. Comparison of the initial stiffness modulus measured at different strain levels for double-layered asphalt systems (specimens both with and without a notch).
The decrease in stiffness of plain and notched samples
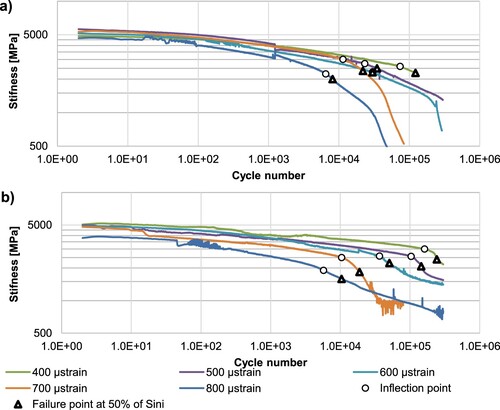
During the fatigue test, stiffness of the tested systems gradually decreases. The course of this decrease for plain specimens is shown in Figure , separately for different preset strain values: 400, 500, 600, 700 and 800 μstrain. Differences between reference and reinforced systems are clearly visible. The points at which stiffness of particular specimens decreased to 50% of the initial stiffness Sini are also presented in Figure . The changes in stiffness modulus are presented on a log–log scale, making it possible to read the results from the first phase (up to 100 cycles) and the second phase of fatigue evaluation. In the case of the reference system (Figure (a)), stiffness decrease is very close to linear on a log–log scale at the beginning of test, but its deviation from linear course increases as the number of load cycles grows. In the case of higher preset strains (600, 700 and 800), a very rapid decrease in stiffness was observed at the end of test, which indicated specimen failure due to the formation of cracks. It means that the third phase of fatigue occurred. In Figure , points at which the decrease in stiffness starts to deviate from linearity in log–log scale are marked as ‘inflection points’. It is noteworthy that the inflection points were identified before failure, but very close to the points of failure (50% of Sini). In the case of reinforced systems, the course of stiffness decrease is closer to linear on a log–log scale except for the highest level of preset strain (800 μstrain). The inflection point can also be identified more precisely. Interestingly, when inflection point is reached, stiffness decreases rapidly in several thousand cycles and then the rate of decrease in stiffness is reduced again. It means that the reinforced systems are still able to bear loads – in contrast to reference systems, which collapse during the third phase of fatigue test.
Figure 6. The change in stiffness of plain specimens: (a) reference system and (b) reinforced system.
Influence of initial cracks on the decrease in stiffness in fatigue test
During the fatigue test, stiffness of the tested notched systems gradually decreases, similarly to stiffness of plain specimens. However, failure of the system occurs faster in comparison to plain samples. Courses of this decrease are shown in Figure , separately for different preset strain values: 400, 500, 600, 700 and 800 μstrain. Since fatigue tests on cut-in (notched) systems are not generally conducted in fatigue performance assessments, the aim was rather to analyse crack propagation (reference samples) and the potential inhibition of crack propagation (reinforced samples). The samples were tested until the moment at which the crack propagated through the entire thickness of the lower asphalt layer (30 mm) and reached slightly beyond the half of the thickness of the upper layer (approx. ½ × 70 mm). Due to significant propagation of the crack, stiffness modulus of the system in the final phase of the test decreased below 1000 MPa, that is to approx. 20% of its initial value Sini.
Figure 7. The change in stiffness of the notched specimens: (a) reference system and (b) reinforced system.
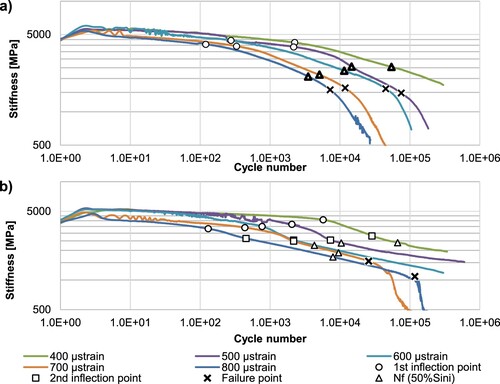
Notched specimens are comparable with plain specimens in terms of the course of change in stiffness; however, inflection points are more transparent when specimens are notched. It is noteworthy that the difference (expressed in the number of loads) between the inflection point and the Nf point at which stiffness reaches 50% is greater in the case of notched specimens. The recorded changes in stiffness and the observed beginning of macro-cracking were compared with the appearance of cracks in the samples after the testing procedure. Images of cracks are presented in Figure , which includes photographs of samples (both reference and reinforced with the AX5-GN geocomposite) after tests at the considered preset strain levels. In order to ensure visibility of the progressing cracks, their shapes were highlighted in red.
Figure 8. Photographs of notched samples after fatigue testing with highlighted cracks.
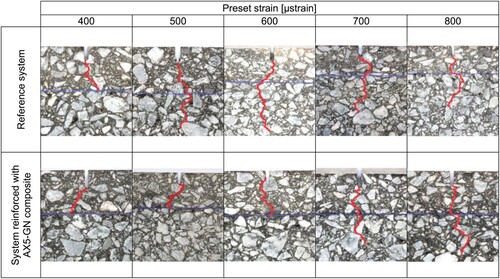
In the case of reference samples, none of the tested samples exhibited any reduction in the rate of stiffness decrease. Moreover, the shape and slope of the stiffness curves plotted for double-layered systems were similar to the shapes typically obtained for uniform one-layer asphalt beam samples. In the first phase, before reaching the inflection point, an approximately linear decrease in stiffness curves is observed. After the inflection point is reached – in the second phase – the macro-cracks start to form easily and further decrease in stiffness modulus becomes non-linear. Moreover, steepness of the curves gradually increases (see Figure ). For the samples tested at the strains of 500, 600, 700 and 800 μstrain, cracking was observed and detected along 90% of their full thickness, which implies complete failure and breakage of the beam samples. The least intensive crack propagation was observed for the beam sample tested at 400 μstrain – in this case, the crack did not extend beyond the lower layer.
In the case of systems reinforced with geocomposite with multiaxial geogrid, two or three inflection points were identified in all the stiffness curves. These points are marked in Figure . The 1st inflection point represents the number of loads above which the cracking process (initiated in the notch) propagates through the lower layer. Then crack propagation continues until the 2nd inflection point is reached. Beyond that point the process of crack development is relieved – it is observed that the geocomposite material is being activated. The bitumen-saturated fabric, which is the part of the geocomposite, starts to dissipate the stresses generated nearby the crack. Inhibition of crack propagation was observed in samples subjected to strain levels of 500 and 600 μstrain, as visible in Figure – the geocomposite prevented crack propagation from the lower asphalt layer to the upper asphalt layer for the strain level equal to 500 and 600 μstrains. The 3rd inflection point represents the ultimate failure of the specimen. It was not detected for the samples tested at preset strains from 400 to 600 μstrain, but it was observed in the samples subjected to the highest strain levels, i.e. 700 and 800 μstrain. It means that at such levels of strain the cracks propagated through the geocomposite inter-layer and then into the upper layer. The failure mechanism suggests that a local loss of inter-layer bonding at the asphalt–geocomposite–asphalt interface might have occurred, leading to re-initiation of cracking at the bottom of the upper asphalt layer. Nonetheless, no rupture of the geocomposite component was detected. It can be observed that the 2nd inflection point did not occur for the reference system; however, failure points were registered for specimens tested at preset strains from 500 to 800 μstrain.
Effect of geocomposite reinforcement on fatigue performance
On the basis of classical approach of fatigue tests of plain specimens, failure point Nf is assumed when stiffness reaches 50% of its initial value. Fatigue curves, which are presented in Figure , are calculated on the basis of failure points reached at various preset strain levels. Parameters ϵ6 were calculated based on fatigue curves and marked in Figure . The fatigue models were calculated with the least-square method and they are presented in Figure as well. Based on the equations given in Figure , fatigue life can be extrapolated for level of strain, which occurs in the pavement structure, what is obviously related with some uncertainty.
Figure 9. Fatigue models obtained from the four-point bending test of reference and reinforced systems determined for plain specimens.
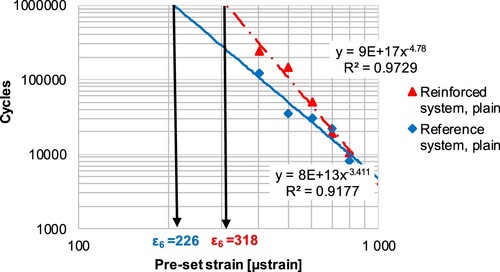
Owing to the presented research, it is possible to formulate a number of conclusions that may be of practical importance during implementation of geocomposites with multiaxial geogrid in the design of pavement reinforcement using mechanistic and empirical methods. The comparison presented in Figure shows that the effect of reinforcement of asphalt layers with AX5-GN geocomposite containing multiaxial geogrid is significant in the case of pavements intended for heavy and medium traffic. These structures are characterised by high total thickness of asphalt layers, smaller deformations at the bottom of asphalt layers (e.g. at the level between 70 and 130 μstrain) and deep location of the geocomposite within the pavement. Let us assume the strain level of 130 μstrain, which occurs at the bottom of asphalt layers for structure signed as KR3, which is a typical flexible structure for traffic from 0.5 to 2.5 million 100 kN ESAL. The structure is characterised by a total thickness of 36 cm, consisting of 3 asphalt layers (16 cm) and crushed aggregate base (20 cm), placed on a subgrade characterised by a subgrade modulus E2 ≥ 100 MPa determined after second load cycle of a static steel plate. Fatigue life calculated from equations given in Figure for 130 μstrain equals 7,832,285 loads in the case of reference system and 81,486,699 loads in the case of reinforced system. Therefore, fatigue life of reinforced systems increased by a factor of 10.4 as compared to unreinforced systems. The relative increase in fatigue life increases with a decrease in strain, and for 70 μstrain fatigue life increases by a factor of 21.8 due to reinforcement. In the case of design methods based on the critical deformation value for 1 million loads (ϵ6), reinforcement of the asphalt layers with geocomposite enabled obtaining an increase in the critical deformation value ϵ6 of up to 40%. However, the relative increases in parameters Nf and ϵ6 should be treated with certain reserve, since in full-scale conditions several additional factors affect the fatigue life of pavement.
Fatigue models for plain systems given in Figure correspond to experimental data well, as confirmed by high values of the coefficient of determination R2 > 0.9. In the case of notched specimens, especially for reinforced systems, the accuracy of the model is significantly lower and R2 = 0.54. It implies that other approaches than fatigue curve should be used to evaluate the effect of reinforcement on delay of crack propagation.
Delay of crack propagation for notched samples
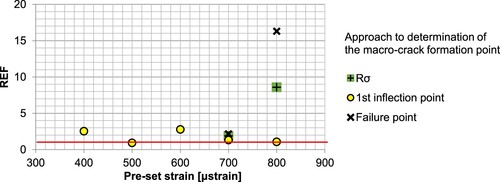
It is observable that for the samples without reinforcement the crack easily propagated into the upper layer, whilst for the samples reinforced with geocomposite with multiaxial geogrid the crack was inhibited and did not propagate through the geocomposite inter-layer. A comparison of crack propagation between the non-reinforced sample and sample reinforced with geocomposite is presented in Figure . For the determination of macro-crack development, energetic ratio Rσ proposed by Rowe (Citation1996) was used. The Rσ parameter, when analysed as function of the number of cycles, reaches its maximum value at the point at which the asphalt mixture begins to develop macro-cracks. The number of load cycles at which the peak Rσ is reached may be considered as the fatigue life of the mixture or – like in the case of this analysis – of the entire layered system. The approach was further used to determine the number of cycles to macro-crack formation and the Reinforced Effectiveness Factor (REF) according to formula (8).
The energetic ratio Rσ versus the number of cycles for selected preset strains is presented in Figure . REF was calculated for 700 and 800 μstrain – the cases in which macro-cracking was observed for both the reinforced and unreinforced systems. REF equals 1.9 and 8.6, respectively. The values are also shown in Figure . When the 1st inflection point is used as the criterion of macro-crack formation, REF ranges from 0.94 to 2.79. Analogously, consideration of failure point as the criterion results in REF values ranging from 2.17 to 16.3. It is visible that for each considered approach of determination of macro-crack formation point REF is close to or higher than 1, what indicates a positive effect of geocomposites application.
Figure 10. Macro-crack evaluation, (a) 400 μstrain (no macro-crack in both systems), (b) 500 μstrain (macro-crack in plain system), (c) 700 μstrain (macro-crack in both systems) and (d) comparison of cf.
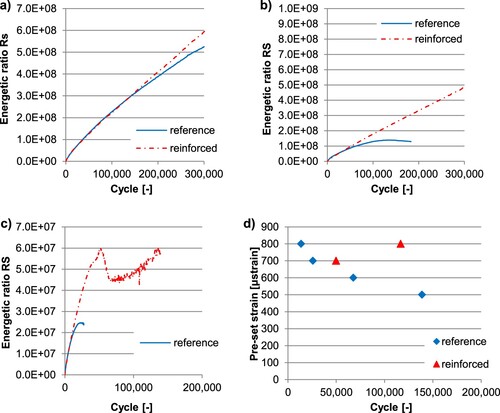
Figure 11. Reinforced effectiveness factor (REF) calculated for various preset strains and using several approaches to determination of macro-crack formation point.
Consideration of dissipated energy in evaluation of fatigue performance and delay in crack propagation
As the fatigue test progresses, dissipated energy cumulates in a manner that is close to linear on a log–log scale. However, in the cases in which macro-cracks form, deviation from this trend is observed. In the literature (Shen et al., Citation2006), the ratio of dissipated energy change RDEC and the plate value PV approach were used and discussed for evaluation of fatigue life of asphalt mixtures. However, accurate determination of PV is problematic due to testing noise, resulting in wide distributions of the dissipated energy points recorded in successive loads. For this reason, the authors used a simplified approach, which uses the ratio between the total dissipated energy from the beginning of the test W and the current number of loads N. Values of the ratio represent average energy dissipated in one load cycle DE. The higher DE, the more energy is consumed on crack formation. Ratios were calculated at N equal to 100, 1000 and 10,000 cycles, taking into account various values of preset strain as well. The results are presented in Figure .
Figure 12. Ratio between the total dissipated energy from the beginning of the test W and the current number of loads N for (a) plain specimens and (b) notched specimens.
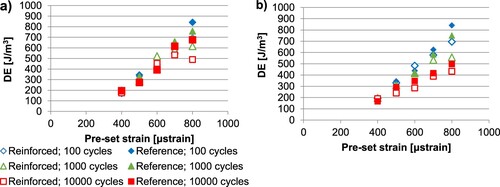
It can be concluded from Figure that at the lowest preset strains (400 μstrain) differences between reference and reinforced systems are small. However, with an increase in the preset strain, higher energy is dissipated in the case of reference systems and at earlier cycles of the test. The similar tendencies are observed for plain and notched specimens.
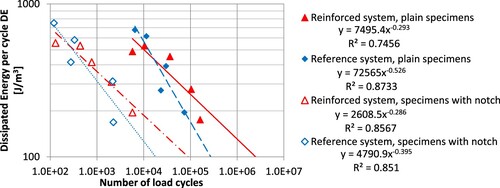
In Figure , the dissipated energy per one load cycle, calculated for N = 1000, is presented in relation to the number of cycles to the first inflection point, determined based on Figures and . The diagram is presented on a log–log scale; the power functions were determined for each of the considered systems. The positive effect of geocomposite reinforcement is evident also when the dissipated energy approach is considered. According to the developed relationships given in Figure , when the values of dissipated energy per cycle are lower, the differences between the number of cycles to crack initiation (first inflection point) determined for reinforced and reference systems increase. In this context it is worthwhile to refer to recent studies of Rys and Canestrari (Citation2023), where values of the strain energy of distortion under traffic loads were calculated for various pavement structures. The maximum value of the strain energy of distortion calculated for standard 100-kN axle load varied from 20 to 200 J/m3 for thick and thin pavements, respectively. Let us assume that DE induced by a standard axle is on the level of 100 J/m3. According to Figure , the factor of relative increase in the number of cycles to the first inflection point when reinforcement is introduced ranges from 5 to 10.
Figure 13. Dissipated energy per load cycle versus number of loads to crack initiation (the 1st inflection point).
Conclusions and recommendations
Based on the analysis of the results of the performed fatigue tests, the following conclusions can be formulated:
Enhancing the pavement with the geocomposite containing multiaxial geogrid noticeably increases its fatigue life. The effect of asphalt reinforcement is more beneficial in the case of new pavements with thick asphalt layers, where one can expect lower tensile strains at the bottom of these layers. An increase in fatigue life by a factor of 10–22 is possible, as compared to the unreinforced system.
A slight decrease in initial stiffness modulus of the reinforced samples was observed as an effect of reduction in shearing strength at the interface between layers; therefore, differential movement between asphalt overlay and geocomposite can be expected. It seems to be a positive effect coming from the bitumen-saturated fabric, which eventually provides stress relief function; the maximum decrease in the crack propagation process was by a factor of 9, depending on the strain level.
Application of geocomposite with multiaxial geogrid in an asphalt pavement will significantly delay the occurrence of fatigue cracking and thus extend the overall pavement life and reduce the number of cracks. The reinforced system displays reduced decrease in stiffness during cyclic loading; it is able to bear loads over a longer period, in contrast to the unreinforced system.
The positive effect of geocomposite reinforcement is evident also when dissipated energy approach is considered. The factor of relative increase in the number of cycles to the first initiation of crack in lower asphalt layer when reinforcement is introduced ranges from 5 to 10.
From the design perspective, the following studies and tests are recommended to be continued in the future:
Appropriate conversion or shift (fatigue improvement) factor between the laboratory-obtained results and the actual pavement life should be found.
In each particular case, the improvement factor value that is finally adopted should depend on a number of sub-factors, including thickness and number of layers of the designed overlay, the predicted traffic, the depth of the geocomposite in relation to the total thickness of the asphalt layers, the method of geocomposite installation, etc.
Full-scale field testing should be performed to evaluate and validate the fatigue performance parameters obtained in laboratory conditions.
Disclosure statement
No potential conflict of interest was reported by the author(s).
Correction Statement
This article has been corrected with minor changes. These changes do not impact the academic content of the article.
References
- Al-Qadi, I. L. (2006). Pavement interlayer system mechanisms: Separation, reinforcement, and reflective cracking control. In Chinese society of pavement engineering (p. 73).
- Brown, S. F. (1985). Polymer grid reinforcement of asphalt. Journal of Asphalt Paving Technology, 54, 18–41.
- Canestrari, F., Belogi, L., Ferrotti, G., & Graziani, A. (2013). Shear and flexural characterization of grid-reinforced asphalt pavements and relation with field distress evolution. Materials and Structures, 48(4), 959–975. https://doi.org/10.1617/s11527-013-0207-1
- Correia, N. S. (2014). Performance of flexible pavements enhanced using geogrid-reinforced asphalt overlays. University of Sao Paulo.
- Graziani, A., Bocci, E., & Canestrari, F. (2014). Bulk and shear characterization of bituminous mixtures in the linear viscoelastic domain. Mechanics of Time-Dependent Materials, 18(3), 527–554. https://doi.org/10.1007/s11043-014-9240-x
- Hu, J., Liu, P., Wang, D., Oeser, M., & Tan, Y. (2016). Investigation on fatigue damage of asphalt mixture with different air-voids using microstructural analysis. Construction and Building Materials, 125, 936–945. https://doi.org/10.1016/j.conbuildmat.2016.08.138
- Jaskula, P. (2014). Guide for laboratory testing of interlayer bonding of asphalt layers according to the Leutner method. Tehcnical requirements for interlayer bonding. Gdansk.
- Jaskula, P. (2018). Sczepność warstw asfaltowych w wielowarstwowych układach nawierzchni drogowych (Wydawnictw). Gdansk.
- Jaskula, P., Rys, D., Stienss, M., Szydlowski, C., Golos, M., & Kawalec, J. (2021). Fatigue performance of double-layered asphalt concrete beams reinforced with new type of geocomposites. Materials, 14(9), Article 2190. https://doi.org/10.3390/ma14092190
- Jaskula, P., Rys, D., Stienss, M., Szydlowski, C., Golos, M., & Kawalec, J. (2022). Laboratory fatigue assessment of large geocomposite-reinforced double-layered asphalt concrete beams. Eleventh International Conference on the Bearing Capacity of Roads: Railways and Airfields, 3(3), 65–74. https://doi.org/10.1201/9781003222910-7
- Pasquini, E., Bocci, M., Ferrotti, G., & Canestrari, F. (2013). Laboratory characterisation and field validation of geogrid-reinforced asphalt pavements. Road Materials and Pavement Design, 14(1), 17–35. https://doi.org/10.1080/14680629.2012.735797
- Ragni, D., Montillo, T., Marradi, A., & Canestrari, F. (2020). Fast falling weight accelerated pavement testing and laboratory analysis of asphalt pavements reinforced with geocomposites. Lecture Notes in Civil Engineering, 48, 417–430. https://doi.org/10.1007/978-3-030-29779-4_41
- Rowe, G. M. (1996). Application of the dissipated energy concept to fatigue cracking in asphalt pavements [PhD thesis]. University of Nottingham.
- Rys, D., & Canestrari, F. (2023). Determination of equivalent axle load factors with the use of strain energy of distortion. Road Materials and Pavement Design, 24(2), 520–536. https://doi.org/10.1080/14680629.2021.2023613
- Shen, S., Airey, G. D., Carpenter, S. H., & Huang, H. (2006). A dissipated energy approach to fatigue evaluation. Road Materials and Pavement Design, 7(1), 47–69. https://doi.org/10.1080/14680629.2006.9690026
- Sobhan, K., Crooks, T., Tandon, V., & Mattingly, S. (2004). Laboratory simulation of the growth and propagation of reflection cracks in geogrid reinforced asphalt overlays. In Proceedings of the 5th international RILEM conference on cracking in pavements-mitigation: Risk assessment and prevention (Vol. 4(1), pp. 589–596).
- Solatiyan, E., Bueche, N., & Carter, A. (2020). A review on mechanical behavior and design considerations for reinforced-rehabilitated bituminous pavements. Construction and Building Materials, 257, Article 119483. https://doi.org/10.1016/j.conbuildmat.2020.119483
- Spadoni, S., Ingrassia, L. P., Paoloni, G., Virgili, A., & Canestrari, F. (2021). Influence of geocomposite properties on the crack propagation and interlayer bonding of asphalt pavements. Materials, 14(18), Article 5310. https://doi.org/10.3390/ma14185310
- Zieliński, P. (2013). Investigations of fatigue of asphalt layers with geosynthetics. Archives of Civil Engineering, 59(2), 247–263. https://doi.org/10.2478/ace-2013-0013
- Zofka, A., & Maliszewski, M. (2019). Practical overlay design method for geogrid reinforcement of asphalt layers. Road Materials and Pavement Design, 20(Suppl 1), S163–S182. https://doi.org/10.1080/14680629.2019.1590222
- Zofka, A., Maliszewski, M., & Maliszewska, D. (2017). Glass and carbon geogrid reinforcement of asphalt mixtures. Road Materials and Pavement Design, 18(Suppl 1), 471–490. https://doi.org/10.1080/14680629.2016.1266775