
 ?Mathematical formulae have been encoded as MathML and are displayed in this HTML version using MathJax in order to improve their display. Uncheck the box to turn MathJax off. This feature requires Javascript. Click on a formula to zoom.
Abstract
Bituminous binders naturally age, affecting the properties and performance of asphalt pavements. The physical and chemical characteristics of binders are influenced by environmental factors, leading to a decline in their performance and durability. Therefore, it is essential to understand the mechanisms of binder environmental aging to design more resilient and long-lasting asphalt pavements. This study examines the effects of temperature, liquid, and vapor water on binder aging to develop more durable pavements. Aging was induced at three temperatures (60°C, 70°C, 85°C) under dry air, 90% relative humidity, and water immersion conditions. Field-aged samples were also analyzed to compare with laboratory-aged samples. Fourier-transform infrared spectroscopy (FTIR) and dynamic shear rheometer (DSR) were used to assess chemical and rheological changes. To assess the similarity between samples and identify the lab aging protocol closest to field aging, Hierarchical Cluster Analysis (HCA) was employed for data analysis..
Introduction
Bituminous binder, an organic material characterised by its heterogeneous composition and viscoelastic properties, serves as a crucial binding agent in numerous construction applications (Hofer et al., Citation2023; Read & Whiteoak, Citation2003). Currently, the majority of binder, around 85%, is employed as a binder in asphalt mixtures for road construction, with the remaining 15% finding usage in various other industries (Bitumen, Citation1995; Hofer et al., Citation2022; McIntosh, Citation2008; Read & Whiteoak, Citation2003). However, paving binder is susceptible to environmental aging, which increases the risk of pavement damage, particularly cracking (Siroma et al., Citation2022). To effectively understand and manage binder aging, it is essential to replicate this process in a laboratory setting (Hofer et al., Citation2023).
The environmental degradation of binder typically occurs in two distinct phases: in the short-term during the initial stages of mixture preparation, transportation, and pavement construction, and in the long-term throughout its service life (Petersen, Citation(2009)). To simulate oxidative aging at the binder level, established protocols such as the Thin Film Oven (TFO), Rolling Thin Film Oven (RTFO), and Pressure Aging Vessel (PAV) methods are commonly employed (Hofko & Hospodka, Citation2016; Koyun et al., Citation2022; Nagabhushanarao & Vijayakumar, Citation2021). For short-term oxidative aging, in the TFO method, 3.2 mm thick binder films are exposed to an oven at 163°C for 5 h to induce short-term aging. Alternatively, the RTFO method subjects binder films of varying thicknesses to a controlled airflow at 163°C for 75 min (EN, Citation2014). On the other hand, the PAV protocol is used to replicate long-term oxidative aging by aging 3.2 mm binder films in a pressurised vessel with air at 2.07 MPa and temperatures ranging from 90°C to 110°C for a duration of 20 h (EN, Citation2012).
The currently established laboratory protocols for aging asphalt binders have limitations in accurately mimicking real-world field conditions and predicting natural pavement aging (Petersen, Citation(2009)). Pressure Aging Vessel (PAV) at 100°C and 20 bar for long-term aging is used while it has been known since 1990s that PAV technique was not designed to simulate the field aging, but this is performed to rapidly oxidise bituminous materials (Anderson et al., Citation1994; Lu et al., Citation2008). Moreover, several studies have observed disparities between laboratory-aged and field-aged samples. For example, Lu et al. (Citation2008) noted significant differences in the functional groups present in field-aged binder compared to those obtained through laboratory aging methods like the Rotating Thin-Film Oven Test (RTFOT), pressure aging vessels (PAV), and Rotating Cylinder Aging Test (RCAT) (Lu et al., Citation2008). Similarly, Jing et al. (Citation2019) conducted a study comparing the chemical composition and rheological properties of binder recovered from field-aged porous asphalt with binder aged in the laboratory using RTFOT and PAV. Their findings indicated that the three-year field aging of porous asphalt was more severe than laboratory aging (Jing et al., Citation2019). This inconsistency between field and laboratory aging was similarly noted in stone mastic asphalt, where a limited correlation between field aging and standard aging methods was evident (Jing et al. Citation2021b). Moreover, even when subjected to the same field aging conditions, porous asphalt displayed more pronounced aging effects compared to dense asphalt (Jing et al., Citation2022). Importantly, the established aging protocols failed to reproduce the aging pattern observed in field-aged samples (Jing et al., Citation2020). Qin et al. (Citation2014) underscored the existence of an aging gradient in field-aged asphalt, particularly noting that the combination of RTFOT and PAV only represented the lower portion (approximately 75 mm from the pavement surface) of an eight-year-old field-aged core extracted from regions in Arizona and Virginia (Qin et al., Citation2014). Based on rheological and chemical analysis, Singhvi et al. (Citation2022) discovered that doubling the duration of PAV aging could partially simulate eight to 12 years of pavement aging in Illinois. Nevertheless, they stressed that field aging did not align with laboratory aging using the PAV method (Singhvi et al., Citation2022). Mirwald et al. (Citation2020) introduced the Viennese Binder Aging (VBA) method for long-term aging, involving exposing samples to air with elevated levels of ozone (O3) and nitrogen oxides (NOX) (Mirwald et al., Citation2020). Additionally, Primerano et al. (Citation2023b) conducted laboratory aging on an unmodified bitumen using the Pressure Aging Vessel (PAV) for one to five cycles and the VBA method. They compared the results with a field sample of the same base binder. Measurements with the dynamic shear rheometer (DSR) and Fourier-transform-infrared (FTIR) spectroscopy indicated that neither VBA nor multiple PAV cycles could achieve the field aging level. However, a more accurate approximation, compared to the standard aging procedure, was obtained chemical and mechanical analysis of field and laboratory aged bitumen (Primerano et al. Citation2023b). These limitations of PAV aging have been consistently documented in multiple research works, indicating its inadequacy in mirroring 5–10 years of actual service life (Airey, Citation2003; Besamusca et al., Citation2012; Erskine et al., Citation2012; Lu et al., Citation2008; Qian et al., Citation2020). One plausible explanation for the observed disparities between laboratory and field aging procedures is the omission of environmental aging factors from the laboratory protocols. In actual operational conditions, binder is exposed to diverse aging agents which is not accounted for in the PAV aging protocol.
Environmental aging elements, including UV light, moisture/condensation, highly oxidant gases, temperature, time, traffic impact, pressure, airflow, and salt aging, stand out as pivotal factors. Consequently, there is an urgent demand for the development of new protocols that can encompass a broader spectrum of environmental aging factors, aiming for a more accurate emulation of real-world aging conditions. Each of these factors can induce diverse degradation patterns in bituminous binders. The optimal laboratory aging protocol should consider all these factors and their interconnected effects. Detailed information about the impact of each factor can be found in existing literature (Airey, Citation2003; Petersen, Citation(2009)) Nevertheless, formulating a comprehensive protocol that replicates field aging necessitates a profound understanding of the individual effects of each factor, which remains challenging due to the complex nature of bitumen. In this study, our focus is specifically on comprehending the impact of water in both liquid and vapour states in conjunction with temperature variations.
To explore the influence of individual aging factors, typical experimental characterisation by Fourier-Transform Infrared spectroscopy (FTIR) and dynamic shear rheometer (DSR) were utilised. In recent times, there has been a growing utilisation of FTIR to examine changes in the chemical composition of bituminous binders. The modern FTIR devices, due to their compact design, do not demand extensive and environmentally controlled laboratory space. They also necessitate only a small sample size for testing, making them both time and cost-efficient (Hofko et al., Citation2017). Even though these methods enable the acquisition of extensive data in a relatively short timeframe, which can pose challenges for analysis. Moreover, traditional data analysis approaches encounter difficulties when comparing laboratory-aged samples with their field-aged counterparts, due to the complexity of the high-dimensional data. high-dimensional data. This is where multivariate methods come into play, offering a valuable means of gaining clearer insights. Hierarchical Cluster Analysis (HCA) is a classic unsupervised method for clustering high dimensional data. It is a widely recognised technique for visualising the relationships and similarities among samples. In the context of HCA, dendrograms are a popular tool, working under the assumption that similar samples are positioned in closer proximity to each other (Brereton, Citation2015).
In the field of pavement engineering, Siroma et al. (Citation2021) exclusively employed phase angle master curves and multivariate statistical methods, like principal component analysis (PCA) and HCA, to determine the aging status of binder samples. In a study by Primerano et al. (Citation2023a), they aimed to distinguish between light, PAV, and VBA aged samples based on original FTIR spectra. To achieve this, they applied multivariate analysis utilising random forest, PCA, and PLSDA methods. The study identified crucial wavenumbers for efficient classification of samples at different aging conditions (Primerano et al. Citation2023a). In another study by Ma et al. (Citation2023), they used PCA-linear discriminant analysis (LDA) on FTIR spectra. The study classified different types of bitumen at various aging stages, highlighting key chemical differences necessary for accurate classification. Aliphatic and aromatic bonds in the spectrum were important for identifying bitumen types, with notable chemical changes seen in the 1800–900 cm−1 range (Ma et al., Citation2023). Guduru et al. (Citation2022 and Citation2023) applied Hierarchical Clustering on Principal Components (HCPC) analysis to establish classification limits for each Reclaimed Asphalt Pavement (RAP) category (Guduru & Kuna, Citation2023; Citation2022). Sreeram et al. (Citation2022) employed hierarchical clustering (HC) and factor analysis (FA) on mass spectrometry data to identify common molecular groups of binder-specific primary and transformation compounds to better understand the composition of binders and their important characteristics including oxidative transformations (Sreeram et al., Citation2022). These methods were used for chemically fingerprinting asphalt binders with high time and chemical resolution, including real-time observations of rapid chemical changes during oxidation. In this study, our goal is to apply multivariate methods not solely to chemical or rheological data but to both, aiming for a more comprehensive understanding.
This research aims to investigate the influence of water molecules in liquid and vapour forms on two different types of binder aging (Q and T). To achieve this objective, unmodified binder that had undergone short-term aging was subjected to long-term aging using three different methods. The first involved oven aging at three different temperatures (60°C, 70°C, 85°C) for a duration of three weeks. The second method utilised a climate chamber at the same temperatures and duration, along with 95% relative humidity. Lastly, the same climate chamber setup was used with samples immersed in demineralised water. Characterisation of the binder samples was conducted using two analytical techniques: Fourier-transform infrared spectroscopy and dynamic shear rheometer. Furthermore, multivariate analysis method, i.e. HCA, was employed to provide a comprehensive comparison of laboratory and field data.
Materials and methods
Materials
In this study, two unmodified paving binders from two different sources, Q 70/100 and T 70/100, were used to prepare films of 1 mm thickness. Table shows the main specification of the examined binders.
Table 1. Specifications of Q 70/100 and T 70/100 binders at fresh (unaged) state.
Sample preparation and aging method
Sample preparation involved two basic aging steps, namely short-term aging (STA) and long-term aging (LTA). Both Q 70/100 and T 70/100 binder samples in their original states were subjected to STA using a standard method. Specifically, to simulate short-term aging, 3.2 mm thick binder films underwent the Thin Film Oven Test (TFOT) at 163°C for 5 h, following the EN 12607-1 test standard (Airey, Citation2003). The short-term aged binder was then collected and used to prepare samples for long-term aging. To achieve films with 1 mm thickness, the appropriate weight of TFOT short-term aged binder was calculated based on the available surface area of the petri-dishes and binder density (1.03 gr/cm3). To ensure a flat surface of the binder film, the samples were heated in an oven at 160°C for 5 min. Subsequently, the films were allowed to cool at room temperature (25°C) for two hours before undergoing long-term aging (Figure (a)).
Figure 1. (a) Bitumen film of 1 mm in a petri-dish, (b) Climate chamber setup.
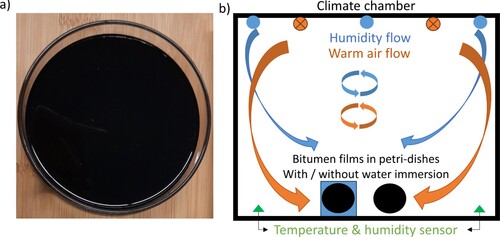
Long-term aging was conducted using both an oven and a climate chamber at three different temperatures: 60°C, 70°C, and 85°C. The oven aging simulated thermo-oxidative aging, while the climate chamber introduced 95% relative humidity to replicate hygrothermal aging conditions. Furthermore, aqueous-thermal aging was achieved by immersing the samples in demineralised water within the climate chamber. Figure (b) provides a graphical representation of the aging setup in the climate chamber. The conventional approach to bitumen aging using PAV involves applying high pressure to accelerate aging. However, in this study, the pressure factor is not considered. Instead, we focus on longer durations to observe the impact of aging factors. Essentially, the extended duration facilitates the completion of the oxidation reaction. We have chosen a period of 21 days and shorter intervals to find the required duration for aging. This approach allows us to systematically track the progressive oxidation of bitumen. Furthermore, following the end of the LTA procedure, the samples underwent a mixing and homogenisation process for a duration of 5 min at 170°C. This step was implemented to mitigate the impact of any potential aging gradient within the samples.
In this study, the naming convention for the samples is based on the type of binder and the specific aging conditions applied. Each sample undergoes different aging processes, denoted by labels such as STA (for short-term aged). The designation for long-term aged film samples follows a consistent format, comprising four parts: the first part indicates the binder type (Q or T), the second part represents the long-term aging temperature (60°C, 70°C, or 85°C), the third part indicates the duration of aging (1, 7, 14, or 21 days), and the final part specifies the type of aging, including hygrothermal (H), thermo-oxidative (O), and aqueous-thermal (W) aging. For instance, ‘Q_85_14D_H' signifies Q binder 1 mm films that underwent hygrothermal aging at 85°C for 14 days.
Field samples
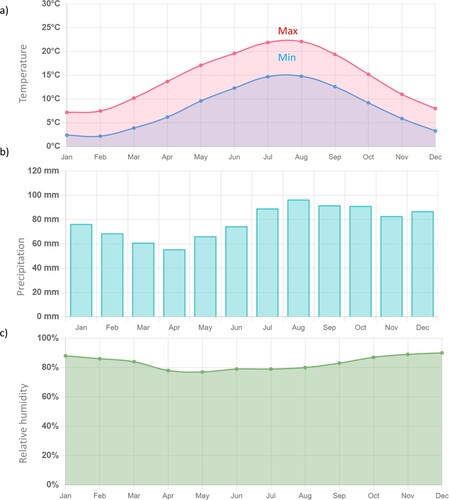
In October 2014, pavement sections were constructed and have since been continuously exposed to the environmental conditions. The location, situated in the Netherlands, experiences a temperate maritime climate that bears the influence of the North Sea and the Atlantic Ocean, resulting in cool winters with daytime temperatures ranging from 2°C to 7°C and moderate summers with temperatures between 15°C and 20°C, as shown in Figure (a). Precipitation is relatively evenly distributed throughout the year, with a minimum of 60 mm precipitation in April and maximum precipitation of almost 100 mm in August, Figure (b). Moreover, the humidity level is generally high in The Netherlands with higher with a drier period spanning from April to September, Figure (c).
Figure 2. Average (a) minimum and maximum temperature, (b) precipitation (mm), (c) relative humidity (%) in Amsterdam, Netherlands during Jan. 2021 to Dec. 2021, from weather-and-climate.com.
The complete structure of the pavement comprises a top layer of 50 mm thick, porous asphalt, followed by a layer of dense asphalt measuring 230 mm in thickness, and finally, a layer of cement-bound asphalt granulates, which is 250 mm thick. The uppermost layer comprises porous asphalt (PA), a predominant asphalt type widely utilised in the Netherlands’ highway network. This PA layer boasts a thickness of 50 mm and was applied in a single paving operation. Annually, asphalt cores with a diameter of 100 mm have been extracted from the PA layer, focusing on the top 12–14 mm of material, which is the segment pertinent to this study. These samples exclusively consisted of Q binder. The reader can refer to Jing et al. (Citation2021a) work for more details about the construction of the test sections (Jing et al. Citation2021a).
Binder from this specific layer was meticulously extracted and recovered in accordance with the European standard EN 12697-1. The extraction process involved the utilisation of dichloromethane as a solvent. Subsequently, to ensure the complete evaporation of the solvent, the recovered binder underwent scrutiny through both Dynamic Shear Rheometer (DSR) and Fourier-Transform Infrared (FTIR) tests (Jing et al. Citation2021a).
Fourier-Transform infrared spectroscopy (FTIR)
In this study, the chemical functional groups present in the binder samples were thoroughly analysed using FTIR spectrometry. The tests were performed using a Thermo Fisher Scientific Nicolet iS5 instrument with a diamond crystal in attenuated total reflectance (ATR) mode.
The sample preparation process involved taking approximately 0.5–1 gr of the binder, placing it on a spoon or spatula, and heating it over a heating plate. Simultaneously, the binder was stirred and homogenised with a spatula, while the temperature was monitored using a thermometer on the hot plate. Care was taken to position the sample close enough to the heating source for it to reach a liquid state within a short period (stirring for a maximum of 1 min). Once the binder becomes liquid, four droplets are dispensed onto separate sample holders, such as pieces of silicone paper.
The measurements were conducted under specific conditions, with a fixed resolution of 4 cm−1. The analysis spanned the wavenumber range of 600–4000 cm−1, encompassing key spectral regions. To ensure robust results, four different repetitions were tested for each sample with 24 scans per each sample. To quantify the presence of particular functional groups of interest, specifically carbonyl and sulfoxide groups, indices were determined based on well-defined wavenumber ranges. These indices, described by Equations (1)–(3), were computed using equations tailored to each functional group, with vertical limits detailed in Table . Before these indices were calculated, normalisation was applied to the spectral data to enhance their accuracy and reliability. Regarding normalisation, the lowest point within the 2800–3200 cm−1 region in all spectra was adjusted to zero, while the highest point in this region was set to one, and the remaining data in each spectrum were adjusted accordingly. In the calculation of aging indices, reference points were established using the tangential areas and the total area of the spectra, following a methodology outlined in the reference material (Zhang et al., Citation2019).
(1)
(1)
(2)
(2)
(3)
(3)
Table 2. Main functional groups of binder in FTIR spectra (Zhang et al., Citation2019).
Frequency sweep test
To ensure consistent thermal history between FTIR and DSR samples, the sample preparation method for DSR samples was aligned with that of FTIR. The Complex shear modulus (G*) and phase angle (δ) were assessed using a dynamic shear rheometer (DSR) with oscillatory loading. This involved measuring these rheological properties over a range of temperatures and frequencies. For the DSR tests, an 8 mm diameter parallel plate with a 2 mm gap was employed. The testing encompassed temperatures ranging from 0 to 40°C, with increments of 10°C. Similarly, the frequency span for the tests extended from 10 to 0.1 Hz, equivalent to 62.8 to 0.628 rad/s, while maintaining a consistent strain load of 0.1%. To facilitate analysis and comparison, master curves for the complex modulus and phase angle were established using the time-temperature superposition principle (TTSP), with a reference temperature set at 20°C. Each measurement was conducted in accordance with standard testing protocols (AASHTO T 315-19 (T315, Citation2012)), and to ensure data consistency, each sample underwent testing twice.
Multivariate analysis
To effectively compare field-aged and laboratory-aged results, it is crucial to evaluate both chemical and rheological data. To extract concealed insights from this dataset, the Hierarchical Cluster Analysis (HCA) clustering technique was employed. In essence, clustering seeks to categorise data points into clusters, optimising the similarity and dissimilarity between clusters. This process involves grouping items based on their similarities and differences. The input for this analysis included carbonyl and sulfoxide indices derived from FTIR data, as well as crossover frequency and crossover complex modulus obtained from DSR measurements. For each sample, the average of all repetitions (comprising 4 FTIR indices and 2 crossover values) was calculated.
HCA employs two primary strategies: agglomerative and divisive. In the agglomerative approach, each sample begins as a standalone cluster, and the algorithm progressively merges pairs of clusters based on their chosen metric of sample distance (commonly Euclidean, Mahalanobis, or Manhattan distance) and the chosen linkage criterion (single, complete, average, and ward’s linkage). These linkage criteria represent different approaches to defining the distance between clusters and contribute to the formation of clusters. In this study, we adopted the agglomerative approach, utilising Euclidean distance and Ward's linkage criterion. This criterion minimises the variance within each cluster and is chosen for its effectiveness in optimising a specific target function. The results of HCA are typically presented in the form of dendrograms, which provide a visual representation of sample organisation within a hierarchical tree-like structure (Siroma et al., Citation2021).
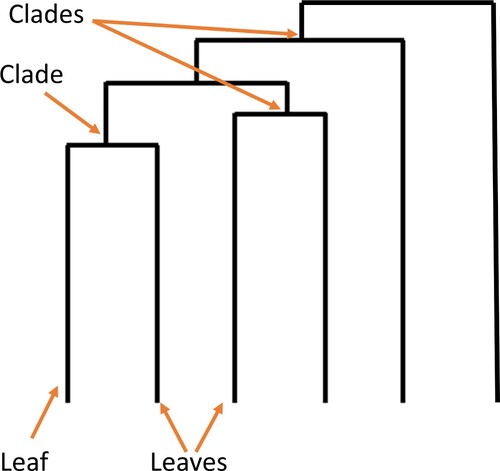
Within a dendrogram, each branch is denoted as a clade, and the terminal point of each clade is termed as a leaf (Figure ). The organisation of these clades conveys the degree of similarity between individual leaves. The point at which branches intersect indicates the level of likeness or dissimilarity, with higher intersections indicating greater disparities. Dendrograms can be interpreted in two ways: firstly, in terms of broad-scale groupings, where we begin reading from the top, emphasising high-level branch points. Secondly, to understand which specific components are most similar to each other, we read from the bottom, identifying the earliest converging clades as we move upwards. The length of the vertical lines within the dendrogram reflects the degree of divergence between branches, with longer lines indicating greater distinctions. The horizontal alignment of dendrograms is not significant and can be envisioned as a mobile structure where the arms may shift while maintaining consistent vertical height and subgroup arrangement (Saraf & Patil, Citation2014).
Figure 3. Illustration of a dendrogram depicting the hierarchy of leaves and clades.
The implementation of HCA clustering in this study was carried out using appropriate Python programming libraries.
Results and discussion
Fourier-transform infrared spectroscopy
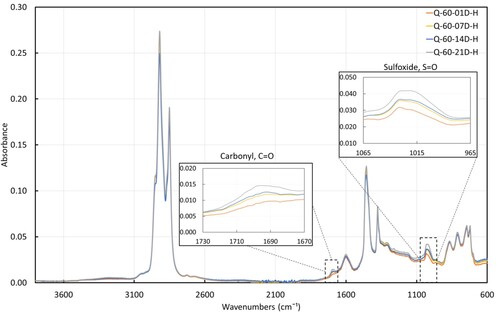
FTIR spectroscopy was employed to gather insights into the chemical functional groups present in the binder samples. Figure displays a collection of representative spectra for Q binder subjected to hygrothermal aging at 60°C for varying durations. These spectra allow for a comparative assessment of the aging levels among the samples. Figure illustrates the spectral evolution of sulfoxide and carbonyl peaks. Focusing on the carbonyl peaks, samples subjected to 7 and 14 days of aging at 60°C, and hygrothermal aging, exhibit comparable initial and final points, with slight deviations in the curves. This suggests a similar progression in the development of the carbonyl functional group among these samples. While the sulfoxide region displays similarities, variations in the ending points indicate potential differences in sulfoxide samples. Further evaluation through normalisation and indices comparison can provide insights into these differences.
Figure 4. FTIR spectra of Q binder aged at 60°C with 95% humidity during different aging times, i.e. 1, 7, 14, and 21 days.
To compare the aging level of the samples, the analysis focused on two distinct functional groups. The carbonyl and sulfoxide indices, widely employed in aging studies, were examined (Hofko et al., Citation2017). In Figure (a and b), the absence of carbonyl functional groups is obvious in both fresh and short-term aged samples of Q and T binders. However, following prolonged aging, carbonyl groups become apparent in the binders. Conversely, the sulfoxide group, Figure (c and d), is present in both fresh and short-term aged Q and T samples. When comparing carbonyl and sulfoxide indices for Q and T binders, it is notable that Q binder exhibits higher values for the carbonyl index, while T binder displays higher values for sulfoxide indices. Given the similar initial conditions of both binders, it can be inferred that they possess distinct aging susceptibilities. Under similar aging conditions, these binders undergo activation of different aging pathways.
Figure 5. FTIR results for (a) carbonyl index of Q samples, (b) carbonyl index of T samples, (c) sulfoxide index of Q samples, (d) sulfoxide index of T samples aged at 60°C, 70°C, and 85°C for 1, 7, 14, and 21 days in thermo-oxidative (O), hygrothermal (H), and water-immersion (W) conditions.
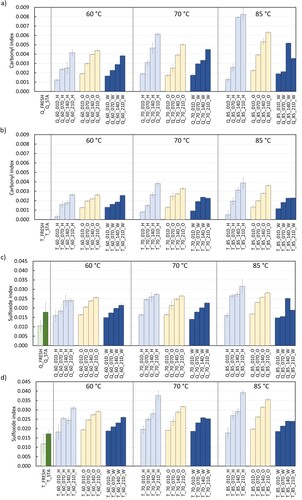
Remarkably, at each aging temperature, hygrothermal aging exhibits the highest values for both indices, followed by thermo-oxidative aging, while aqueous-thermal aged samples exhibit the lowest values. This observation implies that hygrothermal aging accelerates the aging process, whereas aqueous-thermal aging decelerates it. This phenomenon can be attributed to the water layer atop the binder films during aqueous-thermal aging, potentially hindering oxidative reactions within the binder films by creating a barrier to oxygen diffusion. Conversely, the presence of humidity in gas form, coupled with oxygen molecules from the air, increases the likelihood of forming more reactive species, resulting in a higher rate of oxidation reactions compared to the presence of only air molecules.
The observed trend, as revealed through the comparison of hygrothermal aged samples at different temperatures (depicted in Figure (a and c) for Q binder, Figure (b and d) for T binder), wherein heightened temperature and humidity over 14 or 21 days induced more significant aging compared to lower temperatures with humidity, despite identical aging durations, can be attributed to several factors. Firstly, higher temperatures reduce the binder’s viscosity, facilitating the diffusion of oxygen and oxidative species into the sample. Secondly, higher temperatures provide the necessary activation energy for oxidation reactions, expediting their initiation and progression. Moreover, increasing the temperature increases the average kinetic energy of molecules, leading to more collisions with enough energy to form reactive species that may be more effective for aging.
Furthermore, the comparison of aqueous-thermal aging at various temperatures shows that elevating the temperature to 85°C did not increase the oxidative aging in the samples. It is crucial to emphasise that the physical dissolution of oxygen in water is temperature dependent. While chemical reactions involving oxygen in water and bitumen may also be affected by temperature, the primary factor influencing oxygen solubility is the physical dissolution process described by Henry's Law. This law states that the solubility of a gas in a liquid is directly proportional to the partial pressure of that gas above the liquid and inversely proportional to the temperature. With an increase in water temperature, the kinetic energy of water molecules rises. This heightened thermal motion reduces the ability of water molecules to retain dissolved gases, including oxygen. Consequently, at higher temperatures, the solubility of oxygen in water decreases, leading to a reduction in the aging reaction of bitumen.
Under various hygrothermal, thermo-oxidative, and aqueous-thermal conditions, extended durations generally lead to elevated values for both carbonyl and sulfoxide indices. In specific instances, such as T_85_14D_W and T_85_21D_W, the indices after 14 and 21 days of aging are identical, indicating that two weeks of aqueous-thermal aging yield similarly aged samples compared to three weeks. Additionally, Q_60_7D_H and Q_60_14D_H exhibit similar carbonyl indices but distinct sulfoxide indices, as confirmed by raw spectra in Figure . Conversely, T samples display comparable values for both indices in T_60_7D_H and T_60_14D_H. This observation may suggest an intermediate stage of the oxidation reaction at 60°C in the presence of humidity. Notably, only Q_85_21D_W exhibits significantly lower indices compared to Q_85_14D_W. This discrepancy may stem from the sample's inhomogeneity before FTIR measurements. Rheological characterisation of these samples will explain whether the observed trend is attributed to binder heterogeneity or varying levels of aging.
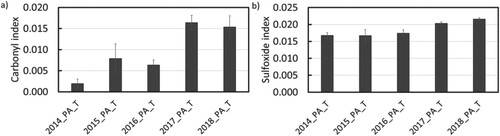
The evolution of carbonyl and sulfoxide indices in field-aged samples is depicted in Figure . Both indices consistently increased over a 4-year duration, focusing specifically on the uppermost layer (1.3–1.5 cm) denoted as ‘T' in the sample names. The carbonyl and sulfoxide indices in the field samples displayed a parallel increasing trend over time. Samples from 2015 and 2016 exhibited similar values for both indices, while samples from 2017 and 2018 demonstrated similar carbonyl indices. This suggests that the aging progression observed in laboratory-aged samples follows a comparable trajectory to that observed in the field samples. However, the time required to observe a significant increase in aging products in the field samples may extend beyond one year.
Figure 6. FTIR results for field aged samples of 2014–2018, (a) carbonyl index, (b) sulfoxide index.
In summary, the carbonyl and sulfoxide indices serve as valuable indicators for tracking the degree of binder aging. The rate at which carbonyl and sulfoxide form varies between different binders and is dependent on the specific aging susceptibility of each binder. Moisture presence during aging has a more pronounced impact on binder aging compared to either thermo-oxidative or aqueous-thermal aging alone. Additionally, raising the aging temperature enhances the effects of hygrothermal aging. It is advisable for future studies to incorporate shorter intermediate durations as crucial components of the experiment to identify intermediate aging patterns. Additionally, the combination of SARA fractionation with FTIR can provide valuable insights into understanding intermediate stages of binder aging.
Rheological characterisation
The binder samples underwent evaluation via the Dynamic Shear Rheometer (DSR), with two replicate samples for each condition. Employing the Time-Temperature Superposition (TTS) principle, comprehensive master curves were meticulously constructed for both the complex shear modulus and phase angle, utilising a reference temperature of 20°C.
Figures and , and Figure (a and b) provide visual insights into the evolving rheological properties of Q and T bituminous binder films at 60°C, 70°C, and 85°C, respectively, during aging under varying conditions. It is readily apparent that extended durations result in increased aging, which means higher complex modulus values and lower phase angle values.
Figure 7. Master curves (at 20°C) at 60°C for (a) Q binder and (b) T binder, at all aging states, i.e. fresh, TFOT short-term aged, and 1, 7, 14, 21 days (D) of hygrothermal (H), aqueous-thermal (W), and thermo-oxidative (O) conditioning.
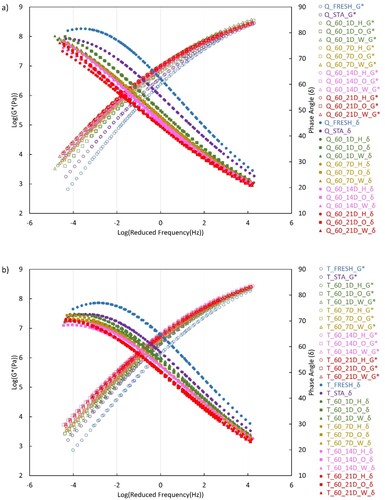
Figure 8. Master curves (at 20°C) at 70°C for (a) Q binder and (b) T binder, at all aging states, i.e. fresh, TFOT short-term aged, and 1, 7, 14, 21 days (D) of hygrothermal (H), aqueous-thermal (W), and thermo-oxidative (O) conditioning.
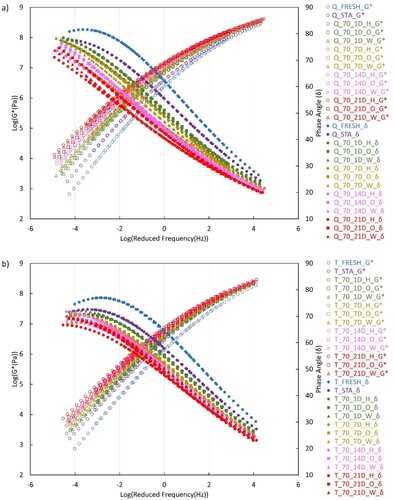
Figure 9. Master curves (at 20°C) at 85°C for (a) Q binder and (b) T binder, at all aging states, i.e. fresh, TFOT short-term aged, and 1, 7, 14, 21 days (D) of hygrothermal (H), aqueous-thermal (W), and thermo-oxidative (O) conditioning.
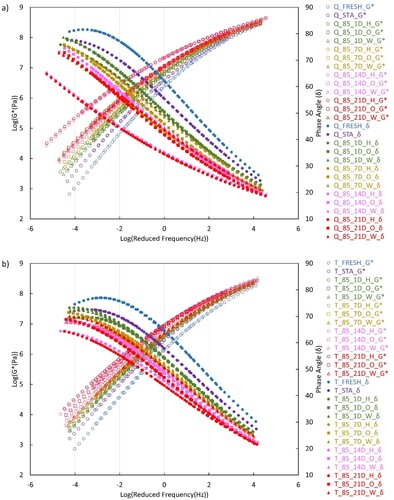
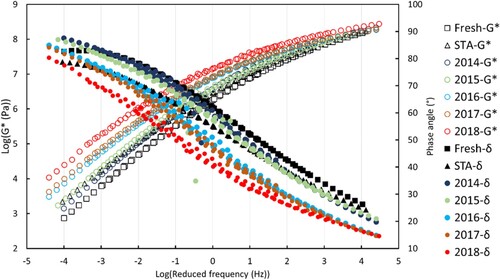
The G* master curve of the Q samples showed a rotation in the curves for 21-day aged samples while other samples only showed a slight increase of G* at high frequencies. Rotation, in this context, refers to the phenomenon where the master curve decreases at high frequencies and increases at low frequencies. This can be visualised as a clockwise rotation of the curve, with the midpoint of the curve serving as the fixed point of reference. Since other Q samples aged at different temperatures (Figures and (a)) or field condition (Figure ) do not show any rotation, this rotation should be specific for Q binder aged at 60°C for long duration of 21 days.
Figure 10. Master curves (at 20°C) of field aged samples from 2014 to 2018.
At temperature of 60°C, the distinctions among various aging methods, including oven aging, exposure to liquid, and vapour water, are initially subtle. However, for Q samples, these differences become more pronounced in the phase angle master curve, particularly at lower frequencies, following 14 or 21 days of aging (as depicted in Figure (a)). It is noteworthy that hygrothermal aging induces more significant aging effects compared to the other aging conditions. For T samples, the phase angle master curve of thermo-oxidative aged samples exhibited a slightly greater reduction after 1 and 14 days, while after 21 days, the master curves for different conditions overlapped (as illustrated in Figure (b)).
In Figure (a), the Q samples aged at 70°C demonstrate progressively greater distinctions among aging conditions from earlier stages. Here, both the phase angle and complex modulus master curves illustrate disparities at low frequencies. Moreover, at intermediate frequencies, aqueous-thermal and hygrothermal aging exhibit overlap. Nevertheless, the distinction between these two conditions becomes evident in the phase angle master curve at low frequencies, with hygrothermal samples exhibiting more advanced aging. For T samples aged at 70°C (Figure (b)), the results were quite similar after 1 d of aging across all conditions. However, after 7 days, minor differences emerged in the phase angle master curve, particularly at low frequencies, indicating that hygrothermal aged samples exhibited lower phase angle values. Among the 21-day aged samples, hygrothermal aged samples exhibited the lowest phase angle values and the highest complex modulus values at low frequencies.
Moving to the highest temperature in this experiment, i.e. 85°C in Figure (a), it becomes apparent that higher temperatures amplify the disparities among aging conditions for Q binder. Additionally, this disparity extends beyond low frequencies and becomes obvious even at intermediate frequencies. 14 and 21 days of hygrothermal aging induced comparable levels of aging in the Q binder. A comparison of the master curves in Figures (a) highlights that 14 or 21 days of hygrothermal aging represented the most severe aging conditions. In the FTIR analysis, Q_85_14D_W exhibited higher indices than Q_85_21D_W samples. It was uncertain whether this difference was due to aging or sample inhomogeneity. However, the master curves for these samples overlapped, indicating a similar level of aging. Therefore, the observed increase in FTIR indices for the 14 days aged samples was attributed to the heterogeneity of the FTIR samples. For T samples aged at 85°C (Figure (b)), after 1 d, the thermo-oxidative sample had the lowest phase angle at low frequencies. After 7 days, hygrothermal aged samples showed more aging than aqueous-thermal aged ones, and aqueous-thermal aging was more pronounced than thermo-oxidative aging. This trend continued for 14 and 21 days, with hygrothermal aged samples increasingly diverging from the others, while thermo-oxidatively and aqueous-thermally aged samples exhibited similar aging patterns. Notably, this pattern was also observed for Q binder. At higher frequencies, all conditioning methods had similar effects, with only the duration of aging slightly affecting the phase angle master curves. The comparison of Figure (a and b) indicates that 14 and 21 days of hygrothermal conditioning result in a similar level of aging for both Q and T binders. Examining the standard deviation for the carbonyl index supports this conclusion. Therefore, it can be inferred that the maximum level of aging has been attained under this condition for 14 days, and extending the duration further will not alter the stiffness of the binders. This observation underscores the significance of optimising the duration for aging protocols, as a short duration might interrupt the reaction, while a longer duration beyond the point of maximum aging may be unproductive.
The DSR analysis revealed a clear correlation between aging duration and rheological changes in both Q and T binder samples. As aging duration increased, complex modulus values rose, and phase angle values decreased, indicating a more pronounced impact of aging. As the temperature increases, both Q and T samples exhibited increasing disparities among aging conditions, especially in the phase angle master curve, emphasising the influence of temperature on aging effects which aligning with FTIR outcomes. Notably, the phase angle results of fresh and short-term aged Q samples tend to approach a plateau at low frequencies, whereas the long-term aged samples show a continual increase at low frequencies. The plateau region in the master curves of fresh and short-term aged Q samples is exclusively obvious in the phase angle curve due to its increased sensitivity to the chemical composition. Alterations in the phase angle master curves in response to fluctuations in frequency exhibit greater importance than changes in G* at the same frequency range (Airey & Rahimzadeh, Citation2004; Lu et al., Citation1999). In the context of binder aging, there are documented instances of modified binders displaying plateau regions within their phase angle curves. These regions signify the emergence of a polymer network or entanglements, resulting from the polymer's expansion into the maltene phase of the binder. The presence of an elastic plateau is more obvious on the curves when a stronger molecular interaction between the binder and polymer is present (Bulatović et al., Citation2014; Wu et al., Citation2009). While this study did not employ any polymer in conjunction with the binder, it remains plausible that binder aging induced such distinctions. The absence of aging effect in fresh and short-term aged samples displaying the plateau, ensures the preservation of the binder's microstructure and composition, allowing the material to naturally form chemical networks at lower frequencies. Conversely, long-term aged binders subjected to different conditioning may undergo microstructural changes, thereby impairing their capacity to form conventional chemical structures.
On the other hand, T samples at fresh and short-term aged conditions tend to reduce at Log (reduced frequency) = −4 after passing a plateau at Log (reduced frequency) = −3. Importantly, the presence of the plateau is more obvious for samples long-term aged at low temperatures like 60°C and 70°C than 85°C aged samples. The reduction in phase angle values (increased elastic response) after the presence of a phase angle plateau, by moving towards lower frequencies, is an indication of the presence of ‘elastic’ networks in the fresh and short-term aged T binders (Airey et al., Citation2016). This increased elastic response at low frequencies (equivalent to high temperatures) provides the fresh and short-term aged T binder with enhanced resistance to permanent deformation. However, this reduction tends to disappear for long-term aged samples and only the plateau present at low frequencies. The more obvious presence of plateau in low temperature long-term aged samples shows that aging and especially high temperature aging can change the binder’s microstructure and composition, preventing the T binder to naturally form chemical networks at lower frequencies.
Figure provides an exposition of the master curves derived from field-aged samples collected during the AAP project spanning from 2014 to 2018. These field samples were exclusively composed of Q binder, and for comparative purposes, the master curves of fresh and TFOT short-term aged binder from the laboratory are also incorporated in Figure . As expected, there is an increase in G* values and a simultaneous reduction in the phase angle as the number of years of field aging increases. Moreover, phase angle values of 2014 and 2015 samples are located between the phase angle master curves fresh and short-term aged samples except for very low or very high frequencies. At high frequencies, field samples have lower phase angles which means more aged samples, while at low frequencies, field samples have higher phase angle values meaning less aging. Complex modules master curves of 2014 and 2015 samples are closely located by short-term aged samples at all frequencies.
Furthermore, within the analysis, two important parameters were computed: the crossover frequency (CR-Fr) and the crossover complex modulus (CR-CM). These metrics correspond to the frequency and complex modulus, respectively, at which the phase angle attains 45° and the storage modulus equals the loss modulus. CR-CM and CR-Fr values serve as valuable indicators of the transition in binder's viscoelastic behaviour, describing the shift from fluid-like to solid-like characteristics. Prior research has established a relationship between lower CR-Fr values in aged binder and attributes such as higher molecular mass, extended relaxation time, and elevated softening point. A higher crossover frequency indicates that the binder behaves more elastically at higher frequencies. This can contribute to better resistance against permanent deformation or rutting, especially under repetitive traffic loading at high frequencies (Jing et al., Citation2020; Scarsella et al., Citation1999). Conversely, diminished CR-CM values suggest a broader distribution of molecular masses, indicating increased polydispersity (Jing et al., Citation2020; Scarsella et al., Citation1999). Moreover, a higher crossover modulus indicates that the binder has a higher stiffness at the crossover frequency. This stiffness can contribute to better resistance against rutting, as stiffer materials are less prone to permanent deformation under traffic loads. The transition towards lower CR-CM and CR-Fr values with aging, irrespective of binder type, suggests a consistent aging effect.
Figures and (a–d) portray the logarithmic representations of CR-CM for all tested samples plotted against the corresponding logarithmic CR-Fr values for Q and T binder, respectively. The aging process caused a notable reduction in both CR-CM and CR-Fr. As outlined in Figures and , the samples consistently exhibited a shift towards lower CR-CM and CR-Fr values subsequent to long-term aging, irrespective of whether they belonged to the Q or T binder category.
Figure 11. Crossover complex modulus versus crossover frequency of Q binder at (a) 60°C, (b) 70°C, and (c) 85°C at all aging states, i.e. fresh, TFOT short-term aged, and 1, 7, 14, 21 days (D) of hygrothermal (H), aqueous-thermal (W), and thermo-oxidative (O) conditioning, (d) all 21-day aged samples of all conditions.
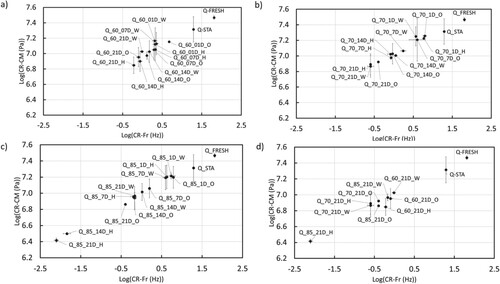
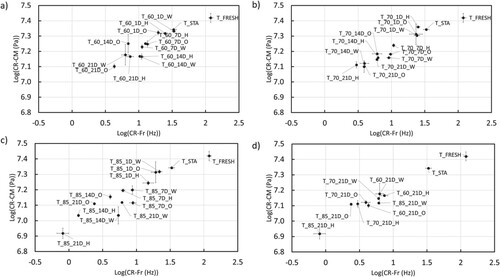
Figure 12. Crossover complex modulus versus crossover frequency of T binder at (a) 60°C, (b) 70°C, and (c) 85°C at all aging states, i.e. fresh, TFOT short-term aged, and 1, 7, 14, 21 days (D) of hygrothermal (H), aqueous-thermal (W), and thermo-oxidative (O) conditioning, d) all 21-day aged samples of all conditions.
Specifically, for Q samples aged at 60°C and 85°C, it was evident that the 21 and 14-day hygrothermal aging yielded the most aged samples. Conversely, in the case of Q samples aged at 70°C, the 21-day hygrothermal and aqueous-thermal aged samples closely approximated each other, aligning with the outcomes derived from the master curves. To provide a comprehensive comparison of all aging conditions, a CR-CM vs. CR-Fr plot was generated for all Q samples aged for 21 days (Figure (d)). This analysis underscored that hygrothermal conditioning at 85°C represented the most severe aging condition among all.
For T samples, as depicted in Figure , it is evident that as aging progresses, the samples transition towards lower CR-CM and CR-Fr values. For instance, in Figure (a), after one day of aging at 60°C, the aqueous-thermal sample exhibits the least aging when compared to the hygrothermal and thermo-oxidative counterparts. However, after 7 days of aging, the aqueous-thermal sample falls between the hygrothermal and thermo-oxidative samples in terms of aging. Moreover, the reduction in CR-CM and CR-Fr values varies over time. For instance, 7-day and 14-day thermo-oxidative samples differ primarily in their CR-Fr values, while 7-day and 14-day aqueous-thermal samples differ mainly in their CR-CM values. After 21 days of aging at 60°C, thermo-oxidatively aged samples displayed the most severe aging condition.
At 70°C, aqueous-thermally aged T samples of 1, 7, and 14 days exhibit more pronounced aging than their thermo-oxidative and hygrothermal counterparts (Figure (b)). This observation is reflected in the master curves as well. However, the 21-day aqueous-thermal aging samples show less aging compared to thermo-oxidatively and hygrothermally aged samples. Moving to 85°C in Figure (c), with increasing aging duration, CR-Fr values of hygrothermal aged samples decrease more significantly compared to thermo-oxidative samples. The samples subjected to thermo-oxidative aging exhibit lower CR-Fr values than their aqueous-thermal counterparts. CR-CM values remain within a similar range across these conditions. Notably, the 21-day hygrothermal aged T sample at 85°C displays the highest degree of aging.
In Figure (d), all the 21-day aged T samples from all three temperatures are plotted. Interestingly, for aqueous-thermal aged samples, considering standard deviations, temperature does not significantly change the long-term aging of the samples. Whereas for thermo-oxidative samples, CR-Fr values serve as discriminative factors and showed that conditioning at 85°C significantly age the samples. Hygrothermal aged samples rely on both CR-CM and CR-Fr values for their positioning and differences between temperatures are more obvious.
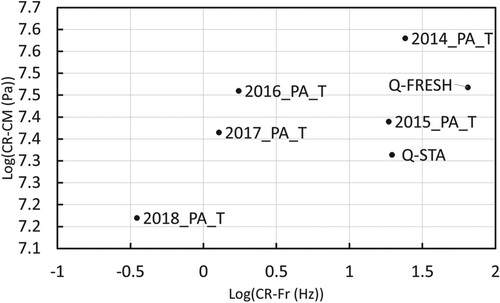
Figure illustrates the CR-CM vs. CR-Fr plot for the field samples. A noticeable observation is that similar to the master curves plots, the samples from 2014 and 2015 located close to the fresh and short-term aged samples, while those from 2016, 2017, and 2018 exhibit a trend towards lower CR-CM and CR-Fr values. The sample from 2016 exhibits higher CR-CM values, indicating lower aging compared to the 2015 sample. This trend is also observed in the carbonyl index. However, when examining the master curve, sulfoxide index, and CR-Fr, higher aging is apparent for the 2016 samples. The characterisation of these samples is inconclusive, possibly due to the complexity of field sampling. It is noteworthy that the carbonyl index and CR-CM value display similar aging behaviour. In summary, the more extended the field aging duration, the lower the CR-CM and CR-Fr values tend to become.
Figure 13. Crossover complex modulus versus crossover frequency of field aged samples of 2014–2018.
In conclusion, for both T and Q samples, the 21-day hygrothermally aged samples at 85°C exhibit the most significant degree of aging. In terms of master curves, the low frequencies of the phase angle curve prove to be the most informative for all conditions of both laboratory and field and both types of binder. However, the significance of CR-CM and CR-Fr values in identifying aging patterns and severity varies based on binder type and specific aging conditions. Significantly, both values undergo changes throughout the aging process in the field. Therefore, it is recommended to incorporate both CR-CM and CR-Fr in the rheological analysis of aged samples to ensure a comprehensive assessment without any loss of information.
Hierarchical clustering analysis
Both chemical information from FTIR and rheological data from DSR are essential for drawing conclusions and making comparisons between laboratory and field samples. However, to visualise the relative positions of all samples and identify the most similar ones, a four-dimensional plot would be required, which can be challenging to interpret. Multivariate techniques provide a solution to this problem.
Examining the dendrogram in Figure from the top, it becomes apparent that there are two primary clades (I and II). The first clade (I) comprises fresh and short-term aged samples, along with field samples from 2014 and 2015. Meanwhile, the second clade (II) includes samples exhibiting greater aging, as indicated by FTIR and DSR measurements, including field samples from 2016 to 2018 and other samples subjected to extended long-term aging.
Figure 14. Hierarchical clustering analysis of all laboratory-aged samples in combination with field aged samples from 2014 to 2018.
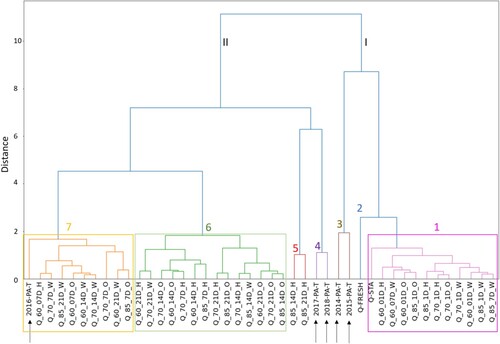
Within the right clade (I), a further division yields three distinct groups: one for fresh sample (2, blue group), another for field samples from 2014 and 2015 (3, brown group), and one contains short-term aged and other samples (1, pink group). Starting from the first cluster (pink), the 1-day aged samples at all three temperatures (Q_60/70/85_1D_W) and 7-day aged samples at 60°C and 85°C under aqueous-thermal conditioning (Q_60/85_7D_W) share a proximity due to their relatively brief exposure to conditioning, aligning them closely with the short-term aged sample. This finding matches with the FTIR and DSR properties discussed in earlier sections. The different clustering of 7-day aqueous-thermal aged sample at 70°C could be attributed to its lower CR-Fr and CR-CM values compared to Q_60/85_7D_W samples. Furthermore, the master curve of this sample is distinctly positioned, as discussed in the DSR results section, although the FTIR indices do not indicate a different aging pattern.
The outcomes derived from the FTIR and DSR analyses have already indicated that the duration of aging significantly influences bitumen aging, with aqueous-thermal conditioning exerting a comparatively weaker impact compared to hygrothermal and thermo-oxidative aging. Consequently, when subjecting samples to short durations and aqueous-thermal conditioning simultaneously, we anticipate a limited aging impact. Hence, it is reasonable to categorise samples subjected to these conditions into clade I, alongside fresh and short-term aged samples.
Within the left clade (II), there is another division, creating four subgroups. The field samples from 2017 and 2018 (4, purple group) are closely grouped with samples of two and three weeks of hygrothermal aging at 85°C (Q_85_21/14D-H) (5, red group), signifying a higher degree of similarity between these samples compared to others. The inclusion of samples subjected to hygrothermal aging at 85°C for two and three weeks (Q_85_21/14D-H) within the same cluster supports the notion that these two samples have undergone a comparable aging process. This aligns with the conclusions drawn from FTIR and DSR analyses. It further indicates that the aging reaction during two weeks of hygrothermal aging at 85°C may have reached a plateau, and an additional week (three weeks in total) does not result in a significant alteration in the aging condition to the extent of placing them in a distinct cluster.
The last two clades (7 – orange and 6 – green groups) on the left encompass samples aged somewhere between the short-term aged sample and those aged for 3 or 4 years in the field. The elevated placement of the green group implies that these samples have experienced a more intense aging condition when compared to the orange group samples. This positioning also indicates a closer association with the red (5) and purple (4) groups, suggesting a higher degree of aging. For instance, the green group contains samples subjected to two or three weeks of thermo-oxidative or hygrothermal aging at 60°C (Q_60_14/21D_H/O), while the orange category consists of samples aged for one week under thermo-oxidative or hygrothermal conditions at 60°C (Q_60_7D_H/O), aligning with the notion that longer aging periods lead to increased aging.
After examining the logical clustering of the samples based on the information acquired from the FTIR and DSR sections, additional insights can be derived from the HCA dendrogram. The dendrogram facilitates the straightforward evaluation of the proximity of conditions, which would be unfeasible without HCA, as it necessitates a four-dimensional plot to detect the closeness of each condition.
It is crucial to emphasise that grouping different conditions should not imply their equivalence; rather, their proximity in aging impact can be subjected to analysis. Since the 60°C – aged samples for 7 days in both hygrothermal and thermo-oxidative conditions (Q_60_7D_H/O) are grouped with aqueous-thermal samples for 14 and 21 days (Q_60_14/21D_W), and the 85°C – aged aqueous-thermal samples for 21 days (Q_85_21D_W) are grouped with 7-day thermo-oxidative samples (Q_85_7D_O), and the 70°C – aged thermo-oxidative sample for 7 days (Q_70_7D_O) is grouped with aqueous-thermal samples for 14 days (Q_70_14D_W), it can be inferred that under constant temperature conditions, the aging process of aqueous-thermal aged samples requires two to three times longer to reach the same level of aging as thermo-oxidative or hygrothermal aged samples. Moreover, the orange group (group 7) includes thermo-oxidatively aged samples for 7 days at all three temperatures (60°C, 70°C, and 85°C), indicating that variations in temperature for one week of thermo-oxidative aging probably have a marginal effect on the aging impact on the Q binder compared to variation in the aging time. Aqueous-thermal samples aged for 14 and 21 days at 60°C are clustered within the orange group, while samples of the same condition but with shorter durations, 1 and 7 days, are found in the pink group, highlighting the influence of aging duration.
Remarkably, the aqueous-thermal sample aged for 21 days at 85°C (Q_85_21D_W) is positioned within the orange group, whereas sample aged under the same conditions but for 14 days (Q_85_14D_W) is placed in the green group (a more aged cluster). This aligns with expectations, as the FTIR indices values of the 21-day aged sample were lower than those of the 14-day aged sample. Last but not least, the aqueous-thermal sample aged for 7 and 14 days at 70°C clusters together in the orange group. In contrast, samples aged under the same conditions but for 1 d or 21 days are grouped in the pink (1) and green (6) clusters, respectively. This clustering aligns with observations made by comparing the FTIR and crossover values of these samples, showing close values for the 7 and 14 days aged samples. The 2-year field-aged sample aligns with the orange group, signifying similarities with samples in this cluster.
In the green group (6), samples aged for 14 and 21 days under hygrothermal and thermo-oxidative conditions at 60°C or 70°C (Q_60_14/21D_O/H, Q_70_14/21D_O/H) coexist, indicating that hygrothermal and thermo-oxidative aging at these temperatures induces similar aging effects, though not identical. However, this cluster exclusively encompasses samples aged in thermo-oxidative conditions at 85°C for 14 or 21 days (Q_85_14/21_O), while hygrothermal aged samples of the same temperature and duration cluster separately in the red group (5). Additionally, hygrothermal aged samples for 7 days at 85°C and 70°C (Q_70/85_7D_H) are present in this group. These observations collectively emphasise that the distinction between hygrothermal and thermo-oxidative aging becomes significant when the temperature is high, and the aging duration is long. Conversely, at lower temperatures and shorter durations, although differences exist, they are considered within the same group. Lastly, aqueous-thermal samples aged at 85°C and 70°C for 14 and 21 days, respectively (Q_70_21D_W, Q_85_14D_W), are clustered in the green group. Based on FTIR and DSR results, these two samples exhibit higher levels of aging compared to other aqueous-thermal samples, placing them in the orange group.
The objective of this investigation was to assess various laboratory aging conditions in relation to field aging, with the aim of identifying the most closely resembling condition to field aging, rather than employing aggressive and short acceleration protocols. The methodology involved longer durations and lower temperatures, aligning with a more realistic aging approach capable of replicating field conditions more accurately. To achieve this goal, the application of HCA proved invaluable in assessing sample distances, considering both chemistry and rheology. The key finding is that hygrothermal aging at 85°C for 14 or 21 days can closely simulate the aging observed after 3–4 years of field exposure, outperforming other conditions.
Conclusion
This study investigated the aging of two types of 1 mm binder films under various conditions, i.e. hygrothermal, aqueous-thermal, and thermo-oxidative at different temperatures (60°C, 70°C, 85°C).
As revealed by FTIR analysis, binder types from different sources exhibit variable sensitivity to aging conditions, including temperature, time, water, and humidity.
The FTIR results showed that the highest aging occurred during hygrothermal aging, followed by thermo-oxidative aging, and aqueous-thermal aging resulting in the lowest values. Furthermore, extended aging durations led to increased aging effects. However, the complex nature of bitumen samples results in specific points where lower indices are obtained with prolonged aging.
The presence of a water layer during aqueous-thermal aging acted as a barrier to oxygen diffusion, hindering oxidative reactions in binder films. Furthermore, the temperature factor alone does not play a significant role in bitumen aging; rather, the crucial factor is the interplay between temperature and accessible oxygen. Consequently, the solubility of oxygen in water emerges as a key determinant for aqueous-thermal aging.
Elevated temperatures and humidity during hygrothermal aging intensified binder aging, even with the same aging duration, attributed to reduced viscosity facilitating increased oxygen diffusion and oxidation reactions. Additionally, elevating the temperature results in an increase of the average kinetic energy of the molecules. This increase leads to a higher number of collisions possessing sufficient energy, thereby promoting more successful collisions conducive to the formation of reactive species that are probably more effective for aging.
The informative aspects about the distinction in aging conditions are primarily observed in the low-frequency section of the master curves and crossover values. Based on these rheological properties, advanced aging is evident in hygrothermal aging, high temperatures, and prolonged aging periods. However, variations in aging patterns may occur based on specific conditions and types of binders.
The study emphasised the importance of considering both CR-CM and CR-Fr values for a comprehensive rheological analysis of aged binder, as their significance varied with binder type and specific aging conditions.
From the field data analysis, it was understood that substantial increases in the characterisation values of field samples may require durations exceeding one year for observation.
Hierarchical Cluster Analysis (HCA) proved valuable in considering chemical and rheological information simultaneously.
Hierarchical Cluster Analysis (HCA) revealed that, among the studied conditions, hygrothermal aging at 85°C for 14 or 21 days closely mimics the aging observed after 3–4 years of field exposure more than the other investigated conditions.
This study has certain limitations that should be acknowledged. Firstly, it's important to note that the variation resulting from the aging gradient was not taken into consideration, as the samples were mixed after aging. Future studies may focus on examining the aging gradient. Additionally, the exploration of the impact of varying levels of humidity is constrained, as this study focuses on a specific humidity level without comparing high and low relative humidity effects. Another limitation is the omission of UV light from the aging protocol, despite its energy potential to break down molecules and alter reaction pathways. Furthermore, enhancing the analysis through more extensive multivariate approaches to establish correlations between properties and develop predictive models for field aging could be considered as potential avenues for future research. In future research endeavours, it is recommended to conduct kinetic analyses to elucidate the underlying factors behind the distinct trends observed during aging at 70°C. Additionally, investigating the impact of water-humidity cycles holds significance, as it closely resembles real-world field conditions. Furthermore, exploring the combined effects of water-humidity cycles and reactive oxygen species on the aging of binder samples would be an interesting way towards understanding material degradation under interacting environmental conditions.
Acknowledgements
This paper/article is created under the research programme Knowledge-based Pavement Engineering (KPE). KPE is a cooperation between Rijkswaterstaat, TNO and TU Delft in which scientific and applied knowledge is gained about asphalt pavements and which contributes to the aim of Rijkswaterstaat to be completely climate neutral and to work according to the circular principle by 2030. The opinions expressed in this paper is solely from the authors.
Disclosure statement
No potential conflict of interest was reported by the author(s).
Additional information
Funding
References
- Airey, G. D. (2003). State of the art report on ageing test methods for bituminous pavement materials. International Journal of Pavement Engineering, 4(3), 165–176. https://doi.org/10.1080/1029843042000198568
- Airey, G., Grenfell, J., Apeagyei, A., Subhy, A., & Lo Presti, D. (2016). Time dependent viscoelastic rheological response of pure, modified and synthetic bituminous binders. Mechanics of Time-Dependent Materials, 20(3), 455–480. https://doi.org/10.1007/s11043-016-9295-y
- Airey, G. D., & Rahimzadeh, B. (2004). Combined bituminous binder and mixture linear rheological properties. Construction and Building Materials, 18(7), 535–548. https://doi.org/10.1016/j.conbuildmat.2004.04.008
- Anderson, D. A., Christensen, D. W., Bahia, H. U., Dongre, R., Sharma, M., Antle, C. E., & Button, J. (1994). Binder characterization and evaluation, volume 3: Physical characterization. Strategic Highway Research Program, National Research Council.
- Besamusca, J., Volkers, A., Water, v. d. J., & Gaarkeuken, B. (2012). Simulating ageing of EN 12591 70/100 bitumen at laboratory conditioning compared to porous asphalt. 5th Eurasphalt and Eurobitume congress, Istanbul.
- Bitumen, S. (1995). The shell bitumen industrial handbook. Thomas Telford.
- Brereton, R. (2015). Pattern recognition in chemometrics. Chemometrics and Intelligent Laboratory Systems, 149, 90–96. https://doi.org/10.1016/j.chemolab.2015.06.012
- Bulatović, V. O., Rek, V., & Marković, K. J. (2014). Effect of polymer modifiers on the properties of bitumen. Journal of Elastomers & Plastics, 46(5), 448–469. https://doi.org/10.1177/0095244312469964
- EN, C.12607-1. (2014). Bitumen and bituminous binders—determination of the resistance to hardening under influence of heat and Air—part 1: RTFOT method. European Committee for Standardization.
- EN, C.14769. (2012). Bitumen and bituminous binders—accelerated long-term ageing conditioning by a pressure ageing vessel (PAV). European Committee for Standardization.
- Erskine, J., Hesp, S., & Kaveh, F. (2012). Another look at accelerated aging of asphalt cements in the pressure aging vessel. Proceedings, fifth Eurasphalt and Eurobitumen congress, Istanbul.
- Guduru, G., & Kuna, K. K. (2022). Classification of Reclaimed Asphalt Pavement (RAP) material using simple indicative tests. Construction and Building Materials, 328, 127075. https://doi.org/10.1016/j.conbuildmat.2022.127075
- Guduru, G., & Kuna, K. (2023). Allowable limits for Reclaimed Asphalt Pavement (RAP) content in hot mix asphalt using simple indicative tests. Materials and Structures, 56(2), 27. https://doi.org/10.1617/s11527-023-02112-0
- Hofer, K., Mirwald, J., Maschauer, D., Grothe, H., & Hofko, B. (2022). Influence of selected reactive oxygen species on the long-term aging of bitumen. Materials and Structures, 55(5), 133. https://doi.org/10.1617/s11527-022-01981-1
- Hofer, K., Werkovits, S., Schönauer, P., Mirwald, J., Grothe, H., & Hofko, B. (2023). Chemical and mechanical analysis of field and laboratory aged bitumen. Road Materials and Pavement Design, 24(sup1), 160–175. https://doi.org/10.1080/14680629.2023.2180297
- Hofko, B., Alavi, M. Z., Grothe, H., Jones, D., & Harvey, J. (2017). Repeatability and sensitivity of FTIR ATR spectral analysis methods for bituminous binders. Materials and Structures, 50(1), 1–15. https://doi.org/10.1617/s11527-016-0885-6
- Hofko, B., & Hospodka, M. (2016). Rolling thin film oven test and pressure aging vessel conditioning parameters: Effect on viscoelastic behavior and binder performance grade. Transportation Research Record: Journal of the Transportation Research Board, 2574(1), 111–116. https://doi.org/10.3141/2574-12
- Jing, R., Varveri, A., Liu, X., Scarpas, A., & Erkens, S. (2019.). Laboratory and field aging effect on bitumen chemistry and rheology in porous asphalt mixture. Transportation Research Record: Journal of the Transportation Research Board, 2673(3), 365–374. https://doi.org/10.1177/0361198119833362
- Jing, R., Varveri, A., Liu, X., Scarpas, A., & Erkens, S. (2020). Rheological, fatigue and relaxation properties of aged bitumen. International Journal of Pavement Engineering, 21(8), 1024–1033. https://doi.org/10.1080/10298436.2019.1654609
- Jing, R., Varveri, A., Liu, X., Scarpas, A., & Erkens, S. (2021a). Ageing effect on chemo-mechanics of bitumen. Road Materials and Pavement Design, 22(5), 1044–1059. https://doi.org/10.1080/14680629.2019.1661275
- Jing, R., Varveri, A., Liu, X., Scarpas, A., & Erkens, S. (2021b). Differences in the ageing behavior of asphalt pavements with porous and stone mastic asphalt mixtures. Transportation Research Record: Journal of the Transportation Research Board, 2675(12), 1138–1149. https://doi.org/10.1177/03611981211032218
- Jing, R., Varveri, A., Liu, X., Scarpas, A., & Erkens, S. (2022). Ageing behavior of porous and dense asphalt mixtures in the field. Proceedings of the RILEM International Symposium on Bituminous Materials: ISBM Lyon 2020 1, Springer.
- Koyun, A., Büchner, J., Wistuba, M. P., & Grothe, H. (2022). Rheological, spectroscopic and microscopic assessment of asphalt binder ageing. Road Materials and Pavement Design, 23(1), 80–97. https://doi.org/10.1080/14680629.2020.1820891
- Lu, X., Isacsson, U., & Ekblad, J. (1999). EVA and EBA polymer modified bitumens. Materials and Structures, 32(2), 131–139. https://doi.org/10.1007/BF02479440
- Lu, X., Talon, Y., & Redelius, P. (2008). 406-001 Aging of bituminous binders–Laboratory tests and field data. In Proceedings of the 4th Eurasphalt Eurobitume Congress.
- Ma, L., Varveri, A., Jing, R., & Erkens, S. (2023). Chemical characterisation of bitumen type and ageing state based on FTIR spectroscopy and discriminant analysis integrated with variable selection methods. Road Materials and Pavement Design, 24(Sup. 1), 506–520. https://doi.org/10.1080/14680629.2023.2278150.
- McIntosh, J. (2008). The ancient Indus Valley: New perspectives, Abc-Clio.
- Mirwald, J., Maschauer, D., Hofko, B., & Grothe, H. (2020). Impact of reactive oxygen species on bitumen aging – The Viennese binder aging method. Construction and Building Materials, 257, 119495. https://doi.org/10.1016/j.conbuildmat.2020.119495
- Nagabhushanarao, S. S., & Vijayakumar, A. (2021). Chemical and rheological characteristics of accelerate aged asphalt binders using rolling thin film oven. Construction and Building Materials, 272, 121995. https://doi.org/10.1016/j.conbuildmat.2020.121995
- Petersen, J. C. (2009). A review of the fundamentals of asphalt oxidation: Chemical, physicochemical, physical property, and durability relationships. Transportation research circular (E-C140).
- Primerano, K., Mirwald, J., Lohninger, J., & Hofko, B. (2023a). Characterization of long-term aged bitumen with FTIR spectroscopy and multivariate analysis methods. Construction and Building Materials, 409, 133956. https://doi.org/10.1016/j.conbuildmat.2023.133956
- Primerano, K., Werkovits, S., Schönauer, P., Mirwald, J., Grothe, H., & Hofko, B. (2023b). Chemical and mechanical analysis of field and laboratory aged bitumen. Road Materials and Pavement Design, 24(sup1), 160–175. https://doi.org/10.1080/14680629.2023.2180297
- Qian, Y., Guo, F., Leng, Z., Zhang, Y., & Yu, H. (2020). Simulation of the field aging of asphalt binders in different reclaimed asphalt pavement (RAP) materials in Hong Kong through laboratory tests. Construction and Building Materials, 265, 120651. https://doi.org/10.1016/j.conbuildmat.2020.120651
- Qin, Q., Schabron, J. F., Boysen, R. B., & Farrar, M. J. (2014). Field aging effect on chemistry and rheology of asphalt binders and rheological predictions for field aging. Fuel, 121, 86–94. https://doi.org/10.1016/j.fuel.2013.12.040
- Read, J., & Whiteoak, D. (2003). The shell bitumen handbook. Thomas Telford.
- Saraf, R., & Patil, S. P. (2014). Study paper on how to read a Dendrogram. International Journal of Computer Applications, 103(6), 8–11. https://doi.org/10.5120/18076-7820
- Scarsella, M., Mastrofini, D., Barré, L., Espinat, D., & Fenistein, D. (1999). Petroleum heavy ends stability: Evolution of residues macrostructure by aging. Energy & Fuels, 13(3), 739–747. https://doi.org/10.1021/ef980238x
- Singhvi, P., Mainieri, J. J. G., Ozer, H., Sharma, B. K., Al-Qadi, I. L., & Morse, K. L. (2022). Impacts of field and laboratory long-term aging on asphalt binders. Transportation Research Record: Journal of the Transportation Research Board, 2676(8), 336–353. https://doi.org/10.1177/03611981221083614
- Siroma, R., Nguyen, M. L., Hornych, P., & Chailleux, E. (2022). A literature review of bitumen aging: From laboratory procedures to field evaluation. Proceedings of the RILEM International Symposium on Bituminous Materials: ISBM Lyon 2020 1, Springer.
- Siroma, R. S., Nguyen, M. L., Hornych, P., Lorino, T., & Chailleux, E. (2021). Clustering aged bitumens through multivariate statistical analyses using phase angle master curve. Road Materials and Pavement Design, 22(sup1), S51–S68. https://doi.org/10.1080/14680629.2021.1907217
- Sreeram, A., Blomdahl, D., Misztal, P., & Bhasin, A. (2022). High resolution chemical fingerprinting and real-time oxidation dynamics of asphalt binders using Vocus Proton Transfer Reaction (PTR-TOF) mass spectrometry. Fuel, 320, 123840. https://doi.org/10.1016/j.fuel.2022.123840
- T315, A. (2012). Standard method of test for determining the rheological properties of asphalt binder using a dynamic shear rheometer (DSR). American Association of State Highway and Transportation Officials.
- Wu, S.-p., Pang, L., Mo, L.-T., Chen, Y.-C., & Zhu, G.-j. (2009). Influence of aging on the evolution of structure, morphology and rheology of base and SBS modified bitumen. Construction and Building Materials, 23(2), 1005–1010. https://doi.org/10.1016/j.conbuildmat.2008.05.004
- Zhang, Y., Liu, X., Apostolidis, P., Gard, W., van de Ven, M., Erkens, S., & Jing, R. (2019). Chemical and rheological evaluation of aged lignin-modified bitumen. Materials, 12(24), 4176. https://doi.org/10.3390/ma12244176