
 ?Mathematical formulae have been encoded as MathML and are displayed in this HTML version using MathJax in order to improve their display. Uncheck the box to turn MathJax off. This feature requires Javascript. Click on a formula to zoom.
ABSTRACT
Since the 1990s, RANS practitioners have observed spontaneous unsteadiness in RANS simulations. Some have suggested deliberately using this as a method of resolving large turbulent structures. However, to date, no one has produced a theoretical justification for this unsteady RANS (URANS) approach. Here, we extend the dynamical system fixed point analysis to create a theoretical model for URANS dynamics. The results are compared to URANS simulations for homogeneous isotropic decaying turbulence. The model shows that URANS can predict incorrect decay rates and that the solution tends towards steady RANS over time. Similar analysis for forced turbulence shows a fixed modelled energy of about 30% of total energy, regardless of the model parameters. The same analysis can be used to show how hybrid type models can begin to address these issues.
1. Introduction
When Reynolds [Citation1] introduced the averaged equations that bear his name, he posited an average that was local over a small area of space or interval of time. Inspired by an analogy to kinetic theory, he assumed that
(1)
(1) which eliminates the cross-stress terms in the averaged equations. For kinetic theory, this is an excellent approximation: there is an extreme scale discrepancy between the mean-free path that characterises molecular motions and the scales of interest in a continuum representation of a flow, at least for most flows of interest. For turbulence, however, which is characterised by the broad spectrum of the energy cascade, and assuming a local space or time average as Reynolds did, this assumption is wrong.
However, there are numerous other averages for which Equation (Equation1(1)
(1) ) does apply, such as a homogeneous spatial average, infinite time average, or ensemble average. Subsequent literature typically speaks of a ‘Reynolds average’, if the averaging operator has the property
(2)
(2) which is a generalisation of Equation (Equation1
(1)
(1) ). Ironically, that makes the local spatial average posited in Reynolds's original paper not a Reynolds average, but as Reynolds assumed Equation (Equation2
(2)
(2) ) in analogy with kinetic theory, where it does hold due to the extreme scale separation present, the equations derived in Reynolds's paper are consistent with a Reynolds average so defined.
It is evident that averages of this kind are expected to remove all turbulent scales of motion, including the very largest eddies. The earliest attempts to close these equations, such as Taylor [Citation2], Prandtl [Citation3], assume that the turbulence is characterised by a single set of scales, those corresponding to the largest, energy-containing eddies. This class of models, which comes to be known as RANS (Reynolds-averaged Navier–Stokes), continues to rely on the single scaling assumption. This includes ,
, and Reynolds-stress models (RSM), all of which include one scaling equation which is used to obtain all the remaining unclosed quantities by a dimensional scaling. All the proposed scaling quantities (dissipation, ε, inverse time scale, ω, or length scale, among others) are assumed to be algebraically related.
With the first availability of larger computers in the 1960s, starting with the pioneering work of Smagorinsky [Citation4], Lilly [Citation5], and Deardorff [Citation6], turbulence modelling returned to the idea of a local spatial average over regions significantly smaller than the largest turbulent eddies. This class of methods is called large-eddy simulation (LES). The averaging region is often identified with the computational grid cell. For example Lilly [Citation5] and Deardorff [Citation6] identify the averaging operator used in deriving the LES governing equations with the average over the computational cells used in computing the solution. However, they are mathematically distinct, and this conflation continues to cause confusion.
The RANS literature often derives the averaged equations by invoking a long or infinite-time average, or an ensemble average, whereas LES papers typically formulate the filtered equations in terms of a local spatial filter. This has led to a widespread misunderstanding that the choice of filter used to derive the equations is what distinguishes RANS and LES. However, as Germano [Citation7] points out, by writing the equations in terms of generalised moments, the moment equations are identical for any average, provided it is linear, and commutes with differentiation. So the choice of average used to derive the exact moment equations cannot be what makes one model RANS and another LES. Instead, it must be the choice of model used to close the equations. Indeed, it is obvious that this must be the case, since two authors who derive the equations using different filters, but use the same closure model, will obtain identical results, whereas two authors who derive the equations using the same filter, but choose different closure models, will obtain different results. In other words, the average is implicitly defined by the closure, rather than the opposite. This point is made very clearly by Pope [Citation8] for the specific case of the Smagorinsky model, and what he terms the implied Smagorinsky filter, but the argument generalises to any turbulence model.
In particular, while RANS models rely on the single scaling assumption described above, LES models invoke a cutoff scale that defines the largest scale at which the model acts. This is typically a length scale, and usually is related to the grid scale to assure maximum use of the available resolution without too large a discretisation error.
It has long been known that RANS models can be used to compute time-dependent flows in cases where the model can be considered a homogeneous spatial average, for example, homogeneous isotropic decaying turbulence or the temporal spreading of a mixing layer. For these examples, the RANS equations reduce to ordinary differential equations in the first case and partial-differential equations in time and a single space dimension in the second. Clearly, no turbulent structures are explicitly resolved. Alternatively, one might consider a flow in which the time scale of interest is very long compared to the turbulent time scale, for example, the slow spread of a contaminant plume. In addition, it has been common practice to solve for the time-steady RANS solution to a problem by using a time-dependent code and iterating in time until a steady-state is achieved.
As early as 1985, Celenligil and Mellor [Citation9] observed unsteadiness in the simulation of a backward-facing step using an RSM. Lasher and Taulbee [Citation10], observing a similar unsteady solution, raised theoretical concerns with computing an unsteady solution using a steady model, and pointed out the need for further research. Claus et al. [Citation11] equated the solution of the Navier–Stokes equations using a finite-volume algorithm to solving the box-filtered equations and suggested ‘this permits the use of a turbulence model that is simply a time-dependent form of the commonly used Reynolds-averaged model '. They described this as an LES model, however, their paper gave no indication why they expect a model which was developed and successfully calibrated for steady solutions [Citation12,Citation13] should work as an unsteady subfilter stress model, or even give rise to unsteadiness at all. They applied the model to a forced shear layer; it is unclear to what extent the unsteadiness in the resulting simulations is due to the convective instability versus the forcing. The simulations reproduced some qualitative aspects of the flow, but significant questions remain, including to what extent the results (which are two-dimensional) are still grid dependent.
A series of studies by Rodi et al. [Citation14–16] considered the vortex shedding behind a square cylinder. In their presentation, the average is described as an ensemble- or phase-average, which is closed by a statistical model intended to represent the stochastic turbulent fluctuations, and the mean and periodic components are resolved. Again, without further justification, they adopt as their statistical model several variations of the model [Citation13] and the RSM of Launder et al. [Citation17]. For the
model with wall functions, they found that the emergence of an unsteady solution was dependent on the numerics. In general, they had reasonable agreement with experimental data, although there was some uncertainty associated with how to set certain initial conditions which are not known from experiments.
Similar simulations from Chalmers University considered vortex shedding behind a flameholder [Citation18] and in the wake of a film-cooling slot [Citation19]. They also used the standard model (an algebraic stress model was also used in [Citation19]). For the flameholder without afterbody, they obtained good agreement for the shedding frequency, as well as mean profiles of velocity and turbulent kinetic energy, with the model contributing about 50% of the energy. However, while the experiments demonstrated a change in shedding frequency in the presence of an afterbody, the simulations could not capture this effect [Citation18]. For the film-cooling slot, when the tip-to-slot thickness ratio was small, the resulting calculated flow was steady, and both the
and algebraic-stress models captured the mean profiles well. With a larger tip thickness, the vortex shedding becomes a more important mechanism, and both models produced an unsteady solution, but the agreement with data was much poorer. Durbin [Citation20] looked at the same flameholder geometry as [Citation18] using a
model, and found a good match for the time averaged velocity profiles. However, he also reported good results for time-steady simulations of flow over a backward-facing step and a separated diffuser using the same model, whereas preliminary computations of a square cylinder and a thick splitter plate were unsteady. He attributed unsteadiness to the model representing an ensemble, rather than a time, average, but gave no clear reason why unsteadiness was present for some geometries but not others.
Numerous subsequent researchers have used RANS models to develop unsteady structures deliberately, reporting mixed success. For example, [Citation21] showed URANS was unable to reproduce the back pressure on a cylinder, as compared to detached eddy simulation. For flow behind a cube, [Citation22] reports good agreement for the mean-velocity gradients. The recirculation lengths are much better than steady RANS, but not as good as conventional LES, and the upstream separation length is closer to that for steady RANS. Simulations of a square cylinder with rounded corners [Citation23] showed similar results for URANS and detached-eddy simulation (DES), with both performing much better than simulations without a turbulence model. In a comparison of two- and three-dimensional URANS, [Citation24] indicated that the latter can lead to significant improvements, but results can be dependent in unpredictable ways on the choice of model and spanwise domain size. Other authors who simply identified a conventional RANS model with the solution to a phase-average rather than a time average include [Citation25,Citation26].
Fadai-Ghotbi et al. [Citation27] considered a backward facing step using a standard , LRR-IP, and an elliptic-blending RSM, computing in two dimensions. The
model produced a steady result. For the RSM, the unsteadiness depended on the numerical method and the resolution. For the more dissipative upwind scheme, the solutions were steady for all of the models, whereas, with a central-difference scheme, the two RSMs gave unsteady solutions. However, they observed that the amplitude of the unsteadiness decreased with increasing mesh resolution. They concluded that the unsteadiness was triggered by a numerical instability in the shear layer at the corner. Overall, they found that the shedding frequency was accurately predicted by the URANS, because it is controlled by the linear instabilities of the mean velocity gradient, but the amplitudes were not physical.
Based on a careful study of shedding behind a circular cylinder, Palkin et al. [Citation28] concluded that, for high-Reynolds number industrial flows, URANS using an RSM can be reliably employed. This study used comparisons between LES and RANS using two RANS models, a two-equation elliptical relaxation linear eddy-viscosity model and an RSM, and showed good agreement for the RSM in their higher-Reynolds number case. However, at lower Reynolds number, while shedding frequencies were well predicted, amplitudes were grossly over-predicted. Furthermore, although in presenting the models as closures for the phase-averaged quantities they assumed a large scale-separation between the periodic and stochastic components in the triple-decomposition, their spectra show that this is not the case. Finally, in their conclusions they noted: ‘The success in general is unpredictable … in a sense that it is difficult to know a priori whether the method will return reliable and realistic results in unknown situations'.
A more recent study comparing RANS and hybrid models suggests that many of the discrepancies in the preceding results can be explained in terms of how well the development of Kelvin–Helmholtz rollers in the turbulent shear layer is resolved [Citation29]. Since the disturbance growth can be damped by either the numerics or the modelled dissipation, a full understanding must take into account the numerical method, grid resolution, choice of model, and how the turbulence quantities are initialised.
The results of these and other studies sometimes look promising, but raise numerous questions. First, and most fundamentally, it is not clear why some models, geometries, and initial conditions lead to unsteady solutions, while others relax to a steady solution. Second, the reported results are mixed; some authors showing relatively good agreement with experimental data, and others quite poor. This opens the question whether the more successful comparisons are purely fortuitous. At the very least, our inability to predict, a priori, when the method will work makes it impossible to rely on for engineering prediction. Finally, some quantities are easier to predict than others. Qualitative agreement between visualisations of large-scale features is not surprising, since the mechanisms that support them are often only weakly dependent on Reynolds number.
Spalart [Citation30] and Travin et al. [Citation31] present systematic critiques of what they refer to as the unsteady RANS (URANS) approach. There is some variation in terminology between various authors. Consistent with the definitions above, we will follow the distinction made by Travin et al. [Citation31] that LES refers to a closure model which includes the filter width as a model parameter,Footnote1 whereas RANS does not. We can also distinguish between VLES, which is simply an LES model that resolves a smaller portion of the spectrum than regular LES, and URANS, which is just using a traditional, unmodified RANS model but allowing the solution to become unsteady.Footnote2
Although in widespread use, a physical or mathematical justification for URANS is missing. (‘URANS does not have a rational theoretical background/justification’ [Citation31].) The underlying models typically used were all developed for steady flows, with all scales modelled. The reason why unsteadiness arises in certain cases, and not in others, is not understood, other than a general idea that it is related to how unstable the flow is, and how dissipative is the model. Physical plausibility arguments for URANS seem to require a spectral gap between the large structures and the incoherent turbulent fluctuations, which is not observed in experiment [Citation30,Citation31].
The inability to specify exactly what the URANS solution is supposed to represent makes it impossible to determine if it is correct or not. Several authors have invoked a triple decomposition or a phase average [Citation16,Citation18,Citation27,Citation28]. But this is an ex post facto reinterpretation of models that were originally derived without any accounting for large-scale resolved structures. The models are the same whether the averages in the equations are identified as ensemble averages or phase averages. In other words, there is no formal mathematical justification for interpreting the results this way. Furthermore, Spalart [Citation30] points out that the phase-averaged structure is very different from the typical exact structure, and the resolved field is observed to include ‘incoherent’ motions.
An alternative to URANS is to find a rational procedure for introducing an explicit decomposition parameter into a conventional RANS model. The flow-simulation methodology (FSM [Citation32–34]), partially-averaged Navier–Stokes (PANS [Citation35–37]) and partially-integrated transport model (PITM [Citation38,Citation39]) are all examples of this approach. The emergence of these methods, which can easily be implemented in existing RANS codes, has reduced the prevalence of URANS, but has not completely replaced it.
It is the purely anecdotal experience of this author, speaking with colleagues, that they fall into two camps: one that views URANS as self-evidently an ill-constructed model, and one that sees it as equally self-evidently valid. Neither side sees it necessary to expend much effort trying to either prove or disprove it. This, therefore, is the myth alluded to in the title: that merely by computing with a conventional RANS model in a time dependent fashion, reasonable results can be unambiguously obtained.
Without a better theoretical underpinning for the URANS approach, it will remain in scientific limbo. A clear mathematical framework, on the other hand, can also help us better understand URANS in comparison with the other available modelling approaches. Travin et al. [Citation31] writes, ‘Much work and discussion is needed to determine whether this situation reflects a congenital flaw, or is hiding a “golden opportunity”'. The goal of this paper is to present a first step in that work and discussion.
There are two primary questions to ask about URANS. First, what is the mechanism that gives rise to unsteadiness, and when does it occur? Second, in the absence of a parameter to set the scale for the energy decomposition, where does that scale come from and what value does it take? We will focus on the second question, by considering a simple test problem, and constructing an analytic model of how the energy decomposition evolves.
The test problem chosen is homogeneous isotropic turbulence, both decaying and forced. This problem is not one in which URANS is typically employed and does not exhibit the large coherent structures seen in such geometries as bluff body wakes. In that sense, it is a particularly stringent test case. Nevertheless, it was selected for two reasons. First, it is amenable to an analytic theory which can help guide our intuitive understanding. Second, it represents the extreme in terms of lack of scale separation; if URANS can still work in this case, it should be able to work in cases with dynamically significant large structures.
2. The conventional RANS model
We start by reviewing the conventional RANS model. In the following discussion, we restrict ourselves to the standard model [Citation13], although the same analysis could easily be extended to other RANS models. We decompose the velocity and pressure fields into an averaged and a fluctuating part,
(3a)
(3a)
(3b)
(3b) The governing equations are
(4a)
(4a)
(4b)
(4b)
(4c)
(4c)
(4d)
(4d) The Reynolds stress is defined as
(5)
(5) and modelled with a linear eddy viscosity
(6)
(6) with
(7)
(7) The eddy viscosity is
(8)
(8) and the production of turbulent kinetic energy is
(9)
(9) The over-bar represents an average, which is often taken to be a homogenous spatial average, for problems with one or more homogeneous spatial dimensions, or a time average, for steady problems. For more general problems, it is common to invoke an ensemble average. These averages are often equivalent, assuming ergodicity holds. The turbulent kinetic energy,
(10)
(10) and the dissipation rate,
(11)
(11) are then the energy and dissipation in the scales of motion too small to be resolved in the
velocity field.
In fact, the exact averaged equations, which these equations are a model for, are identical, regardless of which average is invoked. This implies that the average that is obtained from an actual simulation is a consequence of the specific model closure used, and is independent of the average specified by the author, if any. In the case of the model, the average is implied by the modelling assumption that the eddy viscosity can be scaled with a velocity characteristic of the entire turbulent motion,
, and a length scale
as well as the rescalings that go into modelling the dissipation rate. Consistent with our definitions in Section 1, the RANS has no explicit parameter defining a partition of resolved and modelled scales. An alternative closure approach would be to explicitly introduce such a parameter to obtain an LES model. For example, if we impose a length scale for computing the eddy viscosity,
, then the equations are immediately closed without the need for a dissipation rate equation (Equation4d
(4d)
(4d) ), and we recover the one-equation LES model of Schumann [Citation40] and Yoshizawa [Citation41].
Particular care must be given to initial and boundary conditions. Equations (Equation4a(4a)
(4a) ) allow for injecting both a modelled and a resolved component of turbulent fluctuations through the initial and boundary conditions. There is nothing in the equations, however, which ensures that this injection is consistent with the energy decomposition implied by the model. In fact, it is fair to ask whether the possibility of forcing the model in an inconsistent manner constitutes a defect in the model, or just a caveat on how we treat initial and boundary conditions.
Applying Equation (Equation4a(4a)
(4a) ) to homogeneous isotropic decaying turbulence, using the conventional RANS approach, we assume that the average removes all the turbulent scales. Since the flow is statistically homogeneous, all the average quantities are uniform in space, and the equations reduce to ordinary differential equations. To indicate this, we will replace the over-bar with an angle bracket. This could represent a spatial average over all of space, or an ergodically equivalent, suitably constructed, ensemble average. The average velocities are identically zero,
, and the
equations reduce to a set of ordinary differential equations,
(12a)
(12a)
(12b)
(12b) The solution to this problem is well known to be
(13)
(13) where the decay rate is
(14)
(14) For this simple RANS model, the decay rate is a constant. Data from experiments and simulations suggest that this may not be quite right, but for a particular experiment, over a wide range of Reynolds number, it is a reasonable approximation [Citation42,Citation43].
3. Unsteady RANS
We can also try to simulate this problem using a URANS. This means we use the same RANS equations (Equation4
(4a)
(4a) ), but now we include all the unsteady and locally varying terms. For this problem, unsteadiness will not arise spontaneously, so we need to introduce it through the choice of initial conditions. We wish do to so in a way that is consistent with the idea that the initial conditions represent some suitably averaged real turbulent state. Conceptually, we can achieve this by taking a fully resolved turbulent field (perhaps from direct-numerical simulation) and filtering it using any arbitrary low-pass filter characterised by a specified length-scale. Using this filter, we can obtain filtered velocity fields. The turbulence quantities can be obtained using Equations (Equation10
(10)
(10) ) and (Equation11
(11)
(11) ). The initial conditions obtained this way will depend on both the length scale and the filter shape (Gaussian, top-hat, spectral cut-off, etc.). The effect of the shape is likely to be small, but may lead to a short initial transient. Appendix 2 provides additional detail of how this procedure was done in practice.
The governing equations are now
(15a)
(15a)
(15b)
(15b)
(15c)
(15c)
(15d)
(15d) with
(15e)
(15e) and
(15f)
(15f) Note, these equations are formally identical to the RANS equations (Equation4
(4a)
(4a) ), however, we have introduced super- or subscript less-than decorations to various quantities to emphasise that they now represent subfilter quantities. Both the velocities and the turbulence quantities now vary in both time and space.
The bar now represents a local filter, which does not remove all turbulent scales, and the term average, denoted by angle brackets will be reserved for the homogeneous average over the entire box. It is important to note that, as mentioned above, the filter corresponding to a specific model is implicitly defined by the model, and is therefore not known in a closed form that can be used to compute the initial conditions. We will assume that the effect of using slightly different low-pass filters leads to, at most, minimal, short-lived transients as the flow adjusts.
Unlike LES models, which have an explicit cut-off length scale specified, when using a conventional RANS model to try to compute unsteadiness, the model does not include a parameter that controls which scales, or how much of the energy, is to be captured by the model. This makes it difficult to say what constitutes the correct answer. Instead we will focus on two questions. How does the partition of energy between resolved and model scales evolve? And, how well does the URANS predict the overall decay rate? The first question addresses how useful the model is: given that we do not control the energy partition, does it behave in a manner that produces an informative result? The second question is more about correctness. There may not be a clear right answer for each component, resolved and modelled, of the energy, but the total energy should give something like a power-law decay, as observed in experiments, with at most a slowly varying decay rate. In particular, if the energy partition changes, it should do so in a way that does not degrade the solution for the total energy.
To explore these questions, it would be nice if we could reduce Equations (Equation15(15a)
(15a) ) to a set of ordinary differential equations. We could then employ the dynamical systems and fixed point analysis first introduced by Speziale and Mhuiris [Citation44] in the steady RANS context and applied to URANS by Girimaji et al. [Citation35]. In their approach, they omitted the unsteady transport term as not contributing to the global energy balance. We take a slightly different approach and formally average the unsteady equations. To do this, we first introduce the decomposition
where
(16a)
(16a)
(16b)
(16b) are the energy of the subfilter and resolved scales, respectively. This decomposition requires the assumption that
. This can be demonstrated explicitly for certain filters and averages. Similarly, for the dissipation,
(17a)
(17a)
(17b)
(17b)
Taking the average of Equation (Equation15c(15c)
(15c) ) and using homogeneity, the equation for the subfilter energy is exactly
(18)
(18) The equation for the average resolved energy can be derived by multiplying Equation (Equation15b
(15b)
(15b) ) by
, and averaging,
(19)
(19) The subfilter dissipation Equation (Equation15d
(15d)
(15d) ), when averaged, yields
(20)
(20) This is an exact equation for how the subfilter dissipation rate will evolve under the action of the RANS model given by Equation (Equation4a
(4a)
(4a) ). To solve this equation, an additional level of closure modelling is required, since the two averaged terms on the right-hand side are not closed. That is, this equation includes a closure model relative to the bar filter, but still requires closing relative to the bracket filter. The simplest model for Equation (Equation20
(20)
(20) ) is
(21)
(21)
(22)
(22) This is correct to second order in the fluctuations [Citation45]. For the remaining unclosed quantities, we use
(23a)
(23a)
(23b)
(23b) where
is the vorticity. We also decompose the average eddy viscosity as
(24)
(24) Note that Equation (Equation23b
(23b)
(23b) ) is exact, whereas Equation (Equation23a
(23a)
(23a) ) neglects the spatial variation of the eddy viscosity.
We can now close the three equations (Equation18(18)
(18) ), (Equation19
(19)
(19) ) and (Equation20
(20)
(20) ) by adding an evolution equation for filtered enstrophy magnitude,
. To obtain this we start by noting that the dissipation equation (Equation12b
(12b)
(12b) ) is essentially an enstrophy equation,
(25)
(25) If we assume that the dynamics of a URANS simulation can be modelled as a Navier–Stokes simulation with a increased viscosity of
, rather than ν, then a plausible model for the enstrophy of the resolved scales is
(26)
(26) (A similar argument can be found in [Citation8] for deriving an estimate of the filtered spectrum produced by an LES model.)
The coefficient plays the same role for the enstrophy dissipation of the filtered scales as the
plays for the subfilter scales in the original RANS model and is the only parameter of the reduced order model. The parameters
and
are not tunable parameters of the reduced order model, they must be set to whatever values are used in the URANS simulations we are comparing to. For the results presented here, the value used is the standard
parameter setting,
.
The complete set of modelled equations is now
(27a)
(27a)
(27b)
(27b)
(27c)
(27c)
(27d)
(27d) The first thing to note about these equations is that if we sum Equations (Equation27a
(27a)
(27a) ) and (Equation27c
(27c)
(27c) ), we recover the exact total energy Equation (Equation12a
(12a)
(12a) ). (This is, in fact, a property of the exact unclosed equations, so will hold for any closure model.) It is evident that the subfilter production term,
represents the transfer of energy from the resolved to the subfilter scales. As such, it is the primary term which sets the decomposition scale. This point is widely misunderstood and bears emphasis. The decomposition into resolved and subfilter components is not unique, and the partition of energy is set implicitly by the model through the action of
.
Summing Equation (Equation27d(27d)
(27d) ) and viscosity times Equation (Equation27b
(27b)
(27b) ) does not recover the total dissipation equation (Equation12b
(12b)
(12b) ), however. Instead, using Equations (Equation23
(23a)
(23a) ) to eliminate ν and
, we obtain
(28)
(28) If we assume that the corresponding terms play similar roles in the dissipation equations as they do in the kinetic energy equations, then the first two terms represent the dissipation of enstrophy out of the large scales, and into the small scales, and should therefore cancel. The last term should represent the dissipation of small-scale dissipation and should equal the right-hand side of Equation (Equation12b
(12b)
(12b) ). That this is not the case allows our model for the URANS to explore deviations from the RANS power law decay. This is in distinction from the analysis of Girimaji et al. [Citation35], which assumes the total dissipation still obeys Equation (Equation12b
(12b)
(12b) ).
Rather than analysing the full set of Equations (Equation27(27a)
(27a) ), we can construct a reduced order model in terms of the primary quantities of interest. The first of these is the energy partition, defined as
(29a)
(29a) Using the product rule and substituting Equations (Equation27c
(27c)
(27c) ) and (Equation12a
(12a)
(12a) ), we can write an evolution equation for this quantity,
Defining two other reduced-order quantities, the subfilter production to dissipation ratio, and the subfilter Reynolds number,
(29b)
(29b)
(29c)
(29c) and a non-dimensional time
(30)
(30) results in the final equation
(31a)
(31a) Similarly, we can write
and, using Equations (Equation27b
(27b)
(27b) ), (Equation27c
(27c)
(27c) ) and (Equation27d
(27d)
(27d) ), obtain
(31b)
(31b) Finally, for R, we have
Again, using Equations (Equation27c
(27c)
(27c) ) and (Equation27d
(27d)
(27d) ), yields
(31c)
(31c)
The energy partition, f, is the ratio of the subfiliter energy to the total energy. It represents the fraction of the energy spectrum which is being modelled. In the limit f = 1, the simulation is effectively a conventional RANS, with all scales modelled. The other limit, f = 0, is a DNS, with no model contribution. The variable g is the ratio of the subfilter production to the subfilter dissipation, that is, the rate at which energy is moving from resolved to modelled scales divided by the rate in which modelled scale energy is being dissipated by viscosity. Finally, R, although it can be written in a form reminiscent of the turbulent Reynolds number of the subfilter scales, is probably best understood as the normalised eddy viscosity due to the subfilter scales. That is, R is the contribution to the total effective viscosity due to the modelled scales.
This model has a singularity when the subfilter Reynolds number goes to zero, but for even moderate Reynolds number, the singular term is negligible, and the f and g equations evolve independently of R. We can better understand the behaviour of R by noting that
where the turbulent Reynolds number is defined as
(32)
(32) Therefore the singular term behaves as
This term will blow up in two situations. The first is when
, that is, when the turbulence is almost completely dissipated. We can neglect this case as uninteresting to our current investigation. The second is when
, which is the DNS limit, when the flow is almost completely resolved. For this latter situation, for this term to be
, we must have
. This case can also be ignored, since if f was that small, we would just run DNS instead of URANS. Consequently, the reduced-order model can be well approximated as
(33a)
(33a)
(33b)
(33b) The same equations can be obtained directly by neglecting the viscous dissipation in the resolved scales,
, in Equation (Equation27a
(27a)
(27a) ).
This model has four fixed points,
(34a)
(34a)
(34b)
(34b)
(34c)
(34c)
(34d)
(34d) The last one is an attractor that governs the behaviour of the system. As can be seen in Figure , all trajectories tend towards this fixed point, which is very near the RANS limit.
Figure 1. Phase space evolution of Equation (Equation33a(33a)
(33a) ). The grey trajectories are the reduced order model, with the fixed points in black. Red lines are trajectories from simulation data (with points indicating the beginning of each trajectory). The green shaded region is where n = 1.15−1.45. The dashed curve is Equation (EquationA12
(A12)
(A12) ).
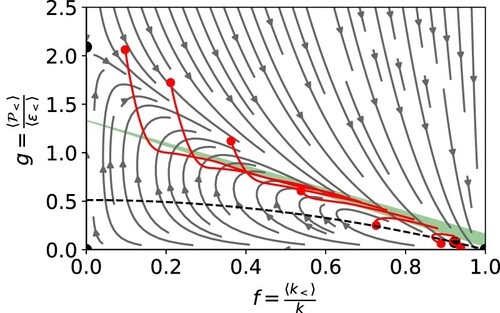
For comparison, Figure also shows several real trajectories from numerical experiments, in red. To obtain these, a fully resolved DNS simulation for forced homogeneous turbulence was run until it reached equilibrium. The velocity fields obtained were filtered (as described above) to obtain initial conditions for the URANS. Each trajectory was created using a different filter width to generate the initial condition. The trajectory was then computed using a URANS. Details of the simulations can be found Appendix 2.
What the figure clearly shows is that, regardless of the initial condition, the URANS evolves towards something very like a steady RANS, with the resolved fluctuations decaying away. The model suggests that the URANS will not go all the way to the RANS limit of f = 1, however, the data is not sufficient to determine if this is the case. What is clear is that the user has no control over the range of scales which are physically resolved. However, it should be noted that the rate at which the URANS relaxes towards RANS is extremely slow in turbulence time scales, which may be one reason why some URANS practitioners are left with the impression that the initial choice of energy partition persists.
Having considered the evolution of the energy partition, we now examine the decay rate of the total turbulent kinetic energy. For a flow in which the decay rate may be changing, there are several ways to measure this [Citation46]. We choose
(35)
(35) which has the advantage that it can be computed from Equations (Equation27
(27a)
(27a) ) in terms of our reduced order model,
(36)
(36) On our trajectory plot, curves of constant n are straight lines through the point f = 0,
. The green shaded region in Figure is where the decay matches the observed range of experimental data, n = 1.15−1.45.
It is clear that the shaded region, where the decay rate matches experiment, occupies only a small fraction of phase space. Whether this is a problem for the URANS approach in practice depends largely on how much time the URANS spends outside this small region. The plotted trajectories suggest that the URANS does evolve to this region, given sufficient time. Another question might be, where do typical initial conditions fall relative to this region. For example, given a local spatial filter, characterised by a cutoff length-scale, we could filter DNS data at various cutoffs, to obtain an initial condition for each one. Each initial condition would define one point in phase space, and the points for all possible filter widths would define a curve. We can approximate that curve using a stick-spectrum analysis, to obtain the dashed curve, Equation (EquationA12(A12)
(A12) ), shown in Figure . (The details of the derivation are given in Appendix 1). From this analysis, it appears that the initial conditions thus produced fall well below the shaded region, meaning there will be a significant adjustment before the correct energy decay rate is observed. The red trajectories, on the other hand, start well above (at least for small f), the difference probably being a result of the specific way they are generated, starting with a forced turbulence and only later being allowed to decay, as described in Appendix 2.
An interesting feature of the reduced-order model is that if we use Equations (Equation34d(34d)
(34d) ) and (Equation36
(36)
(36) ) to compute the decay rate at the fixed point, we get
(37)
(37) In other words, the decay rate is independent of the underlying RANS model, and is a function of the dynamics of the resolved scales alone. The model coefficient we chose predicts a decay rate of
, noticeably lower than might be expected from experiments. However, from Equation (Equation36
(36)
(36) ) we see that changing
does not actually change the decay rate at any point in phase space, rather it moves the fixed point itself. In fact, lowering
much beyond the value adopted here moves the fixed point outside of the allowable range
, so that the f = 1 fixed point becomes the attractor.
A similar factor explains why we cannot adjust the model to lower the fixed point on the upper-left, to try to improve the fit. The location of this point is controlled by the URANS model coefficients , which are not adjustable parameters of the reduced-order model, and must be set to match the coefficients settings used in the URANS we are comparing to.
Another way we can assess the accuracy of the model is to compare the measured growth rate in the simulations to the model prediction using Equation (Equation36(36)
(36) ) with f and g computed from the simulation data. This is shown in Figure . If the model was perfect, all the data would fall on the dashed line. As is clear from the plot, the agreement improves as the initial value of f increases. For the two trajectories with the lowest initial f, there are two distinct regions. The first, corresponding to the initial descent in Figure , shows a linear relationship, but with a significantly different slope, whereas once the trajectory enters the green shaded region in Figure , the measured decay rate is about 30% high. This indicates that the reduced-order model performs worse in the region above the green shaded region, which is not surprising, as this is where the URANS deviates the most from physically realistic behaviour.
Figure 2. The measured decay rate compared versus the decay rate predicted by the model (Equation Equation36(36)
(36) ) for the URANS simulations [Citation47] shown by the trajectories in Figure . The cases correspond to larger initial f in the direction of the arrow.
![Figure 2. The measured decay rate compared versus the decay rate predicted by the model (Equation Equation36(36) n=fCε2<−Cε1<g−f.(36) ) for the URANS simulations [Citation47] shown by the trajectories in Figure 1. The cases correspond to larger initial f in the direction of the arrow.](/cms/asset/6a076fd3-013b-414a-9578-fdde272081d8/tjot_a_2225140_f0002_oc.jpg)
Overall, the reduced order model Equations (Equation33(33a)
(33a) ) gives us a good feel for the dynamics of the URANS. We can see that the solution can deviate substantially from the correct decay rate as it evolves. However, there appears to be a preferred trajectory, a roughly straight path between two of the fixed points (on the upper left and lower right in Figure ), along the lower portion of which the decay rate is close to the experimental values. This may give a false sense that the URANS approach is correct. At least from the reduced-order model, it appears that the preferred trajectory is not aligned with a contour of constant decay rate, although the full simulation trajectories are less clear.
4. Forced turbulence
Decaying turbulence is arguably not analogous to problems, such as bluff body wakes, in which unsteadiness arises spontaneously in URANS. It is more similar to problems where the initial condition includes a resolved perturbation or geometric feature that creates an initial large-scale structure which decays over long times, such as [Citation48,Citation49]. For the wake, where the flow is globally unstable, the instability acts as a kind of forcing term which sustains the unsteadiness in the URANS solution. The equivalent mechanism for homogeneous turbulence would be forced turbulence, which we consider in this section.
Consider a DNS of homogeneous isotropic turbulence generated by a large-scale forcing. The flow evolves under a statistically stationary stochastic forcing until statistical equilibrium is reached. At this point, as for the decaying problem, the flow is decomposed into resolved and subfilter quantities using a specified cutoff length scale. The problem is then restarted, using the URANS equations, initialised with the resolved and modelled fields, and the evolution is continued with the same forcing. This is again repeated with a series of different cutoffs.
To model this problem, we will make the following assumptions. First, that the forcing is entirely in the resolved component, regardless of the cutoff length scale. Second, that the flow remains in equilibrium, so that we can assume that the forcing is always balanced by the dissipation, . Finally, that the forcing does not directly affect the dissipation or enstrophy. In that case, Equations (Equation27b
(27b)
(27b) ), (Equation27c
(27c)
(27c) ) and (Equation27d
(27d)
(27d) ) remain unchanged, however, Equation (Equation27a
(27a)
(27a) ) becomes
and
The reduced-order model for the forced case is, therefore
(38)
(38) and the g equation is still Equation (Equation31b
(31b)
(31b) ). The fixed points are
(39a)
(39a)
(39b)
(39b)
(39c)
(39c) With the standard
coefficients, this results in an attracting fixed point at g = 1 and
, as can be seen in Figure .
Figure 3. Phase space evolution for homogeneous forced turbulence (Equations Equation38(38)
(38) and Equation31b
(31b)
(31b) ). The grey trajectories are the reduced order model, with the fixed points in black.
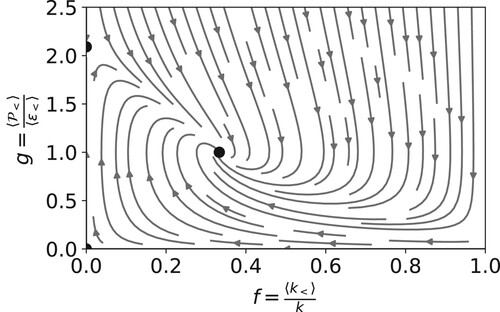
Unlike the unforced case, the energy partition does not trend towards a steady RANS solution in the forced case. Instead, the forcing acts as a continuous source of resolved scale energy. The fixed point represents the balance between the dissipation of resolved scale motion due to the model and the production of resolved scale motion due to the forcing. A value of g = 1 at the fixed point means that the energy input due to forcing is the same as the transfer (production) between resolved and subfilter scales, which is the same as the subfilter dissipation, that is, a classic cascade process. The fixed points we obtain are different from those in [Citation35] because we do not assume that the total dissipation rate follows the steady RANS equation, as we describe above.
5. Implications for RANS-based hybrid models
The fundamental problem with the URANS approach is that, regardless of how the simulation is initialised, conventional RANS model equations are designed to account for all the turbulent scales of motion. When used to simulate only a range of scales, the dynamics of the solution fundamentally disagrees with the modelling assumptions. To fix this problem, there exists a class of hybrid turbulence models which, through various mathematical procedures, attempt to rescale the subfilter quantities in the RANS equations to properly account for the partition between resolved and modelled scales. These include the flow-simulation methodology (FSM) [Citation32,Citation34], partially averaged Navier–Stokes (PANS) [Citation35,Citation36], and the partially integrated transport model (PITM) [Citation39]. The reduced-order model approach from the previous section is easily extended to these hybrid models. In fact, for models where the only change is a modification to the model coefficients, the reduced-order model (Equation31a(31a)
(31a) ) still applies, it only needs to be replotted with the appropriate coefficient values.
To demonstrate this, we consider the PANS model. In the PANS approach, the coefficient is replaced with a rescaled version,
(40)
(40)
is a model parameter that is supposed to set the ratio of the modelled to total energy. This is distinguished from f, which is the actual ratio achieved by the simulation. In other words,
is an input to the model and f is a diagnostic; if the PANS model worked exactly as intended,
and f would be equal.
Figure shows the trajectory maps for the PANS model with four different values of . The fixed points move depending on
, and the behaviour is as desired: as
decreases, the value of f at the attracting fixed point also decreases. We can substitute
from Equation (Equation40
(40)
(40) ) for
in the expression for the reduced-order model fixed point value of f, Equation (Equation34d
(34d)
(34d) ), to obtain an analytic relationship between
and f at the fixed point,
(41)
(41) For the standard values of the model coefficients, this is approximately
, which is very close to the desired equality. Note also, that from Equation (Equation37
(37)
(37) ), the growth rate at the fixed point is independent of
.
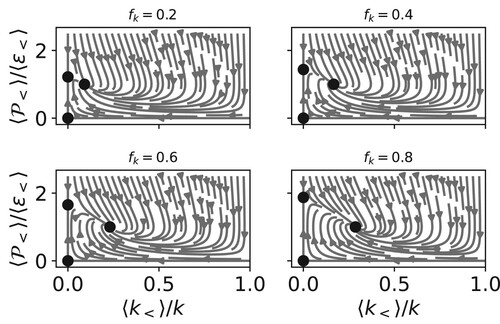
We can conduct the same experiment for the forced case. In this case, we do not expect the result to relax to a steady solution in the limit of , since the underlying RANS model does not do so. Instead, the level of unsteadiness is restricted to range of
, as can be seen in Figure .
Figure 4. Phase space evolution of unforced PANS with different values of . From top left,
.
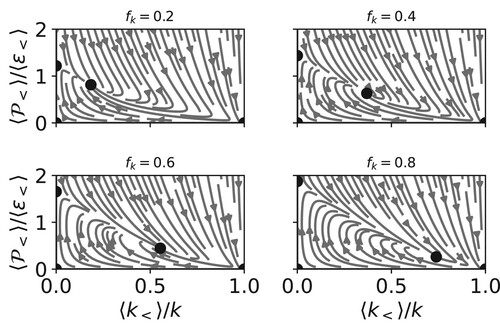
Figure 5. Phase space evolution for forced PANS with different values of . From top left,
.
In other words, for the unforced case, the PANS model does exactly what it is designed to do. Unlike URANS, where the limiting behaviour relaxes to a conventional RANS, the PANS model tends towards a value of f very close to the value of the input parameter . Nevertheless, it is important to be aware that the PANS model also can have significant deviations from the fixed point, particularly if the initial condition is not chosen so that both f and g are at the fixed point value for the specified
. For the forced case, the relationship between the input
and the observed f is more complex. Obviously, the PANS model cannot enforce a steady result at the
limit if the underlying RANS model cannot.
6. Conclusion
Conventional RANS models were developed using a single-scale assumption. Such closures are only justified where any resolved unsteadiness exhibits a ‘spectral gap ', or, equivalently, the large scales, such as the total turbulent kinetic energy and the integral length scale, completely characterise the turbulence. Even for problems with large unsteady turbulent structures, these models were designed to produce the correct solution for the time mean, when solved for the steady-state solution (i.e. when the time-derivative terms are set to zero). Proponents of the URANS approach have not produced a rigorous justification as to why these models sometimes give rise to unsteady solutions if allowed to evolve in time, nor what precisely those unsteady solutions represent. Without clearly identifying what the models should do, it is hard to say definitely whether the results they do produce are correct or not, or even what would be the correct way to employ them.
One key limitation in our understanding is that existing research into URANS consists of case studies. Even very careful analysis can lead to uncertain, and even contradictory, conclusions, given the enormous parameter space of all potential applications of URANS. What has been missing is a theoretical framework for understanding what URANS actually does. This paper presents a first step in that direction.
The proposed model can be viewed as an extension of earlier fixed point analyses. The power of the approach lies in viewing the evolution of the URANS simulation as a dynamical system, with the phase space dynamics giving insight into the global behaviour of the model. The purpose of the model is not to be an accurate predictive tool, but rather to reproduce the qualitative behaviours we expect to see in URANS simulations. Comparisons to actual simulation data indicate that the model does just that.
Without a clear metric for correctness, it is impossible to say definitively that URANS is wrong, but these results show that the idea that a steady RANS model can simply be applied to unsteadiness and a correct answer obtained is a myth. Defenders of the URANS approach might try to argue that the results in Figure , showing that the URANS has a preference for trajectories that fall near the region of correct decay rate, vindicates the approach. However, there are three serious difficulties with this view. First, the fact that a URANS solution will decay in time until almost all resolved scales are dissipated and a steady RANS solution is achieved, is neither a useful model behaviour, nor consistent with most users expectations for an unsteady model. Second, both the stick spectrum analysis and the simulation data initialised with forced turbulence show that initialising the URANS so that it starts in a state where the decay rate is reasonable is not a trivial undertaking. Finally, while the model may, in certain cases, predict the decay rate properly, in others it can undergo extreme transients into highly non-physical behaviours.
Extending the analysis to the hybrid PANS model, we see that for decaying turbulence PANS solves the first of these issues, placing the fixed point at exactly the resolution the user requested. However, the path to the fixed point, and, in particular, inconsistent initial conditions, still are issues that require further study. Here too, the forced case shows more complicated dynamics. This is consistent with the observation that the hybrid model cannot be calibrated to enforce an energy partition more coarse than the underlying RANS model upon which it is built.
The approach does need to be extended to more common applications of URANS. Work is underway for an extension to free shear and mixing layers. In the meantime, the case of forced turbulence provides a possible analog for the mechanisms at work in URANS of globally unstable flows, with the forcing acting as a proxy for the global instability. These results show that in such a case the forcing can keep the unsteadiness alive. The energy partition is controlled by a balance between the model damping and the forcing input.
In either case, further analysis would benefit if the proponents of the URANS approach clearly defined metrics for what they believe the correct behaviour of the model should be. In the meantime, users of models would be advised to have a very clear understanding of what can and cannot be expected of RANS models before applying them to unsteady problems.
Acknowledgments
The author would like to express his gratitude to Dr. Colin Towery for providing simulation data for comparison, as well as very helpful discussions. Thanks also to Dr. Filipe Pereira for his insightful comments on the manuscript. The reviewers provided very helpful feedback that greatly improved the presentation. This research was funded by the LANL Mix and Burn project under the DOE ASC, Physics and Engineering Models program.
Disclosure statement
No potential conflict of interest was reported by the author(s).
Notes
1 We can slightly generalise this to include any parameter that defines the decomposition into resolved and modelled energy. The PANS approach [Citation36], for example, parameterises the decomposition by the fraction of energy which is modelled, rather than the cutoff length scale. Similarly, simulation approaches that use explicit filtering [Citation50,Citation51], which are parameterised by a filter width, and implicit LES (ILES), for which the numerical viscosity which is used as the turbulence model is a function of the grid spacing, all fall within the Travin et al. [Citation31] definition of LES.
2 This is consistent with the usage of Pope [Citation8], but contrary to Spalart [Citation30], who takes URANS and VLES as synonymous.
References
- Reynolds O. On the dynamical theory of incompressible viscous fluids and the determination of the criterion. Philos Trans R Soc Lond A. 1895;186:123–164. doi:10.1098/rsta.1895.0004
- Taylor GI. Eddy motion in the atmosphere. Philos Trans R Soc Lond A. 1915;215:1–26. doi:10.1098/rsta.1915.0001
- Prandtl L. Bericht über untersuchungen zur ausgebildeten turbulenz. ZAMM J Appl Math Mech/Z Angew Math Mech. 1925;5(2):136–139. doi: 10.1002/zamm.19250050212
- Smagorinsky J. General circulation experiments with the primitive equations: I. The basic experiment. Mon Weather Rev. 1963 Mar;91(3):99–164. doi: 10.1175/1520-0493(1963)091<0099:GCEWTP>2.3.CO;2
- Lilly DK. The representation of small-scale turbulence in numerical simulation experiments. In: Proceedings of the IBM Scientific Computing Symposium on Environmental Sciences; Yorktown Heights, IBM, NY; 1967. p. 195–210.
- Deardorff JW. A numerical study of three-dimensional turbulent channel flow at large Reynolds numbers. J Fluid Mech. 1970;41(part 2):453–480. doi: 10.1017/S0022112070000691
- Germano M. Turbulence: the filtering approach. J Fluid Mech. 1992;238:325–336. doi: 10.1017/S0022112092001733
- Pope SB. Turbulent flows. Cambridge: Cambridge University Press; 2000.
- Celenligil MC, Mellor GL. Numerical solution of two-dimensional turbulent separated flows using a Reynolds stress closure model. J Fluids Eng. 1985 Dec;107(4):467–476. doi: 10.1115/1.3242515
- Lasher WC, Taulbee DB. On the computation of turbulent backstep flow. Int J Heat Fluid Flow. 1992;13(1):30–40. doi: 10.1016/0142-727X(92)90057-G
- Claus RW, Huang PG, MacInnes JM. Time-accurate simulations of a shear layer forced at a single frequency. AIAA J. 1990;28(2):267–275. doi: 10.2514/3.10384
- Launder BE, Morse A, Rodi W, et al. Prediction of free shear flows: a comparison of the performance of six turbulence models. In: Free Turbulent Shear Flows: Volume I-Conference Proceedings; NASA; 1973. p. 361–426; SP-321. Proceedings of a conference held at NASA Langley Research Center, Hampton, Virginia, Jul 20–21, 1972.
- Launder BE, Spalding DB. The numerical computation of turbulent flows. Comput Methods Appl Mech. 1974;3(2):269–289. doi: 10.1016/0045-7825(74)90029-2
- Franke R, Rodi W. Calculation of vortex shedding past a square cylinder with various turbulence models. In: Durst F, Friedrich R, Launder BE, et al., editors. Turbulent Shear Flows 8; Berlin, Heidelberg. Springer Berlin Heidelberg; 1993. p. 189–204.
- Rodi W. On the simulation of turbulent flow past bluff bodies. In: Murakami S, editor. Computational Wind Engineering 1. Oxford: Elsevier; 1993. p. 3–19. https://www.sciencedirect.com/science/article/pii/B978044481688750005X.
- Bosch G, Rodi W. Simulation of vortex shedding past a square cylinder with different turbulence models. Int J Numer Methods Fluids. 1998;28(4):601–616. doi: 10.1002/(ISSN)1097-0363
- Launder BE, Reece GJ, Rodi W. Progress in the development of a Reynolds-stress turbulence closure. J Fluid Mech. 1975;68(3):537–566. doi: 10.1017/S0022112075001814
- Johansson SH, Davidson L, Olsson E. Numerical simulation of vortex shedding past triangular cylinders at high Reynolds number using a k−ε turbulence model. Int J Numer Methods Fluids. 1993;16(10):859–878. doi: 10.1002/fld.1650161002
- Jansson LS, Davidson L, Olsson E. Calculation of steady and unsteady flows in a film-cooling arrangement using a two-layer algebraic stress model. Num Heat Trans A. 1994;25(3):237–258. doi: 10.1080/10407789408955947
- Durbin PA. Separated flow computations with the k−ε−v2 model. AIAA J. 1995;33(4):659–664. doi: 10.2514/3.12628
- Travin A, Shur M, Strelets M, et al. Detached-eddy simulations past a circular cylinder. Flow Turb Comb. 2000;63(1):293–313. doi: 10.1023/A:1009901401183
- Iaccarino G, Ooi A, Durbin P, et al. Reynolds averaged simulation of unsteady separated flow. Int J Heat Fluid Flow. 2003;24(2):147–156. doi: 10.1016/S0142-727X(02)00210-2
- Squires KD, Forsythe JR, Spalart PR. Detached-eddy simulation of the separated flow over a rounded-corner square. J Fluids Eng. 2005 Sep;127(5):959–966. doi: 10.1115/1.1990202
- Shur M, Spalart PR, Squires KD, et al. Three-dimensionality in Reynolds-averaged Navier–Stokes solutions around two-dimensional geometries. AIAA J. 2005;43(6):1230–1242. doi: 10.2514/1.9694
- Jin G, Braza M. Two-equation turbulence model for unsteady separated flows around airfoils. AIAA J. 1994;32(11):2316–2320. doi: 10.2514/3.12292
- Carpy S, Manceau R. Turbulence modelling of statistically periodic flows: Synthetic jet into quiescent air. Int J Heat Fluid Flow. 2006;27(5):756–767. Special issue of the 6th International Symposium on Engineering Turbulence Modelling and Measurements – ETMM6. 10.1016/j.ijheatfluidflow.2006.04.002
- Fadai-Ghotbi A, Manceau R, Borée J. Revisiting URANS computations of the backward-facing step flow using second moment closures. Influence of the numerics. Flow Turb Comb. 2008;81(3):395–414. doi: 10.1007/s10494-008-9140-8
- Palkin E, Mullyadzhanov R, Hadžiabdić M, et al. Scrutinizing URANS in shedding flows: the case of cylinder in cross-flow in the subcritical regime. Flow Turb Comb. 2016;97(4):1017–1046. doi: 10.1007/s10494-016-9772-z
- Pereira FS, Eça L, Vaz G, et al. On the simulation of the flow around a circular cylinder at Re=140,000. Int J Heat Fluid Flow. 2019;76:40–56. doi: 10.1016/j.ijheatfluidflow.2019.01.007
- Spalart P. Strategies for turbulence modelling and simulations. Int J Heat Fluid Flow. 2000;21(3):252–263. doi: 10.1016/S0142-727X(00)00007-2
- Travin A, Shur M, Spalart P, et al. On URANS solutions with LES-like behaviour. In: Neittaanmäki P, Rossi T, Majava K, et al., editors. Congress on Computational Methods in Applied Sciences and Engineering ECCOMAS; 2004.
- Speziale CG. Turbulence modeling for time-dependent RANS and VLES: a review. AIAA J. 1998 Feb;36(2):173–184. doi: 10.2514/2.7499
- Israel DM, Postl D, Fasel HF. A flow simulation methodology for simulation of coherent structures and flow control. AIAA; 2004. AIAA Paper 2004–2225. 2nd AIAA Flow Control Conference, Jun 28–Jul 1, 2004, Portland, OR.
- Fasel HF, von Terzi DA, Sandberg RD. A methodology for simulating compressible turbulent flows. J Appl Mech. 2006 May;73(3):405–412. doi: 10.1115/1.2150231
- Girimaji SS, Jeong E, Srinivasan R. Partially averaged Navier–Stokes method for turbulence: fixed point analysis and comparison with unsteady partially averaged Navier–Stokes. J Appl Mech. 2006 May;73(3):422–429. doi:10.1115/1.2173677
- Girimaji SS. Partially-averaged Navier–Stokes model for turbulence: a Reynolds-averaged Navier–Stokes to direct numerical simulation bridging method. J Appl Mech. 2006 May;73:413–421. doi: 10.1115/1.2151207
- Girimaji SS, Abdol-Hamid KS. Partially-averaged Navier Stokes model for turbulence: implementation and validation; 2005. AIAA Paper 2005–502. 43rd AIAA Aerospace Sciences Meeting & Exhibit, Jan 10–13, 2005, Reno, NV.
- Chaouat B, Schiestel R. A new partially integrated transport model for subgrid-scale stresses and dissipation rate for turbulent developing flows. Phys Fluids. 2005;17(6):065106. doi: 10.1063/1.1928607
- Schiestel R, Dejoan A. Towards a new partially integrated transport model for coarse grid and unsteady turbulent flow simulations. Theor Comput Fluid Dyn. 2005 Feb;18(6):443–468. doi: 10.1007/s00162-004-0155-z
- Schumann U. Subgrid scale model for finite difference simulations of turbulent flows in plane channels and annuli. J Comp Phys. 1975 Aug;18(4):376–404. doi: 10.1016/0021-9991(75)90093-5
- Yoshizawa A. A statistically-derived subgrid model for the large-eddy simulation of turbulence. Phys Fluids. 1982 Sep;25(9):1532–1538. doi: 10.1063/1.863940
- Mohamed MS, Larue JC. The decay power law in grid-generated turbulence. J Fluid Mech. 1990;219:195–214. doi: 10.1017/S0022112090002919
- Lavoie P, Djenidi L, Antonia RA. Effects of initial conditions in decaying turbulence generated by passive grids. J Fluid Mech. 2007;585:395–420. doi: 10.1017/S0022112007006763
- Speziale CG, Mhuiris NMG. On the prediction of equilibrium states in homogeneous turbulence. J Fluid Mech. 1989;209:591–615. doi:10.1017/S002211208900323X
- Haering SW, Oliver TA, Moser RD. Active model split hybrid RANS/LES. Phys Rev Fld. 2022 Jan;7:014603. doi: 10.1103/PhysRevFluids.7.014603
- Perot JB, Kops SMDB. Modeling turbulent dissipation at low and moderate Reynolds numbers. J Turb. 2006;7:N69. doi: 10.1080/14685240600907310
- Towery CAZ, Sáenz JA, Livescu D. Posterior comparison of energy partitioning dynamics in several hybrid RANS-LES turbulence models. In preparation. 2023.
- Morgan BE, Greenough JA. Large-eddy and unsteady RANS simulations of a shock-accelerated heavy gas cylinder. Shock Waves. 2016;26(4):355–383. doi: 10.1007/s00193-015-0566-3
- Haines BM, Grinstein FF, Schwarzkopf JD. Reynolds-averaged Navier–Stokes initialization and benchmarking in shock-driven turbulent mixing. J Turb. 2013;14(2):46–70. doi: 10.1080/14685248.2013.779380
- Bogey C, Bailly C. Effects of inflow conditions and forcing on subsonic jet flows and noise. AIAA J. 2005;43(5):1000–1007. doi: 10.2514/1.7465
- Mathew J, Lechner R, Foysi H, et al. An explicit filtering method for large eddy simulation of compressible flows. Phys Fluids. 2003;15(8):2279–2289. doi: 10.1063/1.1586271
- Corrsin S. The isotropic turbulent mixer: part II. arbitrary Schmidt number. AIChE J. 1964;10(6):870–877. doi: 10.1002/aic.690100618
- Comte-Bellot G, Corrsin S. The use of a contraction to improve the isotropy of grid-generated turbulence. J Fluid Mech. 1966;25(4):657–682. doi: 10.1017/S0022112066000338
- Skrbek L, Stalp SR. On the decay of homogeneous isotropic turbulence. Phys Fluids. 2000;12(8):1997–2019. doi: 10.1063/1.870447
- Ristorcelli JR. Passive scalar mixing: analytic study of time scale ratio, variance, and mix rate. Phys Fluids. 2006 Jul;18(7):075101. doi: 10.1063/1.2214704
Appendices
Appendix 1.
Stick spectrum analysis
The initial conditions for a URANS-type simulation (or, equivalently, for a PANS/hybrid/SRS simulation) cannot fall in any arbitrary point in f, g, R space. The production-to-dissipation ratio, g, will depend on the energy partition, f. Another way to look at it is, given a particular filter that is parameterised by a length scale, ℓ, for each ℓ we will have specific values of f, g, and R. That is, ,
, and
are all functions of ℓ. Choosing a different filter shape will result in a slightly different curve, but it is likely that this will be a weak effect.
We can estimate this dependence by using an assumed spectrum analysis [Citation52–55]. If we take L as the characteristic length scale of the large scales, and the Kolmogorov scale, η, as characterising the smallest scales, we can use an assumed spectrum of
(A1)
(A1) The subfilter turbulent kinetic energy is
(A2)
(A2) Integrating the assumed spectra Equation (EquationA1
(A1)
(A1) ) gives an estimate of
(A3)
(A3) The total turbulent kinetic energy is just the RANS limit of Equation (EquationA3
(A3)
(A3) ): when ℓ goes to zero (actually
) all scales are captured, so
(A4)
(A4) Using this we can obtain an estimate for f,
(A5)
(A5) To compute g and R, we need the subfilter enstrophy,
(A6)
(A6) We can use our assumed spectrum to obtain
(A7)
(A7) and, therefore,
(A8)
(A8) To find the leading order scaling of R, we can eliminate ε and ν in terms of L and η. To do this, we cannot use the usual dimensional estimates, which are not correct for our stick spectrum. Instead, we must use Equation (EquationA4
(A4)
(A4) ) and
(A9)
(A9) With these we find that R scales with
,
(A10)
(A10) Finally,
(A11)
(A11) or
If we further consider the case when
, then
or
(A12)
(A12)
Appendix 2.
URANS Simulations
The URANS simulations used to validate the reduced-order model were performed by colleagues at Los Alamos National Laboratory as part of a wider study of hybrid RANS-LES methods; a complete report of their work is forthcoming [Citation47]. A brief description of the relevant details of simulations follows. All the simulations were performed using an incompressible, pseudo-spectral code with a triply-periodic domain of size . The code uses the two-thirds rule for dealiasing and a fourth-order explicit Runge–Kutta with a CFL based dynamic time step for time advancement.
The DNS data for homogeneous isotropic decaying turbulence used to generate the initial conditions for the URANS were created starting with a physical space mesh with random forcing in a range of wave numbers,
. After this simulation reached a statistically steady state, the simulation was restarted on a
domain and ran for two integral time-scales, and then again on a
domain for an additional integral time scale. At this point, the forcing was turned off and the turbulence was allowed to decay for two integral time-scales, to achieve a power-law decay.
To obtain the initial conditions for the URANS, a Gaussian filter was applied, and both the filtered velocity fields and and
were computed. The RANS equations were solved in logarithmic formulations (solving for
and
) to ensure positivity and improve stability. The DNS fields used to generate the initial conditions were resolved to half the Kolmogorov scale, and so are very well resolved. The URANS simulations were performed with a grid resolution of one-third the filter width used to generate the initial conditions.