
 ?Mathematical formulae have been encoded as MathML and are displayed in this HTML version using MathJax in order to improve their display. Uncheck the box to turn MathJax off. This feature requires Javascript. Click on a formula to zoom.
Abstract
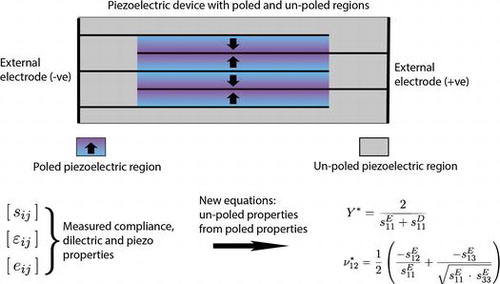
Piezoelectric devices with complex electrode geometries often contain ferroelectric regions that experience little or no electric field and remain unpolarised. Since the un-poled and poled material properties differ it is desirable to account for these regions in a device when developing predictive models or to design piezoelectric transducers. The lack of published data on the elastic properties for un-poled ferroelectrics, specifically the numerous commercial compositions such as lead zirconate titanate, reflects the difficulty of experimental measurement. In this work, a method for predicting un-poled properties from more commonly available poled data has been developed. A new method of calculating these properties is presented which provides a rapid and practical solution to the problem of evaluating the isotropic stiffness and Poisson’s ratio for an un-poled ferroelectric material. The way in which this calculation has been derived and validated is presented and detailed comparisons are made with alternative methods and experimental data.
1. Introduction
Piezoelectric actuators increasingly employ complex electrode geometries for improved performance, such as multi-layer actuators, ring benders, active fibre composites with interdigitated electrodes and micro-electro-mechanical systems (MEMS) [Citation1–3]. These complex electrode arrangements produce non-uniform electric field distributions throughout the device that can provide enhanced actuation or lower driving voltages, but may also result in ferroelectric regions which experience little or no electric field. Since these regions experience negligible electric fields that are below the coercive field (Ec), they can be regarded as un-poled ferroelectric material. When developing accurate finite element or analytical models for these complex devices, it is desirable to account for any un-poled regions, since the properties of un-poled material are different to those of the poled material [Citation2]. For example, the use of incorrect elastic constants in predictive models for piezoelectric transducers such as sensors, actuators and energy harvesters can lead to incorrectly calculated strains, sensor sensitivity or, for devices operating at resonant frequencies, errors in the frequency response of the device.
Assigning properties to un-poled regions in transducer devices is difficult due to the lack of published properties for un-poled ferroelectrics, for example for the range of commercial ‘soft’ and ‘hard’ lead zirconate titanate (PZT) compositions. The aim of this paper is to provide a new and accurate method for predicting the un-poled properties of ferroelectric ceramics from the more commonly available poled material data. The properties of poled piezoelectric materials are often available directly from the manufacturer, or are published in the literature due to the relative ease of experimental measurement, using impedance resonance analysis [Citation3] and by IEEE Standards [Citation4–6]. Obviously, for un-poled materials that are not piezoelectric the conventional electro-mechanical resonance techniques cannot be used to characterise the material.
2. Un-poled material properties
Polycrystalline ferroelectrics in the un-poled state are isotropic since domains are randomly distributed throughout the material volume. In this case the ferroelectric can be characterised by a single permittivity, , and two engineering elastic constants, such as Young’s modulus,
and Poisson’s ratio,
. The superscript ‘*’ is used here to indicate that the ferroelectric is un-poled. Clearly the piezoelectric coefficients (d33, d31 and d15) are zero in the un-poled state, although the material will still exhibit a small degree of electrostriction, as experienced by all materials, which has not been considered in this approach. The permittivity of a ferroelectric is intimately linked to its microstructure, for instance with grain size [Citation7–9], and to adequately represent the material to predict permittivity requires an approximation of the ceramic grain and sub-structure, which would ultimately require highly complex microstructural models. In addition, it is relatively trivial to experimentally measure the permittivity of an un-poled material using a simple measurement of a capacitance and geometry. However, unlike permittivity, the elastic properties,
and
, for the un-poled material are less influenced by microstructure and are primarily a function of the atomic bonding of the material. This can be considered analogous to structural materials, such as metals, where the stiffness for a particular class of alloy is relatively constant and insensitive to microstructure. Furthermore, while the measurement of permittivity for an un-poled material is straightforward, the experimental measurement of the elastic properties (
and
) can be challenging [Citation10], mainly due to the brittle nature of ferroelectric ceramics and the ferroelastic contributions associated with domain wall motion under an applied stress. Fett and Munz have reported on the characterisation of the mechanical properties of un-poled ferroelectrics [Citation10] whereby compression testing at high loading rates was used to minimise any time-dependent deformation and ferroelastic contributions were minimised using dynamic test methods, such as resonance or ultrasonic velocity measurements [Citation10].
3. Methods to predict un-poled properties
A range of techniques can be used to estimate the un-poled properties of a ferreoelectric and we will initially use barium titanate as a case study since it has been explored in detail. Devonshire [Citation11] proposed that the properties for ceramic barium titanate may be calculated by a directional average of the single domain properties. For a nearly isotropic crystal, the difference between averaging over compliance values [s] or stiffness values [c] will be small, but since a tetragonal single-crystal of barium titanate is highly anisotropic, the choice of elastic constants is important. Devonshire identified the difficulty in selecting appropriate mechanical and electrical boundary conditions, so averaging over constant field (E) or dielectric displacement (D) and hence [s]E, [s]D, [c]E or [c]D may all be equally valid. For the average produced from [c]E, (120 GPa in Table ), good results are achieved compared to experimental values. However, without prior knowledge of the target property, this method can only provide a range of values depending on the averaging approach, with no indication as to which value is correct. While Devonshire applied a simple mechanical mixture approach, Marutake [Citation12] considered that piezoelectric coupling at the grain level should be modelled for an un-poled material. The electric field and mechanical stress for a spherical crystallite placed in an isotropic medium, which represents the bulk un-poled ceramic, is calculated and averaged over all possible orientations using a statistical approach. In this work, the resulting estimates were reasonable, but now require more complex calculations. This approach predicts a higher stiffness for the un-poled material of 125 GPa (second row in Table ).
Table 1. Elastic properties for un-poled barium titanate predicted by different approaches. Experimental values range from  = 100–135 GPa, ν12* = 0.32–0.36; full details of experimental data and methods are shown in Table A1.
This effective medium approach has also proven useful, and has been extended by self-consistent methods by Dunn [Citation13]. In this work an iterative process calculates the interaction between the notional single grain and effective medium. Such numerical methods tend to converge quickly but require a large number of calculations and are solved computationally. Although the model now better approximates the physical system, the resulting stiffness values (158 and 143 GPa in Table ) are higher than those that employ a simple average. Table summarises the predicted un-poled elastic properties for barium titanate, using a variety of approaches since the work of Devonshire [Citation11]. It is interesting to observe that as time has progressed (first column), the predicted values have often drifted further from those determined experimentally which range from = 100–135 GPa, ν12* = 0.32–0.36; full details of experimental data and experimental methods of barium titanate are shown in Table A1. More recently, work by Dent et al. [Citation2] demonstrated that a finite element (FE) micromechanical model can be used to predict un-poled properties using poled data. The method involves creating a large randomly orientated piezoelectrically coupled array with the properties of poled ferroelectric in each direction and good agreement to the relatively sparse experimental un-poled data was achieved; see final row in Table . The process is, however, computationally intensive and, as a result, more simple methods of predicting un-poled properties are required, and this is the primary motivation for this paper. As the co-authors have developed the coupled FE model of [Citation2], we will compare FE results with the new empirical approach proposed in this work along with experimental data.
Since ferroelectric domains are randomly orientated in an un-poled material it is isotropic in nature and only the elastic modulus () and Poisson’s ratio (
) are required to describe the elastic properties of these materials. As can be seen from Table A1, only a limited amount of experimental data exists in the literature for un-poled BaTiO3 material. The experimental method to determine the elastic properties is also highlighted in the table and it is of interest to note that no data originated from conventional tensile or compressive testing due to challenges of mechanical testing brittle materials and ferroelastic effects.
In addition to the questionable accuracy of the relatively complex numerical methods described above, the modelling processes often require single-crystal data that is not easily obtainable for many ferroelectrics, in particular the range of polycrystalline PZT materials [Citation18]. It is also necessary to have the full tensor data for the material, which requires extensive experimental characterisation. For these reasons, such theories have not been widely adopted to predict un-poled elastic properties for practical reasons by manufacturers or designers of ferroelectric and piezoelectric devices. Clearly there is a need for an approach that is (i) easy to use, (ii) can use the more widely available poled polycrystalline data and (iii) ideally uses only a small set of poled properties.
4. Empirical observations
It is has been observed in several sources [Citation11,Citation12,Citation14,Citation19] that the [s]E compliances for the poled material are often similar to those of the un-poled material. For this reason, a rule of mixtures (RoM) approach has been considered [Citation10], which assumes the domain polarisations are equally aligned in all three principle axes for the un-poled condition, and averages over s11, s22 and s33. For the boundary condition of constant field (E), this leads to:(1)
(1)
where and
are the constant field compliances perpendicular and parallel to the poling direction, respectively. A similar approach can be used using the constant dielectric displacement (D) compliances and averaging over s11D, s22D and s33D [Citation10].
The inspiration for the empirical approach to predict un-poled elastic properties developed in this paper stems from data in Figure , which shows a series of detailed experiments by Berlincourt of the s11 and s33 coefficients for PZT-5A as a function of degree of poling at constant field (s33E and s11E) and constant polarisation (s33D and s11D). The degree of poling (kij) was determined from the ratio of the coupling coefficient of the material compared to that of the fully poled material using impedance resonance analysis. A number of interesting points can be observed.Equation(1)(1)
(1)
| (i) | The s33 and s11 elastic properties at constant field and dielectric displacement converge to a single value at 0% poling, as expected since the material becomes isotropic in this un-poled state. | ||||
| (ii) | The poled ferroelectric is less compliant at constant dielectric displacement (D, open circuit) compared to constant field (E, closed circuit) due to the generation of an internal electric field that acts in the opposite direction to the mechanical load [Citation19]. For the s33 elastic compliances, s33D diverges rapidly from the un-poled value to a lower value, while s33E diverges less rapidly to a higher value as the degree of poling increases. The more rapid divergence in s33D is due to the strong (squared) piezoelectric contribution to the open circuit compliance since | ||||
| (iii) | Averaging over s33E and s11E to obtain Y11*, as in Equation (Equation1 | ||||
Figure 1. Compliance s11 and s33 coefficients for PZT-5A, as a function of poling at constant field (E) and constant polarisation (D). Data from Berlincourt [Citation20] by impedance resonance analysis along with prediction of un-poled compliance from Equation (Equation3(3)
(3) ).
![Figure 1. Compliance s11 and s33 coefficients for PZT-5A, as a function of poling at constant field (E) and constant polarisation (D). Data from Berlincourt [Citation20] by impedance resonance analysis along with prediction of un-poled compliance from Equation (Equation3(3) Y11∗=2s11E+s11D(3) ).](/cms/asset/72d10c6b-9619-4b08-8dee-5bfe74ffadc5/tsta_a_1302274_f0001_oc.gif)
(2)
(2)
| (iv) | With increasing degree of polarity, the s33 elastic constants of Figure tend to diverge at different rates depending on the electrical boundary conditions, since s33D has a piezoelectric contribution which increases with level of poling. | ||||
A particular feature to note in Figure is that the s11D and s11E compliances diverge an equal amount from the un-poled value and by a smaller degree compared to the s33 compliances. This can be possibly attributed to two reasons. Firstly, the s11 compliances are normal to the poling direction and are less piezoelectrically coupled since and the piezoelectric d31 coefficients are lower than d33; typically d31~d33/2. Secondly, at constant field it can be seen that s11E<s33E which indicates that the poled material is more compliant in the 3-direction than in the 1-direction under short circuit conditions (when there is no piezoelectric contribution); the un-poled material with a random arrangement of domains is likely to be dominated by the stiffer and more abundant regions in the 1-direction (since s11E = s22E) and the un-poled compliance is therefore closer to s11 rather than s33. The combination of a smaller piezoelectric contribution and lower short circuit compliance in the 1-direction, compared to the 3-direction, may explain the small and more equal divergence of the s11D and s11E compliances from the un-poled value; but is worthy of further studies. A similar trend is observed for the variation of Poisson’s ratio with degree of poling, see Figure . It can be seen that v12E (
) and vmE
) exhibit a small divergence with the degree of poling and at equal rates, as compared to v12D (
) and vmD (
). This may be due to the fact that at constant field conditions (E, closed circuit) there is no piezoelectric contribution to the Poisson’s ratios.
Figure 2. Poisson’s ratios ν12 and νm for PZT-5A, as a function of poling at constant field (E) and constant polarisation (D). Data from Berlincourt [Citation20] by impedance resonance analysis along with prediction of un-poled Poisson’s ratio from Equation (Equation4(4)
(4) ).
![Figure 2. Poisson’s ratios ν12 and νm for PZT-5A, as a function of poling at constant field (E) and constant polarisation (D). Data from Berlincourt [Citation20] by impedance resonance analysis along with prediction of un-poled Poisson’s ratio from Equation (Equation4(4) ν12∗=12(ν12E+νmE)(4) ).](/cms/asset/2a5136cb-77da-4740-aa00-288586625d98/tsta_a_1302274_f0002_oc.gif)
Based on these observations, simple empirical methods for estimating the isotropic elastic properties can be developed for PZT-5A. The un-poled elastic modulus (Y11*) is determined from an average of the constant field (s11E) and constant polarisation (s11D) compliances of the poled material, since from Figure these properties diverge almost linearly with poling. Equation (Equation3(3)
(3) ) is therefore an empirical approach to determine Y11*.
(3)
(3)
The Poisson’s ratio (ν12*) may be estimated in a similar way based on the divergence in Figure of the constant field planar (ν12E) and meridian Poisson’s ratios (νmE) for the poled material (Equation (Equation4(4)
(4) )). This leads to:
(4)
(4)
Expanding the Poisson’s ratio terms in Equation (Equation4(4)
(4) ) into the more widely available compliance, [sij], properties leads to Equation (Equation5
(5)
(5) ):
(5)
(5)
This produces two simple equations (Equations (Equation3(3)
(3) ) and (Equation5
(5)
(5) )) where the un-poled elastic modulus can be estimated simply from knowledge of the s11E and s11D of the poled material; these are relatively easily measured and widely available in the literature. Similarly, the un-poled Poisson’s ratio can be estimated from a relatively sparse set of constant field compliances: s11E, s12E, s13E and s33E in Equation (Equation4
(4)
(4) ). Given that the un-poled material is isotropic, the un-poled shear modulus (G44*) can be calculated using Equation (Equation6
(6)
(6) ):
(6)
(6)
5. Evaluation of empirical method to predict un-poled elastic properties
The empirical relationships for obtaining un-poled elastic properties in Equations (Equation(3)–(5)), have essentially been derived from Berlincourt’s data for PZT-5A [Citation20] from Figures and . In order to thoroughly examine whether this approach is valid for a range of other ferroelectrics, it is of interest to compare empirical predictions with the coupled FE micromechanical method, rule of mixtures and, most importantly, the limited sets of experimentally measured and reported data on un-poled ferroelectric materials.
5.1. Barium titanate
Table shows the elastic modulus for un-poled barium titanate, Y11* (GPa), as predicted by the empirical method (Equation (Equation3(3)
(3) )), coupled FE modelling and a simple rule of mixtures (Equation (Equation1
(1)
(1) )). An experimentally measured value [Citation12] is presented and the relative difference (%) between experimental and predicted results shown for comparison. The input material properties were varied by using experimental data for poled ceramics and single-crystals shown in Table A2. It can be seen that the new empirical approach (Equation (Equation3
(3)
(3) )) is effective in predicting the un-poled properties, when the input data is for a polycrystalline ceramic, with differences 6–8% to the measured properties. However, when using single-crystal (mono-crystal) data the predicted modulus is overestimated by up to 13%. In this situation the high elastic anisotropy cannot be effectively averaged by this method (or the rule of mixtures approach), although the FE micromechanical model can better account for this condition. Ultimately, the differences between the empirical approach and measured values are typically less than 10%, which is not significantly greater than the more time consuming coupled FE approach. The rule of mixtures approach always under predicts the un-poled elastic modulus by 10% or more, as would be expected from Figure . Table shows the predicted Poisson’s ratio for un-poled barium titanate, ν12*, and the empirical equation and coupled FE modelling. Again good correlation between empirical, FE and the experimental data is generally observed, with larger errors associated with the FE method.
Table 2. Elastic modulus for un-poled barium titanate, Y11* (GPa), as predicted by the empirical equation, coupled FE modelling and a simple rule of mixtures (RoM) average. The experimentally measured value is [Citation12] Y11* = 128 GPa and the relative difference (%) between experimental and predicted results are shown for comparison.
Table 3. Poisson’s ratio for un-poled barium titanate, ν12*, as predicted by the empirical equation and coupled FE modelling. The experimentally measured value is [Citation12] ν12* = 0.35 (from un-poled s11* and s44*) and the relative difference (%) between experimental and predicted results are shown for comparison.
5.2. PZT-5A
Tables and show the elastic modulus, Y11*, and Poisson’s ratio, ν12*, for un-poled PZT-5A, respectively, as predicted by the empirical equation, coupled FE modelling and the rule of mixtures average. Data are taken for PZT-5A from weakly to fully poled levels using impedance resonance analysis; [Citation20] the original data are shown in Table A3. The results in Tables and demonstrate that when polycrystalline data are used, the agreement between the empirical approach (Equations (Equation3(3)
(3) ) and (Equation4
(4)
(4) )) and experimental data is excellent for all degrees of poling, with differences of typically 1% for both the modulus and Poisson’s ratio. As we use data for the increasingly poled material, the FE coupled model and rule of mixtures average shows larger differences to the measured data. However, the empirical values are invariant to the state of poling for the input material. Ideally, the models would predict the un-poled property to be invariant with the state of poling input material properties. Although the coupled FE model is less influenced by the poling of the material, the empirical approach provides the least variation. Since most poled ferroelectric properties are reported for the fully poled polycrystalline material, this implies that the empirical approach will provide the most accurate estimation of un-poled stiffness.
Table 4. Elastic modulus for un-poled PZT-5A, Y11* (GPa), as predicted by the empirical equation, coupled FE modelling and a simple rule of mixtures (RoM) average. The experimentally measured value is [Citation20] Y11* = 66GPa and the relative difference (%) between experimental and predicted results are shown for comparison.
Table 5. Poisson’s ratio for un-poled PZT-5A, ν12*, as predicted by the empirical equation and coupled FE micromechanical modelling. The experimentally measured value is [Citation20] ν12* = 0.38 and the relative difference (%) between experimental and predicted results are shown for comparison.
5.3. Other ferroelectric compositions
For actuator applications, PZT-5A is a commonly used composition, but to assess the general applicability of the empirical approach (Equations (Equation3(3)
(3) ) and (Equation4
(4)
(4) )), it is useful to consider a range of PZT compositions. This also enables comparison to the measured properties found independently by different methods. Table shows the elastic modulus, Y11*, for un-poled PZT compositions, ranging from hard to soft materials; the complete datasets are summarised in Tables A4 and A5. Experimentally measured values are included for comparison to those predicted by an empirical equation and coupled FE modelling. The relative difference (%) between experimental and predicted results has been indicated; in some cases experimental data are not available but predicted un-poled elastic properties are reported for interest. For many of the materials studied, the empirical approach proves to be accurate from 2 to 6%. However, for the TRS600 material a large difference can be observed. This may be due to a static, rather than dynamic, method being used to experimentally measure the un-poled elastic properties which can lead to ferroelastic deformation and a reduced modulus; the experimentally measured Y11* is not consistent with the other experimental data presented in Table . The data in Table shows the Poisson’s ratio estimations, with good agreement by the empirical method (less than 5%). For the range of PZT compositions, the empirical approach and coupled FE models produce comparable results. However, the advantages of the empirical method are (i) the simplicity by which the elastic constants are predicted, (ii) that it does not require single-crystal data or the complete datasets, and (iii) it is not significantly influenced by the degree of poling of the input data.
Table 6. Elastic modulus, Y11* (GPa), for un-poled PZT compositions. Experimentally measured values are included for comparison to those predicted by an empirical equation and coupled FE modelling. The relative difference (%) between experimental and predicted results has been indicated. Data from [Citation20] are from impedance resonance analysis, [Citation10] from ultrasonic velocity and [Citation24] by compression testing.
Table 7. Poisson’s ratio, ν12*, for un-poled PZT compositions. Experimentally measured values are included for comparison to those predicted by an empirical equation and coupled FE modelling. The relative difference (%) between experimental and predicted results has been indicated. Data from [Citation20] are from impedance resonance analysis, [Citation10] from ultrasonic velocity and [Citation24] by compression testing.
A final note is that the relationship between the s11 compliances at constant field and displacement is given by:(7)
(7)
where and k31 is the transverse coupling coefficient, d31 is the transverse piezoelectric coefficient and
is the permittivity at constant stress. Substitution of these relationships into Equation (Equation3
(3)
(3) ) leads to two other empirical relationships to determine Y11*, depending on which poled data is available in the literature:
(8)
(8)
and(9)
(9)
6. Conclusions
This paper has presented a new approach for predicting the un-poled properties of ferroelectric ceramics from the more commonly available poled material data; this includes Young’s modulus, , and Poisson’s ratio,
. The properties of poled piezoelectric materials are often available directly from the manufacturer, or are published in the literature due to the relative ease of experimental measurement, using impedance resonance for example and IEEE/IEC standards. The approach predicts the un-poled properties typically to within 10% of the experimentally measured data and this has been verified for a range of barium titanate single-crystal and polycrystalline data, PZT-5A and a variety of hard and soft PZT compositions. The approach is more accurate than the rule of mixtures approach and coupled finite element methods which are time consuming and computationally expensive. The accuracy increases as the degree of anisotropy of the input properties decreases, e.g. partially poled ceramic properties provide better accuracy than fully poled ceramics, which in turn provides better accuracy than single-crystal data. Nevertheless, the approach developed here is shown to work well with fully poled polycrystalline data and single-crystal data are not required. A further advantage of the empirical equations is that only a limited set of poled properties are also required (s11D, s11E, s12E, s13E and s33E). This approach is an important new method to predict un-poled properties for use in modelling and design of ferroelectric transducers that contain a significant fraction of un-poled regions due to the device architecture, for example, multi-layer actuators, ring benders, active fibre composites, micromechanical systems (MEMS), and other ferroelectric devices that contain un-poled regions within the transducer device.
Disclosure statement
No potential conflict of interest was reported by the authors.
Funding
C.R. Bowen would like to acknowledge funding from the European Research Council under the European Union’s Seventh Framework Programme [FP/2007-2013]; ERC grant agreement [number 320963] on Novel Energy Materials, Engineering Science and Integrated Systems (NEMESIS).
References
- Wilson SA, Jourdain RPJ, Zhang Q, et al. New materials for micro-scale sensors and actuators. An engineering review. Mater Sci Eng R Reports. 2007;56(1-6):1–129.10.1016/j.mser.2007.03.001
- Dent AC, Bowen CR, Stevens R, et al. Effective elastic properties for unpoled barium titanate. J Eur Ceram Soc. 2007;27(13-15):3739–3743.10.1016/j.jeurceramsoc.2007.02.031
- Alemany C, Gonzalez AM, Pardo L, et al. Automatic determination of complex constants of piezoelectric lossy materials in the radial mode. J Phys D Appl Phys. 1995;28:945–956.10.1088/0022-3727/28/5/017
- IEEE Standard on Piezoelectricity. ANSI/IEEE Std 176–1987. New York, USA, NY: American Standards National Institute; 1987.
- British Standards Institute, “Piezoelectric properties of ceramic materials and components: Part 2: methods of measurement : low power.” BSI, London, p. BS EN 50324-2:2002, 2002.
- British Standards Institute, “Piezoelectric properties of ceramic materials and components: part 3 : methods of measurement : high power.” BSI, London, p. BS EN 50324-3: 2002, 2002.
- Arlt G, Hennings D, de With G. Dielectric properties of fine-grained barium titanate ceramics. J Appl Phys. 1985;58(4):1619–1625.10.1063/1.336051
- Hackenberger WS, Pan MJ, Vedula V, et al. Effect of grain size on actuator properties of piezoelectric ceramics. Proc SPIE. 1998;3324:28–36.10.1117/12.316878
- Randall CA, Kim N, Kucera J-P, et al. Intrinsic and extrinsic size effects in fine-grained morphotropic-phase-boundary lead zirconate titanate ceramics. J Am Ceram Soc. 1998;81:677–688.
- Fett I, Munz D. Measurement of Young’s moduli for lead zirconate titanate (PZT) Ceramics. J Test Eval. 2000;28(1):27–35.
- Devonshire AF. CIX. Theory of barium titanate—Part II. London, Edinburgh, Dublin Philos Mag J Sci. 1951;42(333):1065–1079.10.1080/14786445108561354
- Marutake M. A calculation of physical constants of ceramic barium titanate. J Phys Scociety Japan. 1956;11(8):807–814.10.1143/JPSJ.11.807
- Dunn ML. Effects of grain shape anisotropy, porosity, and microcracks on the elastic and dielectric constants of polycrystalline piezoelectric ceramics. J Appl Phys. 1995;78(3):1533–1541.10.1063/1.360246
- Berlincourt D, Jaffe H. Elastic and piezoelectric coefficients of single-crystal barium titanate. Phys Rev. 1958;111(1):143–148.10.1103/PhysRev.111.143
- Rödel J, Kreher WS. Effective properties of polycrystalline piezoelectric ceramics in 3rd European Mechanics of Materials Conference on Mechanics and Multi-Physics Processes in Solids : Experiments, Modelling, Applications, Oxford, 1999, Pr9-239–Pr9-247.
- den Toonder JMJ, van Dommelen JAW, Baaijens FPT. The relation between single crystal elasticity and the effective elastic behaviour of polycrystalline materials: Theory, measurement and computation. Model Simul Mater Sci Eng. 1999;7(6):909–928. Nov.
- Froehlich A, Brueckner-Foit A, Weyer S. “Effective properties of piezoelectric polycrystals.”, smart structures and materials 2000. Proc SPIE. 2000;3992:279–287.10.1117/12.388212
- Berlincourt DA, Cmolik C, Jaffe H. Piezoelectric properties of polycrystalline lead titanate zirconate compositions. Proc IRE. 1960;48(2):220–229.10.1109/JRPROC.1960.287467
- Rödig T, Schönecker A, Gerlach G. A survey on piezoelectric ceramics for generator applications. J Am Ceram Soc. 2010;93(4):901–912.10.1111/jace.2010.93.issue-4
- Berlincourt D. Variation of electroelastic constants of polycrystalline lead titanate zirconate with thoroughness of poling. J Acoust Soc Am. 1964;36(3):515–520.10.1121/1.1918990
- Marutake M, Ikeda T. Elastic constants of porous materias, especially of BaTiO3 ceramics. J Phys Soc Jpn. 1956;11(8):814–818.10.1143/JPSJ.11.814
- Bechmann R. Elastic, piezoelectric, and dielectric constants of polarized barium titanate ceramics and some applications of the piezoelectric equation. J Acoust Soc Am. 1956;28(3):347–350.10.1121/1.1908324
- Berlincourt D, Krueger HHA, Near C. Technical publication TP-226: Properties of piezoelectric ceramics. Wrexham (UK): Morgan Electro Ceramics Ltd.;1999.
- Zgonik M, Bernasconi P, Duelli M, et al. Dielectric, elastic, piezoelectric, electro-optic, and elasto-optic tensors of BaTiO3 crystals. Phys Rev. 1994;50(9):5941–5949.10.1103/PhysRevB.50.5941
- Forrester JS, Kisi EH. Ferroelastic switching in a soft lead zirconate titanate. J Eur Ceram Soc. 2004;24(3):595–602.10.1016/S0955-2219(03)00247-4
- Duffy W, Cheng BL, Gabbay M, et al. Anelastic behavior of barium-titanate-based ceramic materials. Metall Mater Trans A. 1995;26(7):1735–1739.10.1007/BF02670760
- PI Ceramic GmbH - Material coefficients for PIC151. [ Online]. Available from:www.piceramic.com.
- PI Ceramic GmbH - Material coefficients for PIC155. [ Online]. Available from:www.piceramic.com.
- Nguyen CH, Pietrzko SJ. FE analysis of a PZT-actuated adaptive beam with vibration damping using a parallel R – L shunt circuit. Finite Elem Anal Des. 2006;42:1231–1239.10.1016/j.finel.2006.06.003
- Stroyan JJ. Processing and characterization of PVDF, PVDF-TrFE and PVDF-TrFE-PZT composites. [ MSc. Thesis]. Washington: Washington State University; 2004.
Table A1. Elastic properties for un-poled barium titanate determined by different experimental techniques.
aThe material was 92% dense and data extrapolated for a fully dense material by the author.
bMaterial data are for a single-crystal of barium titanate at 150°C in the cubic phase, for comparison.
Table A2. Material properties of ceramic and single-crystal barium titanate.
Table
aAlthough stiffness and ‘e’-coefficients are presented these values were re-calculated from the measured compliances and ‘d’-coefficients to ensure consistency. (Only minor variations were noted.)
bBerlincourt et al. [Citation23] provide stiffness and ‘e’-coefficients, but these were again re-calculated from the measured compliances and ‘d’-coefficients. Disagreement was only noted for e33 (13.5 reported, 14.5 re-calculated), probably due to a typographic error in the original report. Note the material is a modified barium titanate.
cValues were calculated from the measured compliances and ‘d’-coefficients from Berlincourt and Jaffe[Citation14].
dA disparity was found between the ‘d’- and ‘e’-coefficients reported by Zgonik et al. [Citation24]. Since ‘d’ values were experimentally measured and had greater accuracy, the ‘e’-coefficients have been re-calculated.
Table A3. Material properties for PZT-5A for different poling conditions P (0 to 100% poled determined by coupling coefficient k33).[Citation20]
Table
Table A4. Material properties for poled PZT ‘5A’ type compositions.
Table
Table A5. Material properties for poled hard and soft PZT compositions.
Table
aThe value of was determined from
, with k31 = 0.31[Citation14].