
 ?Mathematical formulae have been encoded as MathML and are displayed in this HTML version using MathJax in order to improve their display. Uncheck the box to turn MathJax off. This feature requires Javascript. Click on a formula to zoom.
Abstract
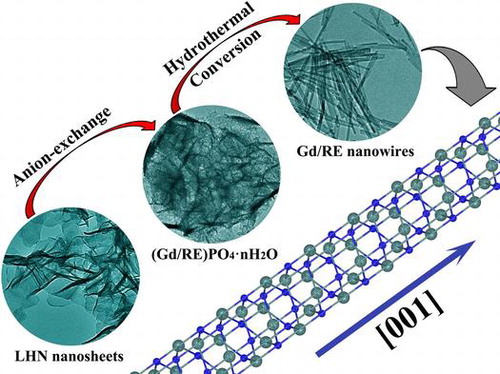
Hexagonal (Gd0.95RE0.05)PO4·nH2O nanowires ~300 nm in length and ~10 nm in diameter have been converted from (Gd0.95RE0.05)2(OH)5NO3·nH2O nanosheets (RE = Eu, Tb) in the presence of monoammonium phosphate (NH4H2PO4) and ethylene diamine tetraacetic acid (EDTA). They were characterized by X-ray diffraction, thermogravimetry, electron microscopy, and Fourier transform infrared and photoluminescence spectroscopies. It is shown that EDTA played an essential role in the morphology development of the nanowires. The hydrothermal products obtained up to 180 °C are of a pure hexagonal phase, while monoclinic phosphate evolved as an impurity at 200 °C. The nanowires undergo hexagonal→monoclinic phase transformation upon calcination at ≥600 °C to yield a pure monoclinic phase at ~900 °C. The effects of calcination on morphology, excitation/emission, and fluorescence decay kinetics were investigated in detail with (Gd0.95Eu0.05)PO4 as example. The abnormally strong 5D0→7F4 electric dipole Eu3+ emission in the hexagonal phosphates was ascribed to site distortion. The process of energy migration was also discussed for the optically active Gd3+ and Eu3+/Tb3+ ions.
1. Introduction
One-dimensional (1D) nanostructures such as nanowires, nanorods, and nanotubes are drawing broad research interest owing to their unique physicochemical properties and applications in nanoscale devices, and a variety of strategies have been developed for their synthesis, typically including template-directed growth, the use of supersaturation control to modify the growth habit of the seed, and the use of capping reagents to kinetically control the growth rates of different crystal facets [Citation1–5]. Rare-earth (RE) ions present numerous well-defined electronic transitions involving their 4f and 5d shells, and the RE-related materials have been applied in solid-state lasers, plasma display panels (PDPs), biolabeling, and so on [Citation6–8]. Wang et al. [Citation9] employed NaYF4:Yb,Er up-conversion nanoparticles as a novel fluorescent label for the detection of latent fingermarks with high sensitivity and broad applicability. As for 1D nanomaterials, Yang et al. [Citation10] prepared nearly monodispersed and well-defined Gd2O3:Eu3+ nanorods and microrods through hydrothermal reaction followed by conventional annealing, and explored their size-dependent photoluminescence for potential application in high-performance phosphors. Ethylene diamine tetraacetic acid (EDTA) is well known to have strong ability to coordinate with metal ions with its four carboxyl groups (-COOH) and two nitrogen atoms, and has been tested to be useful in the morphology/structure modification and surface functionalization of an inorganic material [Citation11]. Employing Na2EDTA as a capping reagent, Huang et al. [Citation12] synthesized 1D nanobelts and nanorods of YVO4 via a facile hydrothermal route, and morphology-dependent luminescence of the Eu3+ doped YVO4 was also investigated.
One-dimensional rare-earth orthophosphates (REPO4) may find applications in phosphor displays and lighting, waveguide devices, fluorescence labels for biological detection, and solid-state lasers [Citation13,14]. Gd3+ ion is well known to be strongly paramagnetic since it has the largest number (seven) of unpaired electrons in the lanthanide family, and is frequently used in the phosphor field as a sensitizer to improve excitation absorption and to enhance activator luminescence through energy transfer [Citation15,16]. Therefore, gadolinium phosphate as a host lattice may combine the luminescence of the activator and the magnetic properties of Gd3+ [Citation17]. Gadolinium phosphate has two basic structures depending on the extent of hydration, with the hydrous phase (GdPO4·nH2O) belonging to the rhabdophane type (hexagonal system, space group P3121) and the anhydrous one (GdPO4) belonging to the monazite type (monoclinic, space group P21/n). Huang et al. [Citation18] developed a low-temperature solution approach to prepare hexagonal GdPO4·H2O nanorods with hydrogel-like property and proposed its utilization in encapsulation and drug release. Yu et al. [Citation19] prepared monoclinic GdPO4:Eu3+ nanowires and nanorods via hydrothermal reaction and compared their luminescence properties. Through a melt-quenching method, Guo et al. [Citation20] fabricated transparent glass ceramics containing GdPO4:Eu/Tb crystallites and manifested their possible application in lighting and luminescence fields. It is noteworthy that gadolinium phosphates were mostly investigated for the anhydrous monoclinic phase, since water of hydration always induces serious luminescence quenching.
Layered hydroxyl nitrate (LHN) compounds, exemplified by the group of RE2(OH)5NO3·nH2O, are attracting keen research interest during recent years owing to their unique layered structures and the rich electronic, optical, magnetic, and catalytic functionalities of the lanthanide (Ln) elements. We established in this work a new technique to generate (Gd0.95RE0.05)PO4·nH2O (RE = Eu, Tb) nanowires, employing nanosheets (thickness 3–5 nm) of the LHN as a sacrificial precursor, monoammonium phosphate (NH4H2PO4) as the phosphate source, and EDTA as a morphology modifier. It was also found that calcining the hydrated hexagonal nanowires at 500 °C did not bring obvious change to the morphology and phase purity but substantially enhanced their luminescence owing to dehydration. The effects of EDTA content, hydrothermal temperature on phase structure, morphology and photoluminescence of the nanowires were systematically studied, and the energy transfer from Gd3+ to Eu3+ and Tb3+ was also discussed.
2. Experimental details
2.1. Synthesis of LHN nanosheets and conversion into (Gd0.95RE0.05)PO4·nH2O (RE = Eu, Tb) nanowires
The starting gadolinium, europium, and terbium sources were Gd2O3, Eu2O3, and Tb4O7 (99.99% pure, Huizhou Ruier Rare-Chem. Hi Tech. Co. Ltd., Huizhou, China), and the nitrate solution of RE was prepared by dissolving the corresponding oxide with a proper amount of nitric acid. The reagents of ammonium water, EDTA (C10H16N2O8), and monoammonium phosphate (NH4H2PO4) were analytical grade products from Shenyang Chemical Reagent Factory (Shenyang, China).
The LHN precursor was produced via titrating nitrate solution of the rare-earth with ammonium water (1 mol/L) at ~4 °C [Citation21]. For the phase conversion synthesis of phosphate, 0.5 mmol of LHN was dispersed in ~70 mL of deionized water, to which 1 mL of NH4H2PO4 solution (1 mol/L) was dropwise added, followed by magnetic stirring for 30 min and addition of a certain amount of EDTA. The resultant suspension was transferred into a Teflon-lined stainless steel autoclave of 100 mL capacity after magnetic mixing for 10 min, and the tightly sealed autoclave was then put into an electric oven preheated to a certain temperature for 24 h of reaction. After natural cooling to room temperature, the hydrothermal product was collected via centrifugation, washed with distilled water three times to remove byproducts, rinsed with absolute ethanol, and was finally dried in air at 70 °C for 24 h to yield a white powder for characterization and further processing. The effects of reaction parameters (Table ) were studied with (Gd0.95Eu0.05)PO4 as example.
Table 1. A summary of experimental parameters.
2.2. Characterization techniques
Crystal phases were identified by X-ray diffraction (XRD, Model PW3040/60, Philips, Eindhoven, The Netherlands, operated at 40 kV/40 mA), using nickel-filtered Cu-Kα radiation (λ = 0.15406 nm) and a scanning speed of 4.0o 2θ per minute. Morphology and microstructure of the products were analyzed by field emission scanning electron microscopy (FE-SEM, Model JSM-7001F, JEOL, Tokyo, Japan) at an accelerating voltage of 15 kV and transmission electron microscopy (TEM, FEM-3000F, JEOL) at 200 kV. Fourier transform infrared spectroscopy (FTIR, Nicolet iS5, Thermal Fisher Scientific, New York, NY, USA) was combined with the standard KBr sample preparation method. Thermogravimetry (TG, Model TAS-200, Rigaku, Tokyo, Japan) of the powder was carried out in flowing oxygen gas with a heating rate of 10 °C/min. Photoluminescence spectroscopy and fluorescence decay kinetics of the phosphors were analyzed at room temperature with an FP-8600 fluorospectrophotometer (JASCO, Tokyo, Japan).
3. Results and discussion
3.1. Characterization and formation mechanism of the nanowires
Powder XRD analysis of the precursor (Figure ) revealed a series of diffraction peaks that are characteristic of layered Ln2(OH)5NO3·nH2O (LHN) [Citation21–25]. The crystal structure of LHN is built up via alternative stacking of the hydroxide main layers (ab plane) and exchangeable interlayer NO3− along the c-axis. The occurrence of non-(00 l) diffractions thus indicates that the hydroxide layers are long-range ordered while the significantly broadened 00 l diffractions are owing to the thinness of the nanosheets, which are confirmed later by TEM analysis. The LHN diffractions are no longer observable for sample S1, implying that the hydroxide main layers have collapsed even after short (30 min) interaction with NH4H2PO4 at room temperature, as also seen from the results of morphology analysis (Figure ). The broadened and diffuse diffraction peaks of S1 cannot be indexed to any crystalline form of rare-earth orthophosphate, due to the high water content and significantly nanocrystalline nature of the product [Citation26]. Hexagonal GdPO4·1.5H2O (JCPDS File No. 00–021-0037, space group P3121) crystallized in sample S2 via consumption of the unidentifiable phase of S1, despite a short hydrothermal reaction of 3 h. Better crystallinity (gradually sharper XRD diffractions) was achieved for the hexagonal phosphate by prolonging the hydrothermal reaction up to 12 h (S2–S4). Though the 24 h product (S5) was retained as pure hexagonal phase, the 48 h product (S6) crystallized with a minor amount of monoclinic phosphate (JCPDS No. 01–083-0657, space group: P21/n) as impurity. The phase transition can be interpreted in view of thermodynamics, that is, the less stable hexagonal phase possesses higher free energy, which can be released to generate the stable monoclinic phase during prolonged hydrothermal reaction [Citation27].
Figure 1. Powder XRD patterns for the original LHN and the products of S1 (anion exchange at room temperature for 30 min) and S2–S6 (hydrothermally reacted at 150 °C for 3, 6, 12, 24, and 48 h, respectively). The EDTA/(Gd0.95Eu0.05)3+ molar ratio (R) is 0.5 for S2–S6. The black dots in the XRD pattern of S9 denote monoclinic phosphate.
Figure 2. FE-SEM (a), (c), (e), (f), (g) and TEM (b), (d), (h) micrographs showing morphologies of the LHN (a), (b) and the four typical samples of S1 (c), (d), S2 (e), S3 (f), and S5 (g), (h). The insets in (b), (d), (h) are the corresponding SAED pattern, HR-TEM lattice image, and Fourier transform diffraction pattern, respectively. Samples S2, S3, and S5 were synthesized with an EDTA/(Gd0.95Eu0.05)3+ molar ratio (R) of 0.5.
SEM and TEM images of the original LHN are presented in Figure (a) and (b), respectively. Micro-sized assemblies composed of LHN nanosheets (sputtered with gold for electrical conductivity) were clearly seen in Figure (a), while thicknesses of ~4 nm were observed for the primary nanosheets in Figure (b). Selected area electron diffraction (SAED, the inset in Figure (b)) clearly revealed the {220} and {620} planes, confirming that the hydroxide layers are well ordered as found via XRD. Interaction of LHN with the phosphate species dissociated from NH4H2PO4 at room temperature (sample S1) tends to disintegrate the hydroxide main layers into small particles (Figure (d)), though skeletons of the micron-sized assemblies were largely retained (Figure (c)). High-resolution TEM (HR-TEM) analysis (inset in Figure (d)) revealed that S1 has a crystalline structure, as evidenced by the well resolved lattice fringes with an inter-planar spacing of ~0.392 nm. Short-range crystallization (5–10 nm) was thus proposed to be the reason for the significantly broadened XRD peaks of S1 in Figure . Though the 3 h product (S2, Figure (e)) presents aggregates of needle-like particles, the 6 h product (S3, Figure (f)) and 24 h product (S5, Figure (g)) exclusively consist of monodispersed spicules. Longer reaction time favors Ostwald ripening and thus a more uniform particle morphology. Low-magnification TEM observation of S5 (Figure (h)) revealed that the particles have a length of about 300 nm and a width of about 10 nm. In view of the large aspect ratio (~30), the products can be ranked as nanowires. HR-TEM analysis (inset (1) in Figure (h)) indicates that each individual nanowire is well-crystallized with the (100) fringes running along the growth direction and spaced by 0.607 nm, and the (101) fringes can also be observed with a spacing of 0.442 nm. It can thus be figured out that the nanowire grows up along the [001] direction, as indicated by the arrow in the inset. Fourier transform of the lattice fringe yielded well-defined diffraction spots (inset (2) in Figure (h)), indicating a single crystalline nature of each nanowire. One conceivable advantage of this sacrificial precursor route is that the rare-earth cations are gradually released from the LHN nanosheets and also their skeletons (S1), which favors a more uniform morphology and better dispersion of the (Gd0.95Eu0.05)PO4·1.5H2O product.
The effects of EDTA on phase structure and morphology of the hydrothermal products were studied via altering the EDTA/RE3+ molar ratio R, and the results are shown in Figures and , respectively. It is seen from Figure that the EDTA-free product (S7) can be identified as hexagonal (Gd0.95Eu0.05)PO4·1.5H2O, though the diffraction peaks are broadened. Previous work showed that yttrium orthophosphate would crystallize in the tetragonal system (JCPDS No. 00–083-0658, space group: I41/amd) under similar hydrothermal conditions [Citation28], manifesting the decisive role of RE3+ size in phase selection. Increasing EDTA addition continuously improved crystallinity of the hydrothermal product, but did not alter phase purity (S8, S5, and S9, Figure ). The significant effects of EDTA can also be perceived through comparing morphologies of the products shown in Figure , where it is seen that the sample synthesized without EDTA (Figure (a), (b)) consists of agglomerates entangled from underdeveloped acicular particles while that made with a small amount of EDTA (R = 0.25) is composed of much better dispersed nanowires/nanorods with an aspect ratio of ~10 (Figure (c)). Increasing the ratio R to 0.5 led to monodispersed nanowires (Figure (g)), while significantly longer rods with larger diameters (aspect ratio: ~20–30) appeared in the product at the even larger R value of 0.75 (Figure (d)).
Figure 3. Powder XRD patterns for the products synthesized at the hydrothermal temperature of 150 °C and with EDTA/RE3+ molar ratio R of 0 (S7), 0.25 (S8), 0.5 (S5), and 0.75 (S9).
Figure 4. FE-SEM (a), (c), (d) and TEM (b) micrographs showing morphologies of the products obtained with EDTA/RE3+ molar ratio R of 0 (a, b; S7), 0.25 (c; S8), and 0.75 (d; S9).
The phase structure and crystal shape of a hydrothermal product are known to be synergistically determined by additives and crystallization habit [Citation29]. Lanthanide orthophosphates possess extremely low water solubility (solubility product is on the order of 10−25 to 10−27) [Citation30], and, accordingly, the S1 product would dissociate in an extremely low degree according to the following equation:
The addition of EDTA lowers the concentration of Gd3+/Eu3+ in the solution through chelation and thus right-shifts the equation, which speeds up the process of Ostwald ripening to yield the larger and better dispersed nanowires shown in Figures and (g). Meanwhile, EDTA may cap crystal surfaces, lowering the energy cost for creating new surfaces and hence also encouraging the formation of relatively dispersed crystals [Citation31]. It should be noted that the chelating ability of EDTA increases with increasing content (the R value), which enhances the dissolution of phosphate and lowers the nucleation rate. This is in accordance with our observation that increasing the R ratio from 0.25 to 0.75 yielded gradually larger particles and no solid particles could be obtained at the high R ratio of 1.
The hexagonal unit cell of GdPO4·nH2O (Figure (a), realized with the Vesta software [Citation32]) consists of three formula units, where two sets of oxygen atoms, differing in Gd-O bond length, are coordinated to Gd3+ to form GdO8 dodecahedron. As a result, the Gd3+ ions are residing at the distorted D2 crystallographic sites (Figure (b)) [Citation33]. Each phosphate group (PO4 tetrahedron) in the structure is coordinated to six Gd3+ to form P-Gd octahedron (Figure (c)), where the P atom assumes a C2 point symmetry [Citation34]. The crystal structure contains -Gd3+--Gd3+- chains running along the c axis to form open tunnels, where hydration water is accommodated (Figure (d)). Murphy et al. previously reported that the activation energy for the growth of hexagonal LnPO4 along the c-axis is lower than that perpendicular to the c-axis [Citation35], which may account for the crystallization of [001]-oriented (Gd,Eu)PO4·nH2O nanowires in this work (inset (1) in Figure (h)).
Figure 5. Schematic of the crystal structure of hexagonal GdPO4·nH2O (a), GdO8 dodecahedron (b), and P-Gd octahedron (c). (d) shows the open tunnels running through the structure along the c axis (oxygen atoms are omitted for clarity).
The effects of hydrothermal temperature on phase structure and morphology of the nanowires were investigated in Figure and Figure S1, respectively. It was found from Figure that the 120–180 °C products are all of the hexagonal phase while the even higher temperature of 200 °C induced partial crystallization of monoclinic phosphate (denoted with black dots). The reason is similar to that discussed for the effects of reaction time (Figure ). Although SEM (Figure S1(a), (b)) and TEM (Figure S1(d), (e)) observations revealed that the nanowires are less uniform in length and width for samples S10 and S11, SAED (insets in Figure S1(d), (e)) indicated that each individual wire is of single crystalline. Through morphology comparison, it is clear that 150 °C is the optimal hydrothermal temperature to generate nearly monodispersed nanowires.
Figure 6. Powder XRD patterns for the products synthesized at the different hydrothermal temperatures of 120 °C (S10), 150 °C (S5), 180 °C (S11), and 200 °C (S12). The EDTA/(Gd0.95Eu0.05)3+ molar ratio (R) is 0.5 in each case. The black dots in the pattern of S12 denote monoclinic phosphate.
3.2. Thermal behaviors of the nanowires
Thermal behaviors of the nanowires were investigated with sample S5 as example. Figure compares XRD patterns of the original nanowires (Figure (a)) and those calcined under flowing O2 at various temperatures for 2 h. It is seen that the hexagonal crystal structure can be well retained up to 500 °C (Figure (b)) while calcination to 600 °C led to partial crystallization of the monoclinic phase (JCPDS No. 01–083-0657; space group: P21/n; labeled in Figure (c) with black dots). TG analysis (Figure S2) showed that the sample completely dehydrates up to 570 °C via two major stages, with the first one (up to ~150 °C) due to evaporation of surface-adsorbed water, and the second one (150–570 °C) owing to the removal of hydration water. It can thus be inferred from Figure (c) and Figure S2 that complete dehydration tends to collapse the hexagonal structure or, in other words, the metastable hexagonal phase is stabilized by hydration water. The n value of the (Gd0.95Eu0.05)PO4·nH2O nanowires was determined to be around 1.0 from the total weight loss of 6.76%. Calcining to 900 °C caused full crystallization of the monoclinic phase (Figure (e)), and the higher temperature products (up to 1200 °C) remained as monoclinic phosphate. Improved crystallinity owing to crystal perfection and crystallite growth was observed with increasing temperature of calcination, as evidenced by the successively sharper and stronger XRD diffractions (Figure (f)–(h)). The monoclinic (Gd0.95Eu0.05)PO4 powders had average crystallite sizes of ~29, 37, 78, and 90 nm after calcination at 900, 1000, 1100, and 1200 °C, respectively, as estimated from the width of the (120) diffraction peak using the Scherrer formula.
Figure 7. Powder XRD patterns for sample S5 (a) and the products calcined from S5 at: (b) 500, (c) 600, (d) 800, (e) 900, (f) 1000, (g) 1100, and (h) 1200 °C. The black dots in (c) denote monoclinic phosphate.
Figure compares FTIR spectra of the nanowires before and after calcination, from which it can be seen that dehydration weakens the characteristic vibrations of water molecules (ν1 and ν3 at 3457 cm−1 and ν2 at 1624 cm−1). A characteristic profile of orthophosphate groups under C2 symmetry is observed in the IR spectra of the hexagonal phase (Figure (a), (b)). For C2 symmetry, each of the four absorption bands (ν1, ν2, ν3, and ν4) of is theoretically active [Citation34], as observed in this work for the P-O symmetric stretching (ν1, A) vibration as a weak band at ~964 cm−1, the P-O antisymmetric stretching (ν3, A + 2B) as an intense band centered at ~1072 cm−1, and the O-P-O antisymmetric deformation (ν4, A + 2B) bands in the 500–700 cm−1 region. The ν2 vibration is nonetheless too weak to be recorded, which is coinciding with the report of Hezel and Ross [Citation34]. The hexagonal to monoclinic phase conversion changes the crystallographic sites of
into the lower symmetry of C1, which allows better resolved vibrations [Citation36], as can be seen from Figure (c, d). The vibration region of
anions in the monoclinic (Gd0.95Eu0.05)PO4 calcined at 1200 °C presents ν1 vibration as a sharp band at ~964 cm−1, ν2 vibration as a shallow band at ~493 cm−1, ν3 stretching band as five observable components at ~1008, 1037, 1048, 1071, and 1106 cm−1, and ν4 vibration as several shallow absorptions with frequencies at ~549, 576, 584, and 629 cm−1. The above observations agree with the results of Kijkowska [Citation36].
Figure 8. FTIR spectra for sample S5 (a) and the products calcined from S5 at 500 (b), 900 (c), and 1200 °C (d).
Figure S3 shows typical FE-SEM morphologies of the calcination products. Although calcination at 500 °C did not affect phase purity of the hexagonal (Gd0.95Eu0.05)PO4·nH2O compound, a slight collapse of the nanowires happened (Figure S3(a)). Calcining to 600 °C induced substantial destruction of the 1D morphology, mainly owing to dehydration. The original nanowire morphologies are hardly observable for the 900 and 1000 °C products because of the re-constructive type hexagonal→monoclinic phase transition. Abrupt particle coarsening took place at 1100 °C, which corresponds well to the results of crystallite analysis (37.6 and 77.5 nm at 1000 and 1100 °C, respectively).
The Tb3+ doped nanowires of (Gd0.95Tb0.05)PO4·nH2O were also synthesized under the conditions used for sample S5. XRD analysis (Figure S4) and FE-SEM observation (Figure S5) indicated that (Gd0.95Tb0.05)PO4·nH2O similarly crystallized as hexagonal nanowires, and phase purity and the 1D morphology were well retained after 500 °C calcination.
3.3. Optical properties of the (Gd0.95Eu0.05)PO4 and (Gd0.95Tb0.05)PO4 phosphate phosphors
Since calcination at 600 °C induced partial crystallization of the monoclinic phase and substantial destruction of the 1D morphology of the nanowires, the Eu/Tb-doped hexagonal nanowires were annealed at 500 °C to investigate their luminescence properties. Figure shows photoluminescence excitation (PLE) and photoluminescence (PL) spectra for the hexagonal (Gd0.95Eu0.05)PO4·nH2O and (Gd0.95Eu0.05)PO4. The band observed at ~240 nm in the PLE spectra corresponds to the excitation of electrons from the 2p orbital of O2- in the PO43- group to the 4f orbital of Eu3+, which is known as charge transfer. The weak shoulder at ~272 nm is attributed to the 8S7/2→6IJ intra-4f7 transition of Gd3+. The intra-4f6 transitions of Eu3+ were observed at ~318 nm for the 7F0,1→5H3/5H6, 363 nm for the 7F0,1→5D4, 378 nm for the 7F0,1→5L7, 396 nm for the 7F0,1→5L6, and 448 nm for the 7F0,1→5D2 transitions, as labeled in the figure. Upon UV excitation at 240 nm, the two hexagonal phosphates exhibit emissions ranging from 500 to 750 nm, which are associated with transitions from the excited 5D0 state to the 7FJ (J = 1–4) ground states of Eu3+ as labeled in the figure, with the 5D0→7F4 transition (~697 nm) being the most prominent. Intensity of both the PLE and PL bands were greatly enhanced by calcination at 500 °C, owing to significant dehydration (Figure S2) and elimination of luminescence-quenching defects such as surface dangling bonds and particularly hydroxyls [Citation5].
Figure 9. PLE and PL spectra of sample S5 and its product calcined at 500 °C. CT stands for charge transfer.
The relative intensities of transitions from the 5D0 excited state to the different J levels of the ground state depend on the site symmetry of Eu3+ and can be described in terms of the Judd-Ofelt theory, which predicts that the 5D0→7F1,3 magnetic dipole transition is permitted while the 5D0→7F0,2,4 electric dipole transition is forbidden, and the latter is allowed only on condition that the Eu3+ ions occupy a site without an inversion center [Citation37,38]. As mentioned above, the Eu3+ ions are expected to replace Gd3+ to inherit the centrosymmetric D2 point symmetry in hexagonal (Gd0.95Eu0.05)PO4·nH2O and (Gd0.95Eu0.05)PO4. The abnormally strong 5D0→7F2,4 emissions observed for the above two phosphates (Figure ) may be understood from the Ωλ intensity parameter. It is known that the intensities of the 5D0→7F2 and 5D0→7F4 transitions are governed by the effective operators of Ω2U(2) and Ω4U(4), respectively, where U(λ) is the unit tensor operator [Citation39]. Nanomaterials generally show lattice distortions, unlike bulk crystals, and hence it is plausible to say that in this work the Eu3+ activators have a lower site symmetry distorted from D2. The distortion may make the ligand field-/polarizability-related parameters larger, and thus enlarges the Ω2,4 parameters to lead to the strong 5D0→7F2 and particularly 5D0→7F4 electric dipole transitions [Citation40].
The excitation and emission behaviors of Tb3+ in the hexagonal phosphates of (Gd0.95Tb0.05)PO4·nH2O and (Gd0.95Tb0.05)PO4 are studied in Figure . The excitation spectra of the two samples recorded by monitoring the 5D4→7F5 green emission at 546 nm consist of two bands in the short UV region (up to 300 nm) for the low-spin inter-configurational 4f8→4f75d1 transition of Tb3+ (LS, at ~211 nm) and the 8S7/2→6IJ intra-4f7 transition of Gd3+ (at ~272 nm) [Citation23]. The other bands in the longer UV region of 300–400 nm arise from intra-4f8 excitation transitions of Tb3+, as labeled in the figure. The whole excitation spectrum is dominated by the LS transition at 211 nm. The PL spectra obtained under 211 nm excitation consist of emissions ranging from 450 to 700 nm, which are associated with transitions from the excited 5D4 state to the 7FJ (J = 3–6) ground states. The strongest emission is located at ~546 nm (5D4→7F5 transition), typical of a green color. The hexagonal (Gd0.95Eu0.05)PO4 and (Gd0.95Tb0.05)PO4 anhydrous nanowires, with enhanced luminescence and favorable dispersity, may find applications in the fields such as biolabeling, optoelectronics, and sensing [Citation41].
Figure 10. PLE and PL spectra of (Gd0.95Tb0.05)PO4·nH2O and its product calcined at 500 °C.
PLE/PL spectra of the calcination-derived (Gd0.95Eu0.05)PO4 monoclinic phosphates are presented in Figure . It is seen that both the excitation and emission intensities steadily increase with increasing temperature of calcination. The increment from 1000 to 1100 °C is the most prominent, which corresponds well to the greatly enhanced crystallization observed from Figure . In monoclinic GdPO4, Yaiphaba et al. reported that the Eu3+ ion is surrounded by nine oxygen atoms to form EuO9 with different Eu-O bond lengths, residing at the highly asymmetric C1 site [Citation42]. This agrees with the presence of 5D0→7F0 transition (inset in Figure ).
Figure 11. PLE and PL spectra of the monoclinic products calcined from sample S5 at the various temperatures indicated in the figure.
The energy transfer from Gd3+ to Eu3+ was analyzed for the 1000 °C sample through exciting the 8S7/2→6IJ transition of Gd3+ at 272 nm, and the resultant PL spectrum, which consists of the characteristic 5D0→7FJ (J = 1–4) emissions of Eu3+, is shown in Figure S6(a). The process of energy transfer involved in Eu3+ emission is schematically shown in Figure S6(b). That is, exciting the (Gd0.95Eu0.05)PO4 phosphor at 272 nm raises electrons from the 8S7/2 ground state to the 6IJ energy level of Gd3+, followed by relaxation to the 6P7/2 level. The 6P7/2 electrons first relax to the higher 5DJ (J = 1, 2, 3) excited states of Eu3+, followed by further relaxation to the lowest-lying 5D0 excited level in a rapid non-radiative way. Subsequently, f–f transitions of Eu3+ take place from the 5D0 state to the 7FJ (J = 0, 1, 2, 3, 4) ground states. Tb3+ emissions enabled by Gd3+→Tb3+ energy transfer were similarly achieved, as seen in Figure S7(a), (b).
Fluorescence decay kinetics of the 593 nm red emission of Eu3+ and the 546 nm emission of Tb3+ have been investigated under 240 nm (for Eu3+) and 211 nm (for Tb3+) excitations, and the results are presented in Figure S8(a) and (b), respectively. The decay curves can be well fitted with the single-exponential function of I = Aexp (−t/τ) + B, where τ is the fluorescence lifetime, t the delay time, I the relative intensity, and A and B are constants. It is seen from Figure S8(a) that the lifetime of Eu3+ was increased continuously from ~3.66 to 6.70 ms by calcination up to 1100 °C and then decreased to ~4.66 ms after 1200 °C calcination. The constant increase is primarily owing to the removal of luminescence-quenching defects and surface species, while the subsequent decrease is mainly due to increased effective refractive index of the phosphor by significant crystallite/particle coarsening [Citation43]. Slight lifetime elongation by calcination was also observed for the Tb3+ emission. The emission of Eu3+ under 240 nm excitation was calculated from Figures and to have Commission internationale de l’éclairage (CIE) chromaticity coordinates of around (0.63, 0.36) for the 150 °C hydrothermal and 500 °C calcination products, (0.62, 0.36) for the 900 °C, (0.62, 0.38) for the 1000 °C, and (0.61, 0.39) for the 1100 and 1200 °C calcination products (Figure (a)–(f)). The color coordinates slightly yet steadily shift to the orange color region for the sample calcined at a higher temperature (a–f, arrow direction), owing to faster intensity increase of the 5D0→7F1 orange-red emission than the 5D0→7F2,4 red emissions as inferred from the intensity ratio of these transitions (Figure S9). The two Tb3+ containing samples were calculated to have the same CIE chromaticity coordinates of about (0.37, 0.54), falling in the green area of the diagram (points g and h).
Figure 12. CIE chromaticity diagram for the emissions of Eu3+ (a)–(f) and Tb3+ (g), (h) in gadolinium phosphates.
4. Conclusions
Hexagonal (Gd0.95RE0.05)PO4·nH2O (RE = Eu, Tb) nanowires have been hydrothermally converted from the nanosheets of layered rare-earth hydroxyl nitrate. The nanowires were determined to grow along the [001] crystallographic direction, and EDTA was found to play a decisive role in morphology evolution of the nanowires. Both the hexagonal structure and nanowire morphology can be retained after calcination at 500 °C, and monoclinic (Gd0.95Eu0.05)PO4 emerges as a pure phase at 900 °C. The Eu3+ and Tb3+ activators exhibit their characteristic 5D0→7FJ and 5D4→7FJ emissions under excitation with peak wavelengths of the O2−→Eu3+ charge transfer and low-spin 4f8→4f75d1 transition bands, respectively. The abnormally strong 5D0→7F4 electric dipole Eu3+ emission in the hexagonal phosphates was ascribed to the site distortion. Exciting the Gd3+ ions in the host lattice with the 8S7/2→6IJ transition at ~272 nm also produces the characteristic emissions of Eu3+ and Tb3+, owing to Gd3+→Eu3+/Tb3+ energy transfer.
Disclosure statement
No potential conflict of interest was reported by the authors.
Funding
Z.H. Wang acknowledges financial support from the China Scholarship Council for his overseas PhD study [Contract No. 201606080030]. This work was supported in part by the National Natural Science Foundation of China [grant number 51672039], the Fund of the State Key Laboratory of Advanced Technologies for Comprehensive Utilization of Platinum Metals [SKL-SPM-201505], and the Fundamental Research Funds for the Central Universities [Grants No. N160206001; N160204008].
Supplemental data
The supplemental material for this paper is available online at https://doi.org/10.1080/14686996.2017.1338495.
Supplementary_information.doc
Download MS Word (2.7 MB)Related Research Data
References
- Wang ZL. Characterizing the structure and properties of individual wire-like nanoentities. Adv Mater. 2000;12:1295–1298.10.1002/(ISSN)1521-4095
- Xia YN, Yang PD, Sun YG, et al. One-dimensional nanostructures: synthesis, characterization, and applications. Adv Mater. 2000;15:353–389.
- Wang X, Sun XM, Yu DP, et al. Rare earth compound nanotubes. Adv Mater. 2003;15:1442–1445.10.1002/(ISSN)1521-4095
- Wang X, Li YD. Synthesis and characterization of Lanthanide Hydroxide single-crystal nanowires. Angew Chem Int Ed. 2002;41:4790–4793.10.1002/(ISSN)1521-3773
- ZH Wang, J-G Li, Q Zhu, et al. Tartrate promoted hydrothermal growth of highly [001] oriented (La0.95-xBixEu0.05)PO4 (x=0-0.01) nanowires with enhanced photoluminescence. Mater Des. 2017;126:115–122.
- Wang X, Li YD. Rare-Earth-Compound nanowires, nanotubes, and fullerene-like Nanoparticles: synthesis, characterization, and properties. Chem Eur J. 2003;9:5627–5635.10.1002/(ISSN)1521-3765
- Meiser F, Cortez C, Caruso F, et al. Biofunctionalization of fluorescent rare-earth-doped Lanthanum Phosphate Colloidal Nanoparticles. Angew Chem Int Ed. 2004;43:5954–5957.10.1002/(ISSN)1521-3773
- Lehmann O, Meyssamy H, Kompe K, et al. Synthesis, growth, and Er3+ luminescence of lanthanide phosphate Nanoparticles. J Phys Chem B. 2003;107:7449–7453.10.1021/jp030012h
- Wang M, Li M, Yang MY, et al. NIR-induced highly sensitive detection of latent fingermarks by NaYF4:Yb, Er upconversion Nanoparticles in a dry powder state. Nano Res. 2015;8:1800–1810.10.1007/s12274-014-0686-6
- Yang J, Li CX, Cheng ZY, et al. Size-tailored synthesis and luminescent properties of one-dimensional Gd2O3: Eu3+ nanorods and microrods. J Phys Chem C. 2007;111:18148–18154.10.1021/jp0767112
- Mao CB, Li HD, Cui FZ, et al. The functionalization of titanium with EDTA to induce biomimetic mineralization of hydroxyapatite. J Mater Chem. 1999;9:2573–2582.10.1039/a901309a
- Huang P, Chen DQ, Wang YS. Host-sensitized multicolor tunable luminescence of lanthanide ion doped one-dimensional YVO4 nano-crystals. J Alloy Compd. 2011;509:3375–3381.10.1016/j.jallcom.2010.12.069
- Fang YP, Xu AW, Song RQ, et al. Systematic synthesis and characterization of single-crystal Lanthanide Orthophosphate nanowires. J Am Chem Soc. 2003;25:16025–16304.10.1021/ja037280d
- Schuetz P, Caruso F. Electrostatically assembled fluorescent thin films of rare-earth-doped Lanthanum Phosphate Nanoparticles. Chem Mater. 2002;14:4509–4516.10.1021/cm0212257
- Li J-G, Li XD, Sun XD, et al. Monodispersed colloidal spheres for uniform Y2O3: Eu3+ red-phosphor particles and greatly enhanced luminescence by simultaneous Gd3+ doping. J Phys Chem C. 2008;112:11707–11716.10.1021/jp802383a
- Li JK, Li J-G, Liu SH, et al. Greatly enhanced Dy3+ emission via efficient energy transfer in gadolinium aluminate garnet (Gd3Al5O12) stabilized with Lu3+. J Mater Chem C. 2013;1:7614–7622.10.1039/c3tc31413h
- Zhang LH, Yin ML, You HP, et al. Mutifuntional GdPO4:Eu3+ hollow spheres: synthesis and magnetic and luminescent properties. Inorg Chem. 2011;50:10608–10613.10.1021/ic200867a
- Huang C-C, Lo Y-W, Kuo W-S, et al. Facile preparation of self-assembled hydrogel-like GdPO4·H2O nanorods. Langmuir. 2008;24:8309–8313.10.1021/la800847d
- Yu LX, Li DC, Yue MX, et al. Dependence of morphology and photoluminescent properties of GdPO4: Eu3+ nanostructures on synthesis condition. Chem Phys. 2006;326:478–482.10.1016/j.chemphys.2006.03.008
- Guo H, Li F, Wei RF, et al. Elaboration and luminescent properties of Eu/Tb co-doped GdPO4-Based glass ceramics for white LEDs. J Am Ceram Soc. 2012;95:1178–1181.10.1111/j.1551-2916.2012.05097.x
- Wu XL, Li J-G, Zhu Q, et al. One-step freezing temperature crystallization of layered rare-earth hydroxide (Ln2(OH)5NO3·nH2O) nanosheets for a wide spectrum of Ln (Ln = Pr-Er, and Y), anion exchange with fluorine and sulfate, and microscopic coordination probed via photoluminescence. J Mater Chem C. 2015;3:3428–3437.10.1039/C4TC02681K
- Gandara F, Perles J, Snejko N, et al. Layered rare-earth hydroxides: a class of pillared crystalline compounds for intercalation chemistry. Angew Chem Int Ed. 2006;45:7998–8001.10.1002/(ISSN)1521-3773
- Geng FX, Matsushita Y, Ma RZ, et al. General synthesis and structural evolution of a layered family of Ln(8)(OH)(20)Cl-4·nH(2)O (Ln = Nd, Sm, Eu, Gd, Tb, Dy, Ho, Er, Tm, and Y). J Am Chem Soc. 2008;130:16344–16350.10.1021/ja807050e
- Zhu Q, Li J-G, Zhi CY, et al. Layered rare-earth hydroxides (LRHs) of (Y1-xEux)2(OH)5NO3·nH2O (x = 0-1): structural variations by Eu3+ doping, phase conversion to oxides, and the correlation of photoluminescence behaviors. Chem Mater. 2010;22:4204–4213.10.1021/cm1011586
- Lu B, Li J-G, Sun XD, et al. Effects of Gd substitution on sintering and optical properties of highly transparent (Y0.95-xGdxEu0.05)(2)O(3) Ceramics. J Am Ceram Soc. 2015;98:2480–2487.10.1111/jace.2015.98.issue-8
- Wang ZH, Li J-G, Zhu Q, et al. Sacrificial conversion of layered rare-earth hydroxide (LRH) nanosheets into (Y1−xEux)PO4 nanophosphors and investigation of photoluminescence. Dalton Trans. 2016;45:5290–5299.10.1039/C5DT01983D
- Yang M, You HP, Jia G, et al. Selective synthesis of hexagonal and monoclinic LaPO4:Eu3+ nanorods by a hydrothermal method. J Cryst Growth. 2009;311:4753–4758.10.1016/j.jcrysgro.2009.09.027
- ZH Wang, J-G Li, Q Zhu, et al. Hydrothermal conversion of layered hydroxide nanosheets into (Y0.95Eu0.05)PO4 and (Y0.96-xTb0.04Eux)PO4 (x = 0-0.10) nanocrystals for red and color-tailorable emission. RSC Adv. 2016;6:22690–22699.10.1039/C6RA00434B
- Yan RX, Sun XM, Wang X, et al. Crystal structures, anisotropic growth, and optical properties: controlled synthesis of Lanthanide Orthophosphate one-dimensional nanomaterials. Chem Eur J. 2005;11:2183–2195.10.1002/(ISSN)1521-3765
- Firsching FH, Brune SN. Solubility products of the trivalent rare-earth phosphates. J Chem Eng Data. 1991;36:93–95.10.1021/je00001a028
- Deng H, Liu CM, Yang SH, et al. Additive-Mediated splitting of Lanthanide Orthovanadate Nanocrystals in water: morphological evolution from rods to sheaves and to spherulites. Cryst Growth Des. 2008;8:4432–4439.10.1021/cg800207z
- Momma K, Izumi F. VESTA: a three-dimensional visualization system for electronic and structural analysis. J Appl Crystallogr. 2008;41:653–658.10.1107/S0021889808012016
- Geng DL, Shang MM, Yang DM, et al. Tunable luminescence and energy transfer properties in KCaGd(PO4)(2):Ln(3+)/Mn(2+) (Ln = Tb, Dy, Eu, Tm; Ce, Tb/Dy) phosphors with high quantum efficiencies. J Mater Chem. 2012;22:23789–23798.10.1039/c2jm34991d
- Hezel, A, Ross, SD. Forbidden transitions in infra-red spectra of teterhedral anions 3. spectra-structure correlations in perchlorates sulphates and phosphates of formular MXO4. Spectrochim Acta. 1996;22:1949–1961.
- Murphy KE, Altman MB, Wunderlich B. Monoclinic-to-trigonal transformation in selenium. J Appl Phys. 1977;48:4122–4131.10.1063/1.323439
- Kijkowska R, Cholewka E, Duszak B. X-ray diffraction and Ir-absorption characteristics of lanthanide orthophosphates obtained by crystallisation from phosphoric acid solution. J Mater Sci. 2003;38:223–228.10.1023/A:1021188810349
- Li YH, Hong GY. Synthesis and luminescence properties of nanocrystalline Gd2O3: Eu3+ by combustion process. J Lumin. 2007;124:297–301.10.1016/j.jlumin.2006.03.016
- Judd BR. Optical absorption intensities of rare-earth ions. Phys Rev. 1962;127:750–761.10.1103/PhysRev.127.750
- Gorller-Walrand C, Binnemans K. Handbook on the physics and chemistry of rare earths. Amsterdam (Netherlands): Elsevier Academic Press; 1998. Chapter 167, Spectral intensities of f-f transitions; p. 101–264.
- Sá Ferreiraa RA, Nobrea SS, Granadeirob CM, et al. A theoretical interpretation of the abnormal 5D0-7F4 intensity based on the Eu3+ local coordination in the Na9[EuW10O36]·14H2O polyoxometalate. J Lumin. 2006;121:561–567.10.1016/j.jlumin.2005.12.044
- Lu SZ, Zhang JH, Zhang JS, et al. Remarkably enhanced photoluminescence of hexagonal GdPO4·nH2O: Eu with decreasing size. Nanotechnol. 2010;21:365709.10.1088/0957-4484/21/36/365709
- Yaiphaba N, Ningthoujam RS, Singh NS, et al. Luminescence, lifetime, and quantum yield studies of redispersible Eu3+-doped GdPO4 crystalline nanoneedles: Core-shell and concentration effects. J Appl Phys. 2010;107:034301.10.1063/1.3294964
- Zhu Q, Li J-G, Ma RZ, et al. Well-defined crystallites autoclaved from the nitrate/NH4OH reaction system as the precursor for (Y, Eu)2O3 red phosphor: Crystallization mechanism, phase and morphology control, and luminescent property. J Solid State Chem. 2012;192:229–237.10.1016/j.jssc.2012.04.015