
 ?Mathematical formulae have been encoded as MathML and are displayed in this HTML version using MathJax in order to improve their display. Uncheck the box to turn MathJax off. This feature requires Javascript. Click on a formula to zoom.
Abstract
Hydrothermal reaction of Ln nitrate and Na2WO4 at pH=8 and 200 °C for 24 hours, in the absence of any additive, has directly produced the scheelite-type sodium lanthanide tungstate of NaLn(WO4)2 for the larger Ln3+ of Ln=La-Dy (including Y, Group I) and an unknown compound that can be transformed into NaLn(WO4)2 by calcination at the low temperature of 600 °C for the smaller Ln3+ of Ln=Ho-Lu (Group II). With the successful synthesis of NaLn(WO4)2 for the full spectrum of Ln, the effects of lanthanide contraction on the structural features, crystal morphology, and IR responses of the compounds were clarified. The temperature- and time-course phase/morphology evolutions and the phase conversion upon calcination were thoroughly studied for the Group I and Group II compounds with Ln=La and Lu for example, respectively. Unknown intermediates were characterized by elemental analysis, IR absorption, thermogravimetry, and differential scanning calorimetry to better understand their chemical composition and coordination. The photoluminescence properties of NaEu(WO4)2 and NaTb(WO4)2, including excitation, emission, fluorescence decay, and quantum efficiency of luminescence, were also comparatively studied for the as-synthesized and calcination products.
1. Introduction
Lanthanide tungstates are attracting much interest due to their remarkable properties such as high density and high threshold of mechanical, chemical, thermal, and optical damages, and are consequently finding wide applications in the fields of solid lasers, quantum electronics, scintillators, and so forth [Citation1–3]. The compounds may exhibit a wide emission band ranging from the visible to mid-infrared region, owing to the electronic transitions within the tungstate group, and are known as a type of self-activated luminescent material [Citation4]. With the W-O charge transfer and the efficient energy transfer from the tungstate group to the rare-earth activator, the compounds also serve as an outstanding family of host lattices for luminescence. The scheelite-type alkali lanthanide tungstate of ALn(WO4)2 (A: alkali ion; Ln: lanthanide) is an important member of the tungstate family, since it exhibits outstanding chemical and physical stabilities arising from its compact crystal structure and the unique luminescence properties inherited from the tungstate group [Citation5]. A handful of methodologies have been successfully employed for Ln tungstate synthesis [Citation6,7], but some important issues still need to be addressed. For example, the conventional solid reaction method usually requires a high temperature of up to 1300 °C to promote mass transfer between the Ln2O3 and tungstate sources, leading to overgrown particles of significant aggregation [Citation8,9]. The sol-gel technique, with Ln nitrate and ammonium tungstate as the frequent reactants, may lower the crystallization temperature of the aimed phase through better reactant mixing, but usually involves the complicated stages of sol formation, gelation, evaporation, and calcination [Citation6]. Durairajan et al. [Citation1] prepared NaGd(WO4)2 powder with a sol-gel procedure that comprises heating under stirring of the reaction system at 110 °C for 5 hours, pre-firing at 250 °C, and then a final firing at 800 °C. The product, nonetheless, is composed of aggregated particles. Ln tungstates have also been prepared via the molten salt technique, which employs Ln and tungsten oxides as the reactants and a salt with a relatively low melting point as the fluxing medium (for example, chloride or sulfate) [Citation6]. With NaCl and KCl as flux, Lei et al. [Citation10] obtained Gd2WO6 via molten salt reaction at 950 °C for 6 hours, but the particles are also aggregated, though the extent of aggregation is less than that of solid reaction. The hydrothermal route generally shows substantial advantages over the aforementioned techniques in that it allows better control of the crystallite size, size distribution, particle morphology, and composition of the product, and is thus one of the most commonly used techniques for Ln tungstate preparation [Citation6,11]. In addition, various chelates and surfactants (such as citric acid, ethylene diamine tetraacetic acid (EDTA), cetyltrimethyl ammonium bromide (CTAB), polyvinylpyrrolidone (PVP), ethylene glycol (EG), and oleic acid) have been tested to regulate the morphology of the hydrothermal product [Citation2,5,6]. Through hydrothermal reaction at 200 °C for 24 hours in the presence of a small amount of EDTA-2Na, Liu et al. [Citation12] obtained a product that can be transformed into NaLa(WO4)2 microspindles by annealing at 600 °C for 2 hours. The product morphology can also be tuned into microplates, nanocrystals, submicron dumbbells, and connected twin-microspheres by manipulating the amounts of EDTA-2Na and PVP. Dirany et al. [Citation13] synthesized NaCe(WO4)2 rods and hierarchical spindles via EDTA-assisted hydrothermal reaction at 200 °C for 24 hours and a subsequent calcination at 800 °C for 5 hours. Gu et al. [Citation14] obtained uniform shuttle-like NaLa(WO4)2 nanocrystals through solvothermal reaction at 180 °C for 16 hours, and the aspect ratio of the crystals was tuned from 3 to 9 by lowering the EG/water volume ratio from 4:1 to 1:4.
NaLn(WO4)2 is a frequently employed host in the field of luminescence [Citation15,16]. Through hydrothermal reaction at 160 °C for 10 hours and in the presence of oleic acid and oleylamine, Liu et al. [Citation12] fabricated a near-UV pumped white-light-emitting phosphor through optimizing the contents of Eu3+/Tb3+/Tm3+ activators in NaLa(WO4)2. With microwave-assisted hydrothermal reaction, Xu et al. [Citation17] prepared NaGd(WO4)2:Yb3+/(Tm3+, Ho3+) white up-conversion phosphors that are excitable by 980 nm laser. NaY(WO4)2:Tb3+ powders that show green emission (the 5D4→7F5 transition of Tb3+) under ultraviolet excitation were produced by Sun et al. [Citation2] through calcining at 600 °C for 2 hours the product synthesized via hydrothermal reaction at 200 °C for 24 hours. Relative to the host lattices of NaLn(WO4)2 (Ln=La, Gd, and Y), NaLu(WO4)2 is much less studied and its crystals are largely produced by the top seeded solution growth (TSSG) technique [Citation18–22]. Wang et al. [Citation23] fabricated NaLu1-xEux(WO4)2 (x=0.4-1.0) microcrystals through EDTA assisted hydrothermal reaction at 180 °C for 12 hours under neutral pH, but found that the tetragonal structure could not be retained when x<0.4 since the product would transform into a blend of unknown phases. That is, the synthesis of tetragonal NaLu(WO4)2 in a phase-pure form has failed.
A careful literature survey showed that the previous studies on the synthesis and luminescence application of NaLn(WO4)2 are largely restricted to the limited Ln members of La, Gd, and Y. We attempted in this work the hydrothermal crystallization of NaLn(WO4)2 for the full family of Ln (La-Lu, including Y) in the absence of any organic additive to reveal the intrinsic influence of lanthanide contraction on the phase and morphology evolution. It was found that single-phased NaLn(WO4)2 can all be directly produced via reaction at 200 °C for 24 hours under pH=8.0 for the larger Ln3+ ions of Ln=La-Dy (including Y) while the smaller ions of Ln=Ho-Lu crystallized as a deduced NaLn(WO4)2·2H2O intermediate that can be transformed into phase-pure NaLn(WO4)2 via calcination at the quite low temperature of 600 °C for 2 hours. This would be the first systematic study on NaLn(WO4)2 crystallization for the whole lanthanide family and also the first synthesis of tetragonal NaLu(WO4)2 as a pure phase via hydrothermal reaction, to the best of our knowledge. With these successes, the effects of lanthanide contraction on the structural features, crystal morphology, and IR absorption responses of NaLn(WO4)2 were clearly revealed. Taking Ln=La and Lu for example, the temperature- and time-course phase and morphology evolutions during hydrothermal reaction and subsequent calcination were thoroughly investigated, and the encountered intermediate phases were characterized in detail by the combined techniques of elemental analysis, Fourier transform infrared (FTIR) absorption, and thermogravimetry/differential scanning calorimetry (TG/DSC) to reveal their composition and local coordination. Photoluminescence of NaEu(WO4)2 and NaTb(WO4)2 was also investigated comparatively for the as-synthesized and calcination products. We believe that the outcome of this work may have wide implications to the study and application of lanthanide tungstates.
2. Experimental procedure
2.1. Hydrothermal synthesis
The tungsten and lanthanide (Ln) sources are sodium tungstate dihydrate (Na2WO4·2H2O, analytical grade), Ln(NO3)3·6H2O (Ln=La-Ho and Y, 99.99% pure), and Ln2O3 (Ln=Er-Lu, 99.99% pure). All the chemicals were purchased from Kanto Chemical Co., Inc. (Tokyo, Japan). The aqueous solution of Ln3+ (0.1 mol/L) was prepared separately by dissolving the nitrate and oxide in a proper amount of distilled water and nitric acid, respectively, followed by dilution.
In a typical procedure for NaLn(WO4)2 synthesis, 6 mL of an aqueous solution of Na2WO4·2H2O (1.0 mol/L for WO42-) was added dropwise into 20 mL of the aqueous solution of Ln3+ at room temperature under magnetic stirring (WO42-/Ln3+=3:1 molar ratio), followed by adjusting the mixture to pH=8 with dilute NaOH or HNO3 solution while keeping the volume of the mixture at 70 mL. After homogenizing under constant stirring for 30 minutes, the mixture was transferred to a Teflon-lined stainless steel autoclave of 100 mL capacity for 24 hours of hydrothermal reaction in an electric oven preheated to a certain temperature. After natural cooling to room temperature, the hydrothermal product was collected via centrifugation, washed with distilled water three times, rinsed with absolute ethanol once, and then dried in an air oven at 70 °C for 24 hours. Calcination of the hydrothermal products was performed in stagnant air at a predetermined temperature for 2 hours, with a heating rate of 5 °C/min at the ramp stage of heating. Our repeated experiments produced the same results, indicating that the experimental procedure reported herein is highly reliable.
2.2. Characterizations
Phase identification was performed by X-ray diffractometry (XRD, Smart Lab3, Rigaku, Tokyo, Japan) under 40 kV/40 mA, using nickel filtered Cu-Kα radiation (wavelength: 1.5406 Å) and a scanning speed of 4.0o 2θ min−1. Morphology of the products was analyzed by field emission scanning electron microscopy (FE-SEM, model S-4800, Hitachi, Tokyo, Japan) under an acceleration voltage of 10 kV and transmission electron microscopy (TEM, JEM-2100F, JEOL, Tokyo, Japan) at 200 kV. Cation contents of the products were determined via inductively coupled plasma (ICP) spectroscopy for W and Ln on an IRIS Advantage analyzer (Jarrell-Ash Japan, Kyoto) and for Na on an SPS3520UV-DD instrument (SII Technologies Inc., Tokyo). The oxygen content was assayed via combustion-infrared absorptiometry on a model TC-436 analyzer (LECO, St Joseph, MI). FTIR spectroscopy (Jasco, model 4200, Tokyo) was applied using the standard KBr method. TG/DSC (Thermal plus TG 8120, Rigaku) was performed in stagnant air with a heating rate of 10 °C/min. The photoluminescence and fluorescence decay kinetics of NaEu(WO4)2 and NaTb(WO4)2 were analyzed at room temperature with an FP-6500 fluorospectrophotometer (Jasco).
3. Results and discussion
3.1. Direct crystallization of NaLn(WO4)2 (Ln=La-Dy and Y)
Our foregoing experiments showed that pH and WO42-/Ln3+ molar ratio (R) are the two most influential factors in determining the phase structure of the hydrothermal product, and pH=8 and R=3 were found to be optimal for a facile crystallization of NaLn(WO4)2 under the fixed reaction conditions of 200 °C and 24 hours. A detailed account of the effects of these two parameters and the underlying mechanisms is underway. Figure shows the XRD patterns of the products obtained for the full series of Ln (including Y). It is clearly seen that the diffractions of Ln=La-Dy and Y can be fully indexed with the standard diffraction file of tetragonal structured NaLa(WO4)2 (JCPDS File No. 79-1118), indicating the direct crystallization of single-phased NaLn(WO4)2 compounds (Figure (a)). The sharp diffraction peaks further verify their excellent crystallinity. The Ln=Ho-Lu products (Figure (b)), however, could not be indexed to any known Ln or tungsten compound after a thorough survey of the JCPDS database and published literature. A careful examination of the XRD patterns of Ln=Er-Lu indicated that they are essentially the same, though there are variations in the relative intensity of the diffraction peaks and there is slight spectral shifting owing to the different ionic size of Ln3+. With Ln=Lu for example, we performed elemental, FTIR, and TG/DSC analyses for the unknown compound and concluded that it has the composition of NaLu(WO4)2·2H2O, which will be shown later. The Ho compound can be deduced to be a phase mixture of NaHo(WO4)2·2H2O and NaHo(WO4)2, whose major diffractions were indicated in the XRD pattern with filled triangles and filled circles, respectively.
Figure 1. XRD patterns for the hydrothermal products of (a) Ln=La-Dy and Y and (b) Ln=Ho-Lu. The standard diffractions of NaLa(WO4)2 are included in (a) as bars for comparison, and the d values (in Å) of the main diffractions of the Lu compound are shown in (b). The filled triangles and filled circles in the XRD pattern of the Ho product denote the Ho analogue of the Lu compound and NaHo(WO4)2, respectively.
The NaLn(WO4)2 compound has the scheelite-type tetragonal structure (space group: ), in which there are two different lattice sites occupied by the [Na+/La3+] pair (site occupancy: 0.35Na/0.65La and 0.63Na/0.37La; C2 point symmetry) and the [WO4]2- group has the S4 site symmetry [Citation24–26]. In this structure, tungsten is coordinated by four oxygen atoms at a tetrahedral site and the [La3+/Na+] site is coordinated eightfold by oxygen [Citation27,28], as shown in Figure S1. The cell parameters of the NaLa(WO4)2 obtained in this work was analyzed with the MDI Jade 6 software to be a=b=5.356(1) Å, c=11.662(1) Å, and V=334.54 Å3, which are close to the results of Huang et al. (a=b=5.354 Å and c=11.665 Å) [Citation29] and are also in close vicinity to the values of a=b=5.349 Å, c=11.628 Å, and V=332.7 Å3 in the standard diffraction file (JCPDS File No. 79-1118). The above structural parameters are affected by the type of Ln, which were analyzed later in Figure for the products calcined at 600 °C.
Taking Ln=La, for example, the temperature-course phase and morphology evolutions of the product were investigated for the same hydrothermal time of 24 hours, and the results are shown in Figures and , respectively. It is seen that the precipitate collected from the suspension before hydrothermal reaction is an amorphous mass (Figure (a)) of aggregated nanoparticles (Figure (a)). Autoclaving at a low temperature of 70 °C initiated the crystallization of an unknown phase (Figure (b)), and further crystallization via consuming the amorphous matrix was observed up to 150 °C (Figure (c)–(e)). The aimed NaLa(WO4)2 compound started to crystallize at the slightly higher temperature of 160 °C (Figure (f)), and above which phase-pure NaLa(WO4)2 resulted (Figure (g), (h)). FE-SEM observation of the 70 °C product revealed nanoparticles as the dominant component (the amorphous mass), with the presence of sparsely distributed platelike objects that can be assigned to the crystallized unknown compound (Figure (b)). The 80 °C product is composed of nanoparticles, dispersed flakes (up to ~800 nm), and ~20 μm sized spheres aggregated from thin flakes, which can be inferred from the results of XRD (Figure (c)) and Figure (a), (b) to be the amorphous mass for the former and the unknown phase for the latter two morphologies. Further crystallization of the unknown compound at 100 °C (Figure (d)) disintegrated the spheres, and irregularly shaped platelike crystallites of a wide size distribution (up to ~2 μm) were observed (Figure (d)). Considerable coarsening occurred for the unknown compound at 150 °C, leading to elongated and platelike crystallites of up to ~5 μm in size (Figure (e)). The 160 °C product has the three distinct morphologies of dispersed platelets (up to ~5 μm), up to ~20 μm sized spheres composed of platelets, and up to ~15 μm sized quasi-cubes (Figure (f)), while the phase-pure NaLa(WO4)2 samples obtained at the higher reaction temperatures of 180 and 200 °C exclusively contain cube-like crystallites of ~10–15 and 5–10 μm, respectively (Figure (g), (h)). It can thus be concluded from Figure (f) that the cubic objects observed in Figure (f) belong to NaLa(WO4)2 while the other two morphologies belong to the unknown compound. This is also evidenced by the fact that the dispersed and aggregated platelets (in the form of spheres) found in Figure (f) are almost identical to those in Figure (e). It is notable that the 200 °C product has smaller crystallite sizes, higher crystallinity (Figure (h)), better dispersion, higher uniformity, and more cubic shapes than the 180 °C product, for which 200 °C was later selected for the NaLn(WO4)2 synthesis of other lanthanides. As NaLa(WO4)2 was transformed from the unknown compound mentioned above, the smaller crystallites of the 200 °C product may possibly arise from a higher nucleation density.
Figure 2. XRD patterns for the products synthesized at the different temperatures of (a) room temperature, (b) 70, (c) 80, (d) 100, (e) 150, (f) 160, (g) 170, and (h) 200 °C. The d values (in Å) of the main diffractions are labelled in (e). The filled triangles and filled circles in (f) denote the unknown compound and NaLa(WO4)2, respectively.
Figure 3. FE-SEM micrographs showing morphologies of the products obtained at the different reaction temperatures of (a) room temperature, (b) 70, (c) 80, (d) 100, (e) 150, (f) 160, (g) 170, and (h) 200 °C.
We performed elemental analysis to better understand the unknown intermediate, and found that it contains 3.2(±0.1) wt% of Na, 19.7(±0.1) wt% of La, 52.1(±0.2) wt% of W, and 21(±1) wt% of O, which closely corresponds to a Na:La:W:O molar ratio of 1.0:1.0:2.0:9.4. The compound can thus be deduced to be NaLa(WO4)2·2H2O. TG/DSC analysis (Figure S2) illustrated three stages of weight loss for the unknown compound. The first weight loss of ~0.45% (up to ~150 °C), accompanied by a shallow endotherm at ~125 °C, is apparently due to the evaporation of adsorbed water. The other two stages, with weight losses of ~3.83% and 1.40% and accompanied by the endotherms peaked at ~170 and 300 °C, respectively, should be caused by the removal of hydration water. The observed total weight loss for this dehydration event (~5.23%) also coincides very well with the value of 5.18% calculated for NaLa(WO4)2·2H2O. This provides further evidence that the unknown intermediate would be NaLa(WO4)2·2H2O, although its crystal structure needs to be clarified.
It is very interesting to note that annealing the NaLa(WO4)2·2H2O intermediate in air at 350 °C for 2 hours directly produced phase-pure and well-crystallized NaLa(WO4)2 (Figure S3(c), (d)). This has been the lowest calcination temperature ever reported for the hydrothermal-assisted synthesis of NaLn(WO4)2, to the best of our knowledge. The amorphous precipitate before hydrothermal reaction, however, could not be converted into pure NaLa(WO4)2 even at the high annealing temperature of 1000 °C (Figure S3(a), (b)), which clearly demonstrates the merits of the hydrothermal technique. As the intermediate phase can be hydrothermal synthesized at the low temperature of ~100 °C (Figure (d)), it can thus serve as a convenient precursor for NaLa(WO4)2 preparation.
Figure compares the FTIR spectra of the NaLa(WO4)2·2H2O (Figure (a)) and NaLa(WO4)2 (Figure (b)) obtained at 150 and 200 °C, respectively. For NaLa(WO4)2, the absorptions at ~414 and 935 cm−1 are well documented to be due to symmetric bending vibration (ν4) and symmetric stretching vibration (ν1) of the [WO4]2- group, respectively [Citation13]. The ν3 vibration of [WO4]2- appears at ~719/798 cm−1 for the asymmetric stretching mode and at ~840 cm−1 for the symmetric stretching mode, which can be viewed as a result of splitting of the ν3 asymmetric stretching vibration of [WO4]2- (at ~816/774 cm−1) in the typical scheelite structure of CaWO4 due to the deformation of [WO4]2- tetrahedron by [Na+/La3+] replacement for Ca2+ [Citation4,30–32]. The NaLa(WO4)2·2H2O compound exhibits significantly split skeletal vibrations of [WO4]2- at ~414, 725, 815/862 (split from 840 cm−1 in Figure (b)), and 923/948 cm−1 (split from 935 cm−1 in Figure (b)), indicating that the [WO4]2- group has a lower site symmetry. The ~450 cm−1 band in Figure (a) can be assigned to La-O vibration, which overlaps with the [WO4]2- absorption in Figure (b). The existence of hydration water in the unknown intermediate compound is clearly evidenced by the strong absorption peaks located at ~1623 and 3413 cm−1, which are known to arise from the bending and stretching vibrations of water molecules, respectively [Citation33]. The bands at ~3525 and 605 cm−1 can be well assigned to the stretching and bending vibrations of hydroxyls, respectively [Citation34], while those at ~3135 and 1671 cm−1 are the characteristic vibration frequency of protons in the O–H pairs formed via hydrogen bonding, as observed from the salts of [HSO4]- and [HPO4]2- [Citation35–37]. The above results therefore suggest that the two water molecules have different coordination environments, and the compound may be better expressed as NaLa[(WO4)2H2O]·H2O or NaLa[(HWO4)2(OH)]·H2O.
Figure 4. A comparison of the FTIR spectra for (a) NaLa(WO4)2·2H2O and (b) NaLa(WO4)2, synthesized at 150 and 200 °C, respectively.
The time-course phase and morphology evolutions of NaLa(WO4)2 were studied at 200 °C and pH=8, and the results are presented in Figures S4 and S6, respectively. It is seen that the 1 hour product is essentially an amorphous mass of rounded nanoparticles, similar to the precipitate before hydrothermal reaction, though a trace amount of NaLa(WO4)2·2H2O is identifiable in the XRD pattern. Reaction for 2 hours crystallized the amorphous mass significantly and led to a phase mixture of NaLa(WO4)2 (cuboid crystals) and NaLa(WO4)2·2H2O (spherical aggregates of flakes), which is quite similar to the product obtained via reaction at 160 °C for 24 hours (Figures S5 and 3(f)). Prolonging the reaction to 3 hours produced NaLa(WO4)2 as the single phase (Figure S4). Though no change in the phase purity was found afterwards, FE-SEM observation indicated that a longer reaction time diminished the irregularly shaped blocks to produce more dispersed micro-crystals of better developed cubic shapes (Figure S6).
3.2. Transformation of the hydrothermal product into NaLn(WO4)2 via calcination (Ln=Er-Lu)
As stated earlier, hydrothermal reaction at 200 °C for 24 hours only yielded an unknown phase for the smaller Ln3+ ions of Ln=Er-Lu (a mixture of NaHo(WO4)2 and an unknown phase for Ho), which requires a subsequent calcination to produce NaLn(WO4)2. With Ln=Lu, for example, the phase evolution upon calcination was studied in Figure . It is clear that the compound exhibited higher diffraction intensities but no change in the pure purity up to 500 °C, followed by an almost complete transition to NaLu(WO4)2 at 550 °C (Figure (d)) and a complete transformation to NaLu(WO4)2 at 600 °C (Figure (e)). Elemental analysis of the unknown compound found 3.0(±0.1) wt% of Na, 23.8(±0.1) wt% of Lu, 50(±0.1) wt% of W, and 21(±1) wt% of O, which correspond well to a Na:Lu:W:O molar ratio of 1:1.07:2.07:10.07. The results thus suggest a chemical composition of NaLu(WO4)2·2H2O for the compound. The dehydration of NaLu(WO4)2·2H2O takes places via three stages accompanied by endotherms (Figure S7), analogous to NaLa(WO4)2·2H2O, but up to the very low temperature of ~180 °C (~130 °C lower than NaLa(WO4)2·2H2O, Figure S2). The observed weight loss for dehydration (~4.80%) is also in good agreement with the value (4.93%) calculated for NaLu(WO4)2·2H2O. The results of TG/DSC and XRD analyses thus clearly indicate that dehydration did not affect the crystal structure, and may imply that the water molecules are only loosely accommodated in it. As no significant weight loss was observed from ~200 to 900 °C, the exotherm peaked at ~585 °C on the DSC curve thus arises from a re-constructive phase transition from the NaLu(WO4)2 of an unknown crystal structure to tetragonal NaLu(WO4)2. Quite different from NaLa(WO4)2·2H2O, FTIR spectroscopy (Figure S8) of the as-synthesized NaLu(WO4)2·2H2O only resolved the bending and stretching vibrations of water molecules at 1646 and 3460 cm−1, respectively, suggesting the absence of the intramolecular hydrogen bonding observed for the former. This may account for the lower dehydration temperature of NaLu(WO4)2·2H2O than NaLa(WO4)2·2H2O. The different coordination manners of water molecules may arise from the different ionic sizes of La and Lu. FTIR also revealed quite different vibration behaviors for the [WO4]2- groups (Figures and S8) owing to the different crystal structures and local coordination, which need further efforts to clarify.
Figure 5. XRD patterns of (a) the unknown Lu compound and its products calcined at (b) 300, (c) 500, (d) 550, and (e) 600 °C for 2 hours. The standard diffractions of NaLu(WO4)2 are included as bars for comparison. The d values (in Å) of the main diffractions are given in (c) for the unknown compound.
3.3. Properties of the NaLn(WO4)2 (Ln=La-Lu and Y)
For a better illustration of the effects of lanthanide contraction on the structural features, the full series of NaLn(WO4)2 compounds (Ln=La-Lu and Y) were identically calcined at 600 °C for 2 hours and their XRD patterns are shown comparatively in Figure . It is seen that the compound is phase-pure in each case (Figure (a)) but the diffraction peaks shift successively to the higher angle side with decreasing ionic size of Ln, as shown in Figure (b) with the (112) main diffraction as an example. The lattice constants (a, c) and cell volume derived from the XRD data with the MDI Jade 6 software linearly decrease with decreasing ionic size of Ln (Figure ), conforming well to lanthanide contraction. Linear fitting of the data yielded slopes of ~1.0 and 2.6 for the a and c constants, respectively, indicating that the crystal structure would be significantly compressed along the c-axis with decreasing Ln3+ size.
Figure 6. XRD patterns of the NaLn(WO4)2 calcined at 600 °C for 2 hours (Ln=La-Lu and Y), with (a) and (b) for the 5–90o and 27.5–30o regions, respectively.
Figure 7. Correlation of lattice constants (a, c) and cell volume with the ionic radius of Ln3+ (CN=8) for the 600 °C calcined NaLn(WO4)2 (Ln=La-Lu and Y).
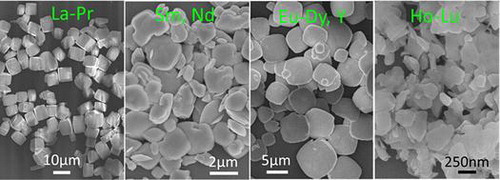
Figure shows the FE-SEM morphologies for the full series of NaLn(WO4)2 obtained in this work (Ln=La-Lu and Y), where those of Ln=La-Dy and Y are the direct hydrothermal products while the rest were calcined at 600 °C for 2 hours. It is clearly seen that the calcination products retained the overall morphologies of their respective precursors well (Figure S9). The observed morphologies across the lanthanide series can be roughly categorized into the four groups of: (1) uniform and monodispersed cuboids (~10 μm) for the largest ions of Ln=La, Ce, and Pr; (2) irregular blocks of ~2–6 μm for the second largest ions of Ln=Nd and Sm; (3) thick square-like flakes for the intermediately sized ions of Ln=Eu-Dy and Y (~200 nm in thickness and ~2–10 μm in edge-length); and (4) thin platelets for the small ions of Ln=Ho-Lu (up to ~50 nm in thickness and ~300–500 nm in lateral size). A general observation is that the thickness of the crystals decreases towards a smaller Ln3+. One possible reason is the gradually larger lattice distortion along the c-axis with decreasing Ln3+ size (Figure ), which restricts the crystal growth along this direction. TEM analysis found aggregated platelike NaLu(WO4)2 crystallites, similar to the results of FE-SEM observation (Figure (a)). In addition, some of the crystallites were found to have thicknesses of ~30–40 nm. Selected area electron diffraction (SAED) analysis of a single nanoplate yielded a set of well-defined sharp diffraction spots (Figure (b)), and those corresponding to the (112), (200), and (312) planes of tetragonal NaLu(WO4)2 can be unambiguously identified. HR-TEM analysis clearly resolved the lattice fringes of the (112) and (200) planes (Figure (c)), further revealing that the nanoflakes are well crystallized.
Figure 8. FE-SEM micrographs showing morphologies of the as-synthesized NaLn(WO4)2 (Ln=La-Dy and Y) and those obtained via calcination at 600 °C for 2 hours (Ln=Ho-Lu).
Figure 9. (a) Low-magnification TEM morphology, (b) SAED pattern, and (c) HR-TEM lattice image of the NaLu(WO4)2 calcined at 600 °C for 2 hours.
Figure shows FTIR spectra for the representative samples of NaLn(WO4)2 (Ln=La, Sm, Dy, Er, and Lu). Similar absorption bands were observed for [WO42-] in the ~400–1150 cm−1 region, but the individual peaks and the occurrence range of the absorptions gradually become sharper and narrower from La to Lu, respectively. Such a phenomenon has not been reported before to the best of our knowledge, and may be understood from the structural parameters shown in Figure . That is, the significantly faster shrinking c than a and b constants (a=b) along with decreasing ionic size from La to Lu would gradually aggravate the asymmetric deformation of [WO4]2- tetrahedrons. This would in turn successively lower the site symmetry of [WO4]2- in the crystal structure and thus lead to the observed IR absorption phenomena.
Figure 10. FT-IR spectra for the typical NaLn(WO4)2 of Ln=La, Sm, Dy, Er, and Lu.
Figure illustrates the PLE and PL spectra of the as-synthesized and 600 °C calcined NaEu(WO4)2. The excitation spectra obtained by monitoring the 616 nm Eu3+ emission (5D0→7F2, red) exhibited a series of bands ranging from 200 to 500 nm. The broad and weak band located at ~258 nm can be assigned to charge transfer (CT), that is, excitation of electrons from the completely filled 2p6 orbital of O2- to the partially filled 4f6 orbital of Eu3+ and the 5d empty orbital of W6+ within the [WO4]2- group. The two peaks at ~298 and 319 nm, overlapped with the CT band, are the 1A→3T2 and 1A1→3T1 excitation transitions of [WO4]2- [Citation38,39], whose occurrence indicates energy transfer from the [WO4]2- group to the Eu3+ activator ions [Citation31,40–42]. The other peaks in the 350–500 nm region and located at ~363, 383, 395, 416, and 465 nm correspond to the 7F0→5D4, 7F0→5L7, 7F0→5L6, 7F0→5D3, and 7F0→5D2 intra-4f6 transitions of Eu3+, respectively, with the 7F0→5L6 excitation at ~395 nm being the strongest. The PL spectra recorded in the range of 550–750 nm under 395 nm excitation show the characteristic Eu3+ emissions at ~593, 616, 655, and 702 nm that are originated from the 5D0→7Fj (j=1, 2, 3, 4) transitions of Eu3+ ions [Citation43], respectively. The Eu3+ activators take the non-centrosymmetric C2 sites in NaLa(WO4)2 [Citation44], and thus the parity forbidden 5D0→7F2 electric dipole transition (616 nm) is significantly stronger than the parity allowed 5D0→7F1 magnetic dipole transition (593 nm), as also observed by Wang et al. [Citation44–46]. Calcination did not bring about any appreciable change to the peak position but enhanced the intensities of the excitation and emission bands. The 616 nm red emission, for example, was enhanced by a factor of ~1.1 after 600 °C calcination. The asymmetry factor of Eu3+ emission (the (5D0→7F2)/(5D0→7F1) intensity ratio) was calculated to be ~10.34 and 10.44 for the as-synthesized and calcined NaLa(WO4)2, indicating that the local coordination environments of Eu3+ was not appreciably affected by the calcination.
Figure 11. PLE and PL spectra of the as-synthesized and calcined NaEu(WO4)2.
Figure illustrates the PLE and PL spectra of the as-synthesized and 600 °C calcined NaTb(WO4)2. The excitation spectra (Figure (a)) obtained by monitoring the 546 nm green emission of Tb3+ (5D4→7F5 transition) consist of two major components. The strong and broad band from 200 to ~310 nm, with a maximum at ~265 nm, can be assigned to [WO4]2-→Tb3+ charge transfer (CT) [Citation47], which is shouldered by the peak at ~319 nm that is attributed to the 1A1→3T1 excitation of the [WO4]2- group [Citation11]. The other peaks in the ~325–400 nm region and located at ~341, 353, 359, 370, and 379 nm are the intra-4f8 excitations of Tb3+, which correspond to the transitions from the 7F6 ground state to the 5G2, 5D2, 5G5, 5G6, and 5D3 excited states of Tb3+, respectively [Citation48]. As shown in Figure (b), similar PL spectra were obtained under excitation with the wavelengths of 265 nm (CT band) and 379 nm (7F6→5D3 transition), and the emission peaks located at ~490, 546, 588, and 622 nm are arising from the 5D4→7F6, 5D4→7F5, 5D4→7F4, and 5D4→7F3 transitions, respectively [Citation47], with the green emission at ~546 nm being dominant. Comparing Figures and reveals that the efficiency of [WO4]2- → Tb3+ energy transfer is much higher than that of [WO4]2- → Eu3+, as also reported by Liu et al. and Liao et al. [Citation40,49], owing to a better matching of the emission and excitation energy levels of [WO4]2- and Tb3+, respectively. It can also be observed that calcination at 600 °C dramatically enhanced the intensity of the CT band and the emission under CT excitation. Taking the 546 nm green emission, for example, the calcined powder has an emission intensity ~2.2 times that of the as-synthesized NaTb(WO4)2 under 265 nm excitation. The results also indicate that calcination improves the efficiency of energy transfer more significantly rather than the 7F6→5D3 intra-4f8 excitation transition. There are two possible reasons for such a phenomenon. One is that the [WO4]2- tetrahedrons have been better developed and better coordinated to the Tb3+ centers, and the other is that the lattice defects having energy levels lying in between those of the excited states of [WO4]2- and the 5D3 excited state of Tb3+ have been significantly eliminated. As a result, the efficiency of [WO4]2-→Tb3+ energy transfer was greatly improved by the calcination.
Figure 12. PLE and PL spectra of the as-synthesized and calcined NaTb(WO4)2.
The fluorescence decay kinetics of the 616 nm emission of NaEu(WO4)2 and the 546 nm emission of NaTb(WO4)2 were investigated at room temperature, and the results are shown in Figure S10. The decay curve can be fitted with the single exponential equation of I = A exp (-t/τ) + B in each case, where τ is the fluorescence lifetime, t the delay time, I the relative intensity, and A and B are constants [Citation50]. The results of fitting yielded the lifetime of ~0.90 ms for both the as-synthesized and 600 °C calcined NaEu(WO4)2 under 395 nm excitation (Table ), which is longer than the 0.49 and 0.54 ms reported for the 4.9 at% Eu3+ doped NaGd(WO4)2 single crystal and 10 at% Eu3+ doped NaLa(WO4)2 microcrystals (λex=394 nm, λem=610 nm), respectively [Citation5,51]. The similar lifetime values of ~0.75/0.79 ms were determined for the as-synthesized while ~0.89/0.88 ms for the 600 °C calcined NaTb(WO4)2 under 265/379 nm excitations, respectively (Table ), which are slightly shorter than the 1.03 and 0.92 ms reported for the 15 and 3 at% Tb3+ doped NaGd(WO4)2 (λex=270 nm, λem=545 nm), respectively [Citation47,48]. The fluorescence lifetime of a phosphor is known to be significantly affected by the various factors of lattice defects, crystallinity, luminescence quenching species, particle/crystallite size, and so forth. Our results revealed that calcination did not substantially affect the fluorescence lifetime of NaEu(WO4)2 and NaTb(WO4)2.
Table 1. Fluorescence lifetime (τ) and external/internal quantum efficiency of luminescence (ηex/ηin) for the as-synthesized and 600 °C calcined NaEu(WO4)2 and NaTb(WO4)2 powders.
The external/internal quantum efficiencies of luminescence (ηex/ηin, in percentage) are summarized in Table . It is seen that the as-synthesized and 600 °C calcined NaEu(WO4)2 powders have similar ηex/ηin values of ~23.9/69.4 and 23.1/66.2 under 395 nm excitation, respectively. For NaTb(WO4)2, the ηex/ηin values were determined to be ~37.7/68.7 and 46.0/82.8 under 265 nm excitation and ~14.8/46.3 and 13.5/31.8 under 379 nm excitation for the as-synthesized and 600 °C calcined powders, respectively. Under 265 nm excitation, the ~21% increment in both ηex and ηin by calcination is in accordance with the excitation/emission enhancement observed in Figure .
4. Conclusions
Hydrothermal reaction at 200 °C and pH=8 directly produced the sodium lanthanide tungstate of NaLn(WO4)2 for the larger Ln3+ of Ln=La-Dy and Y and an unknown compound, deduced to be NaLn(WO4)2·2H2O, that can be transformed into NaLn(WO4)2 for the smaller Ln3+ of Ln=Ho-Lu. The lattice constants (a and c) and cell volume of NaLn(WO4)2 linearly decrease with decreasing ionic size of Ln3+ from La to Lu. The significantly faster decreasing c parameter results in asymmetric deformation of the [WO4]2- tetrahedrons, leading to lowered site symmetry and thus sharper peaks and a narrowed range of IR absorption for the [WO4]2- groups in the NaLn(WO4)2 of a smaller Ln3+. The crystal morphology across the NaLn(WO4)2 series was observed to change from uniform and monodispersed cuboids (Ln=La, Ce, and Pr) to irregular blocks (Ln=Nd and Sm), then to thick square-like flakes (Ln=Eu-Dy and Y), and finally to nanoplates (Ln=Ho-Lu), which finely manifests the effects of lanthanide contraction. The as-synthesized and 600 °C calcined NaEu(WO4)2 both exhibit the ~616 nm red emission of Eu3+ under 395 nm excitation, with the fluorescence lifetime of ~0.90 ms and external/internal quantum efficiencies (ηex/ηin, in percentage) of ~23/66–69. For NaTb(WO4)2, the green Tb3+ emission at 546 nm was analyzed to have similar lifetime values of ~0.75 and 0.89 ms for the as-synthesized and ~0.79 and 0.88 ms for the 600 °C calcined powders under 265 and 379 nm excitations, respectively. The ηex/ηin values of NaTb(WO4)2 emission were determined to be ~37.7/68.7 and 46.0/82.8 under 265 nm excitation and ~14.8/46.3 and 13.5/31.8 under 379 nm excitation for the as-synthesized and 600 °C calcined samples, respectively. Calcination did not bring about any change to the peak position of the excitation and emission bands, but greatly enhanced the [WO4]2--Tb3+ charge transfer (CT) band and the emission under CT excitation.
Disclosure statement
No potential conflict of interest was reported by the authors.
Funding
This work was supported in part by the National Natural Science Foundation of China [grant numbers 51672039 and 51702020], the Fund of the State Key Laboratory of Advanced Technologies for Comprehensive Utilization of Platinum Metals [SKL-SPM-201505], and the Special Fund for Fundamental Research in Central Universities [grant number N160204008]. X.F. Shi acknowledges the financial support from the China Scholarship Council for her overseas PhD study [contract number 201606080031].
Supplemental data
The Supplemental data for this article can be accessed https://doi.org/10.1080/14686996.2017.1379342
Supplementary_information.docx
Download MS Word (4.3 MB)Related Research Data
References
- Durairajan A, Thangaraju D, Balaji D, et al. Sol-gel synthesis and characterizations of crystalline NaGd(WO4)2 powder for anisotropic transparent ceramic laser application. Opt Mater. 2013;35:740–743.10.1016/j.optmat.2012.08.018
- Sun D-X. Hydrothermal synthesis of NaY(WO4)2:Tb3+ powders with assistance of surfactant and luminescence properties. J Mater Sci: Mater Electron. 2015;26:6892–6896.
- Gai SL, Li CX, Yang PP, et al. Recent progress in rare earth micro/nanocrystals: soft chemical synthesis, luminescent properties, and biomedical applications. Chem Rev. 2014;114:2343–2389.10.1021/cr4001594
- Shivakumara C, Saraf R, Behera S, et al. Scheelite-type MWO4 (M=Ca, Sr, and Ba) nanophosphors: facile synthesis, structural characterization, photoluminescence, and photocatalytic properties. Mater Res Bull. 2015;61:422–432.10.1016/j.materresbull.2014.09.096
- Wang ZJ, Zhang YL, Zhong JP, et al. One-step synthesis and luminescence properties of tetragonal double tungstates nanocrystals. Nanoscale. 2016;8:15486–15489.10.1039/C6NR02715F
- Kaczmarek AM, Van Deun R. Rare earth tungstate and molybdate compounds - from 0D to 3D architectures. Chem Soc Rev. 2013;42:8835–8848.10.1039/c3cs60166 h
- Huang SH, Zhang X, Wang LZ, et al. Controllable synthesis and tunable luminescence properties of Y2(WO4)3:Ln3+ (Ln = Eu, Yb/Er, Yb/Tm and Yb/Ho) 3D hierarchical architectures. Dalton Trans. 2012;41:5634–5642.10.1039/c2dt30221 g
- Schustereit T, Schleid T, Hartenbach I. Syntheses and crystal structures of the rare-earth metal (III) bromide ortho-oxidotungstates (VI) with the formula REBr[WO4] (RE=Y, Gd-Yb). Solid State Sci. 2015;48:218–224.10.1016/j.solidstatesciences.2015.08.013
- Demiaï A, Derbal M, Guerbous L, et al. Structure, optical and photoluminescence properties of LiGd1−xErx(WO4)2 green luminescence phosphor. Opt Mater. 2017;65:137–141.10.1016/j.optmat.2016.10.026
- Lei F, Yan B, Chen HH, et al. Molten salt synthesis, characterization, and luminescence properties of Gd2MO6:Eu3+ (M=W, Mo) phosphors. J Am Ceram Soc. 2009;92:1262–1267.10.1111/jace.2009.92.issue-6
- Shi XF, Li J-G, Zhu Q, et al. Hydrothermal sssisted synthesis and photoluminescence of (Y1-x Eux)2WO6 red phosphors. J Alloys Compd. 2017;695:1984–1992.10.1016/j.jallcom.2016.11.033
- Liu XL, Hou WH, Yang XY, et al. Morphology controllable synthesis of NaLa(WO4)2: the morphology dependent photoluminescent properties and single-phased white light emission of NaLa(WO4)2: Eu3+/Tb3+/Tm3+. Cryst Eng Comm. 2014;16:1268–1276.10.1039/c3ce41712c
- Dirany N, Arab M, Moreau A, et al. Hierarchical design and control of NaCe(WO4)2 crystals: structural and optical properties. Cryst Eng Comm. 2016;18:6579–6593.10.1039/C6CE01340F
- Gu J, Zhu YC, Li HB, et al. Uniform Ln3+ (Eu3+, Tb3+) doped NaLa(WO4)2 nanocrystals: synthesis, characterization, and optical properties. J Solid State Chem. 2010;183:497–503.10.1016/j.jssc.2009.12.019
- Bünzli J-CG, Piguet C. Taking advantage of luminescent lanthanide ions. Chem Soc Rev. 2005;34:1048–1077.10.1039/b406082 m
- Yu XC, Qin YB, Gao ML, et al. Hydrothermal synthesis and upconversion luminescence of NaGd(WO4)2 co-doped with Ho3+ and Yb3+. J Lumin. 2014;153:1–4.10.1016/j.jlumin.2014.02.033
- Xu HZ, Xu K, Lu AD, et al. Microwave hydrothermal synthesis and white up-conversion emission of NaGd(WO4)2:(Yb3+/Tm3+/Ho3+) phosphors. J Mater Sci: Mater Electron. 2015;26:3921–3925.
- Han XM, García-Cortés A, Serrano MD, et al. Structural and thermal properties of tetragonal double tungstate crystals intended for ytterbium laser composites. Chem Mater. 2007;19:3002–3010.10.1021/cm070237v
- Han X, Fusari F, Serrano MD, et al. Continuous-wave laser operation of Tm and Ho co-doped NaY(WO4)2 and NaLu(WO4)2 crystals. Opt Express. 2010;18:5413–5419.10.1364/OE.18.005413
- García-Cortés A, Cano-Torres JM, Han X, et al. Tunable continuous wave and femtosecond mode-locked Yb3+ laser operation in NaLu(WO4)2. J Appl Phys. 2007;101:063110.10.1063/1.2490382
- Han XM, Cano-Torres JM, Rico M, et al. Spectroscopy and efficient laser operation near 1.95 μm of Tm3+ in disordered NaLu(WO4)2. J Appl Phys. 2008;103:083110.10.1063/1.2907438
- Zhao HY, Wang JY, Zhang HJ, et al. Crystal growth of Nd:NaLu(WO4)2. Mater Lett. 2007;61:4697–4699.10.1016/j.matlet.2007.03.008
- Wang ZJ, Zhong JP, Jiang HX, et al. Controllable synthesis of NaLu(WO4)2:Eu3+ microcrystal and luminescence properties for LEDs. Cryst Growth Des. 2014;14:3767–3773.10.1021/cg5001182
- Han XM, Garcıía-Cortés A, Serrano MD, et al. Structural and thermal properties of tetragonal double tungstate crystals intended for ytterbium laser composites. Chem Mater. 2007;19:3002–3010.10.1021/cm070237v
- Cascales C, Méndez Blas A, Rico M, et al. The optical spectroscopy of lanthanides R3+ in ABi(XO4)2 (A=Li, Na; X=Mo, W) and LiYb(MoO4)2 multifunctional single crystals: relationship with the structural local disorder. Opt Mater. 2005;27:1672–1680.10.1016/j.optmat.2004.11.051
- Cascales C, Serrano MD, Esteban-Betegón F, et al. Structural, spectroscopic, and tunable laser properties of Yb3+-doped NaGd(WO4)2. Phys Rev B. 2006;74:1657.10.1103/PhysRevB.74.174114
- Nicola JS, Cheethamb AK, Battle PD. Crystal structures of two sodium yttrium molybdates: NaY(MoO4)2 and Na5Y(MoO4)4. J Mater Chem. 1994;4:707–711.
- Cano-Torres JM, Rico M, Han X, et al. Comparative study of crystallographic, spectroscopic, and laser properties of Tm3+ in NaT(WO4)2 (T = La, Gd, Y, and Lu) disordered single crystals. Phys Rev B. 2011;84:714.10.1103/PhysRevB.84.174207
- Huang SH, Wang D, Li CX, et al. Controllable synthesis, morphology evolution and luminescence properties of NaLa(WO4)2 microcrystals. CrystEngComm. 2012;14:2235–2244.10.1039/c2ce06450b
- Piskuła Z, Czajka J, Staninski K, et al. Luminescence properties of calcium tungstate activated by lanthanide (III) ions. J Rare Earth. 2014;32:221–225.10.1016/S1002-0721(14)60056-9
- Xu HZ, Ying DM, Lu AD, et al. Surfactant-assistant solvothermal synthesis of CaWO4:Eu3+ phosphors and luminescence. Superlattices Microstruct. 2015;83:668–675.10.1016/j.spmi.2015.04.011
- Yu XC, Gao ML, Li JX, et al. Near infrared to visible upconversion emission in Er3+/Yb3+ co-doped NaGd(WO4)2 nanoparticles obtained by hydrothermal method. J Lumin. 2014;154:111–115.10.1016/j.jlumin.2014.04.016
- Aghazadeh M, Arhami B, Malek Barmi A-A, et al. La(OH)3 and La2O3 nanospindles prepared by template-free direct electrodeposition followed by heat-treatment. Mater Lett. 2014;115:68–71.10.1016/j.matlet.2013.10.002
- Anandan S, Sundara Raj BG, Emeline AV, et al. Facile ultrasound assisted synthesis of monodisperse spherical CuMn(OH)3NO3 nanoparticles for energy storage applications. J Alloys Compd. 2017;699:745–750.10.1016/j.jallcom.2016.12.431
- Gadsden JA. Infrared spectra of minerrals and related inorganic compounds. Reading, Mass., USA: Butterworths; 1975.
- Ryskin YI, . The infrared spectra of minerals. London: Bartholomew Press; 2009. Chapter 9, The vibrations of protons in minerals: hydroxyl, water, and ammonium; p. 137–182.
- Hallam HE. Infra-red spectroscopy and molecular structure. New York: Elsevier Publishing Company; 1963. Chapter XII, Hydrogen Bonding and Solvent Effects; p. 405–438.
- Blasse G. Luminesence and energy transfer. Utrecht: Springer. 1980. Chapter 3, The Luminescence of Closed-Shell Transition-Metal Complexes; p. 10–31.
- Xiong FB, Lin HF, Wang LJ, et al. White light emission in host-sensitized Dy3+-single-doped NaIn(WO4)2 phosphors. Physica B. 2015;459:41–45.10.1016/j.physb.2014.11.100
- Liu Y, Liu GX, Wang JX, et al. Hydrothermal synthesis, multicolor tunable luminescence and energy transfer of Eu3+ or/and Tb3+ activated NaY(WO4)2 nanophosphors. J Mater Sci: Mater Electron. 2016;27:10780–10790.
- Lei F, Yan B. Hydrothermal synthesis and luminescence of CaMO4:RE3+ (M=W, Mo; RE=Eu, Tb) submicro-phosphors. J Solid State Chem. 2008;181:855–862.10.1016/j.jssc.2008.01.033
- Mahalingam V, Thirumalai J, Krishnan R, et al. Up/down conversion luminescence and charge compensation investigation of Ca0.5Y1-x(WO4)2:xLn3+ (Ln=Pr, Sm, Eu, Tb, Dy, Yb/Er) phosphors. Spectrochim Acta Part A: Mol Biomol Spectrosc. 2016;152:172–180.
- Pang ML, Liu XM, Lin J. Luminescence properties of R2MoO6:Eu3+ (R = Gd, Y, La) phosphors prepared by Pechini sol-gel process. J Mater Res. 2011;20:2676–2681.
- Wang F, Fan XP, Pi DB, et al. Hydrothermal synthesis and luminescence behavior of rare-earth-doped NaLa(WO4)2 powders. J Solid State Chem. 2005;178:825–830.10.1016/j.jssc.2005.01.001
- Macalik L. Comparison of the spectroscopic and crystallograohic data of Tm3+ in the diffrent hosts: KLn(MO4)2 where Ln=Y, La, Lu and M=Mo, W. J Alloys Compd. 2002;341:226–232.10.1016/S0925-8388(02)00084-1
- Kirby AF, Richardson FS. Detailed analysis of the optical absorption and emission spectra of Eu3+ in the trigonal (C3) Eu(DBM)3·H2O system. J Phys Chem. 1983;87:2544–2556.
- Feng H, Yang Y, Cao H, et al. Hydrothermal synthesis and luminescence of NaGd(WO4)2:RE3+ (RE = Eu, Tb, Tm) phosphors. J Mater Sci: Mater Electron. 2015;26:3129–3133.
- Liao JS, Qiu B, Lai HS. Synthesis and luminescence properties of Tb3+:NaGd(WO4)2 novel green phosphors. J Lumin. 2009;129:668–671.10.1016/j.jlumin.2009.01.016
- Liao JS, Zhang SA, You HY, et al. Energy transfer and luminescence properties of Eu3+-doped NaTb(WO4)2 phosphor prepared by a facile hydrothermal method. Opt Mater. 2011;33:953–957.10.1016/j.optmat.2010.12.014
- Wang ZH, Li J-G, Zhu Q, et al. Sacrificial conversion of layered rare-earth hydroxide (LRH) nanosheets into (Y1-xEux)PO4 nanophosphors and investigation of photoluminescence. Dalton Trans. 2016;45:5290–5299.10.1039/C5DT01983D
- Loiko PA, Vilejshikova EV, Mateos X, et al. Spectroscopy of tetragonal Eu:NaGd(WO4)2 crystal. Opt Mater. 2016;57:1–7.10.1016/j.optmat.2016.04.003