
 ?Mathematical formulae have been encoded as MathML and are displayed in this HTML version using MathJax in order to improve their display. Uncheck the box to turn MathJax off. This feature requires Javascript. Click on a formula to zoom.
Abstract
The fully printed, hole-transporter-free carbon perovskite solar cell structure incorporating a triple mesoscopic layer has emerged as a possible frontrunner for early industrialisation. It is an attractive structure because it can be fabricated by the simple sequential screen printing and sintering of titania, zirconia, and carbon. The device is finalised by manual dropping of a perovskite precursor solution onto the carbon which subsequently infiltrates. This stage in device fabrication is inhomogeneous, ineffective for large areas, and prone to human error. Here we introduce an automated deposition and infiltration system using a robotic dispenser and mesh which delivers the perovskite precursor uniformly to the carbon surface over a large area. It has been successfully used to prepare perovskite solar cells with over 9% efficiency. Cells, prepared by this robotic mesh deposition, showed comparable performance to reference cells, made by standard drop deposition, confirming this approach to be effective and reliable. X-ray diffraction and Raman spectroscopy were used to confirm the uniformity of the deposition over a large area.
1. Introduction
Organic–inorganic halide perovskites are a class of material that allow the preparation of efficient thin film solar cells via solution phase deposition. Since the first application in photovoltaic cells, astonishing results have been achieved with different device structures on both rigid [Citation1–Citation5] and flexible [Citation6–Citation8] substrates. The high performance and ease of processing make perovskite solar cells (PSCs) promising for future application and commercialisation. To enable the transition to large-scale deployment a range of technical issues must be overcome, in particular the high cost of materials such as organic hole transporters, the stability of devices in operation, and issues related to the technology up-scaling [Citation9].
Han et al. have developed a fully printable architecture based on a three-layer mesoporous stack which includes firstly a titanium dioxide () layer followed by zirconium dioxide (
) as an insulating spacer and then finally a conductive carbon as top contact [Citation10]. To complete the device, droplets of a perovskite solution are applied to the carbon surface which then wet and infiltrate through the mesoporous stack [Citation11]. The attraction of the carbon top electrode perovskite solar cell (C-PSC) structure is that it is fully printable and hole transport material (HTM) free, thus does not contain unstable and expensive organic materials such as Spiro-OMeTAD [Citation12,Citation13]. High stability over 10000 h under continuous 1 sun illumination is also reported for C-PSC with the 2D/3D 5-ammonium valeric acid(
(
)
, 5-AVA) perovskite [Citation10,Citation14,Citation15].
Perovskite precursor solutions are typically manually applied to the carbon surface using a pipette via either a 1-step [Citation10,Citation11] or 2-step [Citation16,Citation17] approach and only recently by inkjet printing [Citation18].
Small devices (up to 1 ) can be easily prepared by this drop deposition method but large area devices, in particular both parallel and series connected modules [Citation19,Citation20], require both patterning and increased uniformity of layers which is more challenging using a manual approach. In fact, the drop method can result in uncontrolled and non-uniform perovskite infiltration. Inkjet printing allows controlled and uniform depositions but the droplets of solution are deposited one by one and this requires a large number of nozzles to print over a large area in a reasonable time scale [Citation21]. Other printing techniques, such as flexographic and screen printing, require inks with polymer-based binders in order to tune the rheological properties of the solution. Polymeric binders, however, may affect the electrical properties of the final layer and are often removed by heating above 400
C, which is too high for perovskite films [Citation21,Citation22]. Flexographic printing can be used to print low viscosity inks but gives poor homogeneity when printing solid areas such as those required for solar cells. This poor homogeneity is caused by surface instabilities in the ink at the nip between the flexographic plate cylinder and the substrate [Citation22].
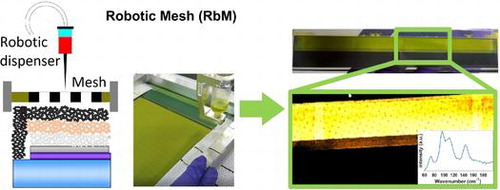
Figure 1. Schematic representation of deposition methods for perovskite precursor solutions on C-PSCs. (a) drop method (b) robotic mesh method (RbM).
In this work, we present a novel deposition method, which involves the use of a robotic dispenser and a mesh to easily and quickly deposit binder-free inks, such as perovskite solutions, homogeneously over a large area (Figure ). In this robotic mesh (RbM) deposition technique, the automated dispenser applies a controlled volume of solution onto the mesh. On contact with the mesh the solution is reduced to smaller and more homogeneous droplets which are formed as the solution passes through the mesh onto a selected area (determined by the exposed mesh). The principle of the technique is similar to inkjet printing, where the liquid is delivered as many little drops but, in the RbM deposition, all the necessary precursor solutions are deposited simultaneously, reducing the deposition and subsequent infiltration time considerably. RbM does not use a flow coater or a squeegee like in screen printing, where the ink is transferred from the mesh to the substrate using mechanical forces. In the RbM method, the ink is transferred by gravity. The elasticity of the screens that are adopted in screen printing, therefore, is not required. For the RbM method, the presence of very fine holes is crucial to drive the solution on a selected area via the surface tension of the media, i.e. the ink, the mesh, and the substrate.
The effectiveness of the RbM technique was compared to a conventional manual drop deposition method in terms of performance and stability on 1 devices. A 2-step deposition method, where lead iodide (
) is dropped into the film and converted by immersion of the whole film in a methylammonium iodide (MAI) solution to form methylamine lead iodide (
, MAPI) perovskite, was adopted following the method of Han et al. [Citation16]. The use of
, bright yellow, allows a visual monitoring of its infiltration through the mesoporous layers. The homogeneity of the deposition was determined by X-ray diffraction (XRD) sampling and Raman mapping. This mechanised infiltration method has the potential to automate the final stages of device fabrication. This means that from the introduction of the substrate through to the completion of an encapsulated device, the sequential layering by screen printing, infiltration using the RbM, and a final dip process are all mechanised and uniform. This has significant potential for unlocking high-volume continuous manufacture.
2. Experimental section
2.1. Materials
We used the following solvents and reagents: (99%, Sigma-Aldrich), MAI (
I, Dyesol), anhydrous N,N-dimethylformamide (DMF, 99.8%, Sigma-Aldrich), anhydrous 2-propanol (IPA, 99.5%), carbon paste (Gwent electronic materials), zirconia paste (Solaronix), titania paste (30NR-D, Dyesol), terpineol (95%, Sigma-Aldrich), and titanium diisopropoxide bis(acetylacetonate) (TAA, 75% in IPA, Sigma-Aldrich). Conductive fluorine-doped tin oxide glass (FTO, TEC-7, XOP) was used as the substrate.
2.2. Device fabrication
FTO was initially patterned with a Nb: laser (532 nm). The patterned substrate was then cleaned with a solution of Hellmanex in deionised water, then rinsed with acetone, IPA, and finally plasma cleaned in an
atmosphere for 5 min. A compact
layer was deposited by spray pyrolysis with a solution of 10% TAA in IPA and heated at 550
C. Mesoporous layers of
,
, and carbon were screen printed and annealed one by one at 550
C (
) or 400
C (
and carbon). The paste for the
layer was diluted in terpineol in a 1:1 ratio by weight, whereas the other pastes were used as bought. For the conventional drop method, a 13.6
L drop from a 1 M (460 mg/mL)
solution in DMF (kept at 70
C to avoid crystallisation) was deposited on the active area of the cells. For the RbM method, the needle of the dispenser, stainless steel with 0.16 mm inner diameter, continuously delivered the
solution to the mesh (180/27 mesh size) surface as it progressed across the sample in a single line at 12 m/min. After deposition, the liquid takes around 5 s fora complete infiltration. Therefore, the deposition of a 10
sample lasts around 5.5 s. For smaller devices, the static robot dispensed 13.6
L of solution directly onto the mesh with a deposition time for each cell of 0.2 s. The deposition takes around 8 s for a set of 15 cells. The mesh was kept in contact with the cell. In following application, the
solution spreads on the mesh area with a desired pattern determined by the exposed mesh, which then infiltrates through the mesoporous stack. The mesh size and exposed pattern control the spread of the liquid. When the entire deposited solution is infiltrated, the mesh can be removed. A less concentrated (0.76 M, 350 mg/mL)
solution was used to avoid crystallisation in the needle during the RbM deposition. Printing is continuous until the end of the batch after each batch the screen is cleaned and reused. For both the drop and RbM methods,
was dried at 70
C in an oven for 30 min, then cells were dipped in a 10 mg/mL MAI solution in 2-propanol (IPA). When the perovskite conversion was complete, the cells were rinsed in IPA.
2.3. Characterisation
JV measurements were carried out using a Newport Oriel solar simulator (class AAA) calibrated with a KG5 filtered reference cell. A Keithley 2400 source metre was used at a scan rate of 34 mV/s between -0.2 V and 1.1 V in forward and reverse directions. The active area was defined through an aperture mask with an area of 9 . Stability tests were performed under continuous irradiation from white light-emitting diodes (LEDs) in ambient condition (18–22
C, around 50% relative humidity) at both 1 and 0.5 equivalent sun recording a complete JV curve every 15 min in the first 5 h and every 1 h for the remainder of the test. External quantum efficiency (EQE) measurements were carried out using a QE X10 system (PV Measurements) in the wavelength range between 300 and 850 nm in direct current (DC) mode with a light spot of less than 10
. Electrochemical impedance spectroscopy (EIS) measurements were performed on unmasked devices using a Gamry potentiostat and scanning from 1 MHz to 0.1 Hz at open circuit under illumination from LED at 530 nm at 1 equivalent sun. Light intensity was modulated using neutral light filters. XRD measurements were carried out using a Bruker diffractometer with Bragg–Brentano geometry.
radiation was applied as X-ray source. 2
scans between 10
and 35
were collected using a step size of 0.01
. XRD samplings were obtained by measuring the peak heights of diffractograms collected every mm on a 8
41
area using an X–Y scanning stage, from 12.2
and 14.5
, step size of 0.04
, and a collimator of 1 mm. Raman measurements were performed with a Renishaw Invia Raman system in backscattering configuration. The laser excitation of 532 nm, and a 50
long objective were used. Raman maps were obtained by measuring the maximal intensity of spectra in the Raman shift range between 80 and 120
over the baseline collected at several points of the sample with an X–Y scanning stage. The measurements were carried out through the glass side. Dynamic contact angle measurements of solution in DMF onto a given substrate were taken using a Nikon camera and analysed using FTA-32 software. Viscosity test was performed with a Bohlin rheometer and a distance between plates of 70
m.
Figure 2. (a) Deposition of solution over a mesoporous stack, in sequence: a
solution is deposited as continuous line over a carbon stripe; the liquid reorganises in drops; and the characteristic dot-like pattern is shown from the back side through the glass. (b) Change in contact angle of a
in DMF solution on a mesoporous carbon layer over time. Inset, the droplet on carbon at time 0.
Figure 3. Devices prepared by (a) drop or (b) RbM deposition. On the top, small devices (1 ) before and after conversion of
; at the bottom, long stripes (10
) after conversion with a blow-up of a selected area.
Figure 4. Comparison of 10 cm samples prepared by drop and RbM deposition prior to conversion into MAPI. (a) Visual appearance of samples obtained using a camera. (b) Raman map obtained at around 96 . A measured
Raman signal is also shown. The peaks at 73, 96, and 110
belong to
, the peak at 144
to
. The colour scale is shown for the two maps.
3. Results and discussion
In order to trial the automated deposition of the perovskite precursor onto the surface of the carbon, a robotic dispensing system was adopted. Initially, a continuous liquid line was applied across a 1 10
sample area. This approach, seen in Figure (a), led to a reorganisation of the liquid on top of the carbon layer which produced a dot-like pattern of material, similar to a single-drop method as show in our previous work [Citation23]. This uncontrolled infiltration leads to unfilled portions of the layered stack, which are subsequently in-active in light absorption and photocurrent generation.
Contact angle measurement of a solution in DMF on carbon (Figure (b)) shows that the liquid is absorbed into the carbon in only 0.3 s, with an initial angle of only 8
. This suggests that the surface energy of mesoporous carbon is high enough to rapidly absorb the solution and facilitate infiltration into the remaining layers. The reorganisation of the liquid observed on carbon, thus, is due to kinetic phenomena and not to energy stabilisation of the system.
When applied as a single-drop method solution infiltrates into the mesoscopic layers with a characteristic coffee stain pattern [Citation24], where a high amount of
can accumulate at the edges of the ring. At this edge area, the
crystals may saturate and block the pores preventing conversion to MAPI during the MAI precursor immersion. This leaves a characteristic yellow ring (Figure (a)). The RbM method, by contrast, allows greater control of the amount of solution that is deposited over the mesh, which facilitates a uniform infiltration across the entire surface and therefore due to reduced pore clogging, an improved conversion to the MAPI phase during MAI immersion (Figure (b)).
To demonstrate the possibility of increased control over solution deposition, improved homogeneity of infiltration, and removal of the coffee stain effect, long devices (1 10 cm) were trialled using the RbM system and compared to manual application. The results are shown visually in Figure (a). In order to confirm the composition and distribution of the
phase Raman spectroscopy was used to obtain a chemical map before the conversion into the MAPI phase (Figure (b)). The
signals in Raman, at around 100 nm Raman shift, are very intense and easy to detect, especially at 96
[Citation23,Citation25].
The peak at 144 can be assigned to the anatase phase of
[Citation23] and is visible because the measurements were performed through the conductive glass side. The Raman maps clearly show an increased homogeneity using the RbM method compared to the drop deposited samples. Furthermore, the
phase pattern is more controlled on the active area with a rectangular shape in RbM from the exposed mesh area rather than in the drop-like pattern.
After infiltration, the substrates were dipped in a MAI solution to obtain the MAPI phase. XRD measurements were then performed on drop and RbM samples. The results show a clear tetragonal structure (space group I4/mcm) for both perovskite films with a typical splitting of the peaks at around 28 and 31
seen in Figure S1 [Citation26]. The 14.2
peak can be used to monitor the MAPI phase, whereas the 12.7
peak refers to the
phase [Citation20,Citation26]. A more intense
peak can be observed in drop samples compared to RbM. In fact, the X-ray beam soaks a large area of the substrate and detects also the yellow
phase that does not convert due to the coffee stain effect. When a collimator is applied and a sharp X-ray beam reaches the substrate, it is possible to detect the amount of
phase from one point to another; these variations are presented in Figure as a false colour map. It is interesting that in RbM samples, the
phase is never as high as in some points of the drop sample, and the amount of MAPI phase is always constant along the RbM sample, showing the highly homogeneous deposition over the entire area.
Figure 5. An XRD false colour map of 10 cm samples prepared by drop and RbM following conversion to MAPI. The relative intensities of the peaks at 12.7 and 14.2
were used to map the
and MAPI phases, respectively. Each square of the false colour map is 1
of the sample area. Colour scale for each phase is shown. The diffractograms of each point are shown for drop and RbM samples.
Figure 6. Statistical analysis of JV data comparing Ctrl and RbM cells. Best devices derived from this data set exhibit PCE values of 10.9 and 9.8%, respectively, for Ctrl and RbM cells.
Table 1. Average performance of Ctrl and RbM cells. PCE stands for power conversion efficiency, FF for filling factor, for open-circuit voltage, and Hyst for the ratio of PCEs measured in forward and reverse scans.
Devices made using the RbM method were then compared to conventional cells obtained using the drop deposition method (labelled Ctrl). Cells were masked reducing the illuminated portion to the dark, central active area during JV test, thus the non-active yellow rings seen in the drop method cells do not affect the measurement. This is a critical observation as the core tenet of the RbM is the removal of unconverted areas; however, this device test is important to demonstrate general device functionality and acts as an optimised comparison. Figure shows the statistical performance of both Ctrl and RbM cells, with average data shown in Table . The data show that on average the mechanised RbM underperforms the manual drop method across all parameters associated with device measurement other than . This is likely to be due to the different
concentration used in the two methods, which will affect the
crystallisation and thus the cell performance. Optimal performance is usually obtained from saturated (1.0–1.2 M)
solutions [Citation27], which need 70
C to dissolve and then re-crystallise at room temperature. Since the temperature of the solution could not be controlled during the RbM deposition, a lower concentration of
solution was used to avoid crystallisation in the needle of the dispenser. The Ctrl cells were prepared using a saturated solution to enhance the crystal formation. Further adjustments are ongoing to make the RbM system compatible to more concentrated
inks. The need for an optimisation of the RbM method is also confirmed by the larger standard deviation of cell performance compared to Ctrl cells. Important parameters to optimise are the dispensing pressure, the amount of liquid to deposit, and the needle temperature during the deposition. The temperature of the needle, in particular, can allow the deposition of concentrated solutions, the change in viscosity of the liquid, and the modification of the evaporation rate of the solvent. The viscosity, density, and surface tension of the low concentration ink at room temperature are respectively 1.79 mPa
s, 1.25 g/mL, and 30.3 nN/m.
Figure 7. Representative example of JV curves of devices in forward (from low to high voltage) and reverse scan with stabilised current and PCE measured for 40 s. EQE spectra of the devices are shown.
Figure 8. (a) EIS Nyquist plot at different light intensity of a representative cell per each deposition method. (b left) Intensity dependence of the ; (b right) recombination resistance dependence of the applied voltage,
.
Figure 9. Normalised PCE of both Ctrl and RbM cells over time during continuous illumination from white LED, at 0.5 and 1 equivalent sun; temperature profile under 0.5 sun during the test. At 0.5 sun, the drop in PCE is not as severe as under 1 sun and a nearly complete recovery is observed after few days. The PCE profile under 0.5 sun follows the temperature profile.
Representative JV curves of devices and associated EQE for both methods are shown in Figure ; best devices deliver comparable performance in terms of performance and hysteresis and exhibit power conversion efficiency (PCE) values of 10.9 and 9.8% for Ctrl and RbM cells, respectively.
The cells were further characterised by EIS. Nyquist plots obtained from the two types of cell are shown in Figure (a). The impedance response of both cells exhibits a large high-frequency arc, which varies strongly with light intensity. The spectra were fitted using a simple, R(RC), equivalent circuit to extract the resistance values of the high-frequency process. The resistances values obtained from this arc scale linearly with , as seen in Figure (b). This feature has previously been attributed to the recombination resistance (
) in perovskite devices [Citation28].
is inversely proportional to the recombination current, and therefore a higher
leads to a higher
. The improvement in
for the RbM cells relative to the Ctrl cells is therefore a consequence of the higher
, which may be explained by considering that RbM allows a more uniform
infiltration and, thus, better pore filling. An additional feature is observed in the impedance spectra at lower frequencies, although it differs between the two devices. The response observed for the RbM cells is typical of many perovskite devices, in which the resistance increases at low frequency [Citation29,Citation30]. Low-frequency features in the impedance response of perovskite solar cells have been ascribed to the impact of mobile ions in the perovskite layer on interfacial recombination [Citation30]. For the Ctrl cells, a negative loop is observed, the origins of which are not completely understood although many of the hypotheses describe this as a feature indicative of a process which is detrimental to performance. Yan et al. attributed the negative impedance loop to degradation of the perovskite [Citation31]. A degradation product of MAPI is
[Citation32], which is present in the Ctrl cells due to the incomplete conversion. The feature has also been attributed to poor charge injection, exacerbated by the presence of multiple interface layers [Citation33]. We believe the uncontrolled deposition of
in the Ctrl cells leads to inhomogeneous filling and therefore inferior contact at the interface between the perovskite and
. Additionally, the presence of unconverted
may act as a barrier to charge injection. As observed in Figure (b), the
of RbM cells is higher than the Ctrl alternatives over the range from 0.01 to 1 Sun equivalent light intensity. When analysing developments to existing cell manufacturing processes, it is vital to ensure that apparently good performance at 1 Sun intensity is also consistent at lower light levels. The diode ideality factor, which gives an indication of recombination processes occurring within a device, can be extracted from the slope of the
-intensity plots [Citation28]. Both types of cell give ideality factors between 1 and 2, indicating that the recombination is mainly trap assisted [Citation34]. Importantly, the change in deposition method does not significantly alter this property by inducing shunting, which would lead to poor performance at lower light levels, such as those experienced in real-world implementation of the devices.
Stability tests in air and ambient conditions, under continuous illumination from white LEDs at 0.5 and 1 equivalent sun, were performed on both Ctrl and RbM non-encapsulated cells (Figure ). The degradation is severe under 1 equivalent sun, as expected for MAPI C-PSCs [Citation35], and hinders any speculations. However, at 0.5 equivalent sun, the devices are stable for over 160 h.
Interestingly, at 0.5 equivalent sun, the performance decreases dramatically in the first few hours but an unexpected recovery occurs after a day of continuous exposure. Even a complete recovery is observed after a few days of testing. The decrease and recover of PCE is similar with both types of infiltration methods. The result confirms that RbM deposition does not affect the C-PSC devices in terms of performance and stability. Having halved the light induced stress, the observed fluctuations can be likely ascribed to environmental parameters, such as temperature or humidity. The fluctuations of temperature, which were recorded with a thermocouple, follow the PCE profile over the time. The relative humidity, which could not be measured with our set-up, is also a function of the temperature and is expected to follow a similar trend when the humidity of the room is constant. The results call for further investigation on the thermal and humidity stability of these devices.
4. Conclusions
A new mechanised method to deposit solutions over a large area is presented. The method was tested on the fully printable C-PSCs showing improved infiltration uniformity and control compared to the more common drop deposition, leading to a PCE as high as 9.8% on a 1 device. A chemical map of
film in the triple mesoscopic layers as measured by Raman spectroscopy was shown as well as XRD sampling to prove the high homogeneity that can be achieved by RbM. Some important parameters that control the deposition are the dispensing pressure, the amount of liquid to deposit, the mesh size, and the temperature of the needle. JV, EQE, EIS, and stability measurements show that the RbM method can achieve similar performance to Ctrl cells.
Supplementary_information_.docx
Download MS Word (74.6 KB)Additional information
Funding
Notes
No potential conflict of interest was reported by the authors.
Supplemental data for this article can be accessed here. [http://dx.doi.org/10.1080/14686996.2017.1406777]
Related Research Data
References
- Liu M , Johnston MB , Snaith HJ . Efficient planar heterojunction perovskite solar cells by vapour deposition. Nature. 2013;501(7467):395–398.
- Saliba M , Matsui T , Seo JY , et al . Cesium-containing triple cation perovskite solar cells: improved stability, reproducibility and high efficiency. Energy Environ Sci. 2016;9(6):1989–1997.
- Lee MM , Teuscher J , Miyasaka T , et al . Efficient hybrid solar cells based on meso-superstructured organometal halide perovskites. Science. 2012;338(6107):643–647.
- Carnie MJ , Charbonneau C , Davies ML , et al . A one-step low temperature processing route for organolead halide perovskite solar cells. Chem Commun. 2013 Sep;49(72):7893–7895.
- Kim T , Choi JY , Jeon JH , et al . Hybrid tandem photovoltaic devices with a transparent conductive interconnecting recombination layer. Mater Res Bull. 2012;47(10):3040–3043.
- Docampo P , Ball JM , Darwich M , et al . Efficient organometal trihalide perovskite planar-heterojunction solar cells on flexible polymer substrates. Nat Commun. 2013;4:2761.
- Troughton J , Bryant D , Wojciechowski K , et al . Highly efficient, flexible, indium-free perovskite solar cells employing metallic substrates. J Mater Chem A. 2015;3(17):9141–9145.
- Yang D , Yang R , Zhang J , et al . High efficiency flexible perovskite solar cells using superior low temperature TiO2 . Energy Environ Sci. 2015;8(11):3208–3214.
- Baker J , Mouhamad Y , Hooper K , et al . From spin coating to roll-to-roll: investigating the challenge of upscaling lead halide perovskite solar cells. IET Renew Power Gener. 2017;11 (5):546–549.
- Mei A , Li X , Liu L , et al . A hole-conductorfree, fully printable mesoscopic perovskite solar cell with high stability. Science. 2014;345(6194):295–298.
- Ku Z , Rong Y , Xu M , et al . Full printable processed mesoscopic CH3NH3PbI2TiO2 heterojunction solar cells with carbon counter electrode. Sci Rep. 2013;3:3132.
- Niu G , Guo X , Wang L . Review of recent progress in chemical stability of perovskite solar cells. J Mater Chem A. 2015;3(17):8970–8980.
- Speller EM , McGettrick JD , Rice B , et al . The impact of aggregation on the photochemistry of fullerene films: correlating stability to triplet exciton kinetics. ACS Appl. Mater. Interfaces. 2017;9(27):22739–22747.
- Grancini G , Rold\‘{a}n-Carmona C, Zimmermann I , et al . One-Year stable perovskite solar cells by 2D/3D interface engineering. Nat Commun. 2017;8:15684.
- Chen H , Yang S . Carbon-based perovskite solar cells without hole transport materials: the front runner to the market? Adv Mater. 2017;29(24):1603994.
- Liu T , Liu L , Hu M , et al . Critical parameters in TiO2/ZrO2/Carbon-based mesoscopic perovskite solar cell. J Power Sour. 2015;293:533–538.
- Cao K , Zuo Z , Cui J , et al . Efficient screen printed perovskite solar cells based on mesoscopic TiO2/Al2O3/NiO/carbon architecture. Nano Energy. 2015;17:171–179.
- Hashmi SG , Martineau D , Li X , et al . Air processed inkjet infiltrated carbon based printed perovskite solar cells with high stability and reproducibility. Adv Mater Technol. 2017;2(1):1600183.
- Razza S , Castro-Hermosa S , Di Carlo A , et al . Research update: large-area deposition, coating, printing, and processing techniques for the upscaling of perovskite solar cell technology. APL Mater. 2016;4(9):091508.
- Cotella G , Baker J , Worsley D , et al . One-step deposition by slot-die coating of mixed lead halide perovskite for photovoltaic applications. Sol Energy Mat Sol Cells. 2017;159:362–369.
- Krebs FC . Fabrication and processing of polymer solar cells: a review of printing and coating techniques. Sol Energ Mat Sol Cells. 2009;93(4):394–412.
- Baker J , Deganello D , Gethin DT , et al . Flexographic printing of graphene nanoplatelet ink to replace platinum as counter electrode catalyst in flexible dye sensitised solar cell. Mater. Res. Innov. 2014;18(2):86–90.
- Hooper KEA , Lee HKH , Newman MJ , et al . Probing the degradation and homogeneity of embedded perovskite semiconducting layers in photovoltaic devices by Raman spectroscopy. Phys Chem Chem Phys. 2017;131:6050–6051.
- Malfatti L , Tokudome Y , Okada K , et al . Coffee stain-driven self-assembly of mesoporous rings. Micropor Mesopor Mat. 2012;163:356–362.
- Wangyang P , Sun H , Zhu X , et al . Mechanical exfoliation and Raman spectra of ultrathin PbI2 single crystal. Mater Lett. 2016;168:68–71.
- Baikie T , Fang Y , Kadro JM , et al . Synthesis and crystal chemistry of the hybrid perovskite (CH3NH3)PbI3 for solid-state sensitised solar cell applications. J Mater Chem A. 2013;1(18):5628.
- Yao Z , Wang W , Shen H , et al . CH3NH3PbI3 grain growth and interfacial properties in meso-structured perovskite solar cells fabricated by two-step deposition. Sci Tech Adv Mater. 2017;18(1):253–262.
- Pockett A , Eperon GE , Peltola T , et al . Characterization of planar lead halide perovskite solar cells by impedance spectroscopy, open-circuit photovoltage decay, and intensity-modulated photovoltage/photocurrent spectroscopy. J Phys Chem C. 2015;119(7):3456–3465.
- Gonzalez-Pedro V , Juarez-Perez EJ , Arsyad WS , et al . General working principles of CH3NH3PbX3 perovskite solar cells. Nano Lett. 2014;14(2):888–893.
- Pockett A , Eperon G , Sakai N , et al . Microseconds, milliseconds and seconds: deconvoluting the dynamic behaviour of planar perovskite solar cells. Phys Chem Chem Phys. 2017;19(8):5959–5970.
- Tai Q , You P , Sang H , et al . Efficient and stable perovskite solar cells prepared in ambient air irrespective of the humidity. Nat Commun. 2016;6:1–8.
- Wang K , Shi Y , Li B , et al . Amorphous inorganic electron-selective layers for efficient perovskite solar cells: feasible strategy towards room-temperature fabrication. Adv. Mater. 2016;28:1891–1897.
- Anaya M , Zhang W , Hames BC , et al . Electron injection and scaffold effects in perovskite solar cells. J Mater Chem C. 2017;5(3):634–644.
- Wetzelaer GJAH , Scheepers M , Sempere AM , et al . Trap-assisted non-radiative recombination in organic-inorganic perovskite solar cells. Adv Mater. 2015;27(11):1837–1841.
- Ito S , Mizuta G , Kanaya S , et al . Light stability tests of CH3NH3PbI3 perovskite solar cells using porous carbon counter electrodes. Phys Chem Chem Phys. 2016;18:27102–27108.