
 ?Mathematical formulae have been encoded as MathML and are displayed in this HTML version using MathJax in order to improve their display. Uncheck the box to turn MathJax off. This feature requires Javascript. Click on a formula to zoom.
Abstract
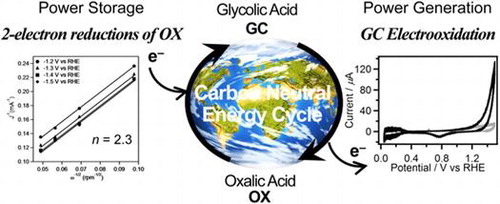
We demonstrated carbon-neutral (CN) energy circulation using glycolic acid (GC)/oxalic acid (OX) redox couple. Here, we report fundamental studies on both catalyst search for power generation process, i.e. GC oxidation, and elemental steps for fuel generation process, i.e. OX reduction, in CN cycle. The catalytic activity test on various transition metals revealed that Rh, Pd, Ir, and Pt have preferable features as a catalyst for electrochemical oxidation of GC. A carbon-supported Pt catalyst in alkaline conditions exhibited higher activity, durability, and product selectivity for electrooxidation of GC rather than those in acidic media. The kinetic study on OX reduction clearly indicated that OX reduction undergoes successive two-electron reductions to form GC. Furthermore, application of TiO2 catalysts with large specific area for electrochemical reduction of OX facilitates the selective formation of GC.
1. Introduction
Efficient power distribution is a key to realize a sustainable society driving with renewable energies. Hydrogen is believed to be the cleanest energy carrier due to no CO2 emission during combustion [Citation1–5]. Industrial hydrogen, however, is mainly produced by reforming fossil fuels, such as, natural gas, propane, gasoline, diesel and so on. On the other hand, water electrolysis applied with electricity generated from renewable energies, such as photovoltaic, wind and hydraulic powers, i.e. renewable electricity, can provide carbon-neutral H2 [Citation6–11]. However, fatal drawbacks of utilization of H2 as an energy carrier still remain. Namely, gaseous and chemically active H2 fold an infeasibility of widespread distribution due to its low volumetric energy density (13 MJ m−3), which makes difficulties in long-time storage and long-distance transport. H2 transport using a cryogenic liquid hydrogen tanker or a massive hydrogen pipeline system is expected to solve such problems but requests large cost. On the other hand, various H2 carriers such as organic hydrides [Citation12], NH3 [Citation13], amides [Citation14] and formate converted from CO2 [Citation15], have been proposed as a H2 carrier, and some have achieved the efficiencies demanded for practical use. In this regard, liquid energy carriers, e.g. gasoline, offer great merit by considering the manageability of liquid fuels. Thus far, we have proposed utilization of alcoholic compounds that are chemically stable and characterized with a high volumetric energy density, e.g. ethanol and ethylene glycol exhibit energy densities of are 23,000 and 22,000 MJ m−3, respectively. In the previous study, we succeeded in power generation from ethylene glycol by selective oxidation to oxalic acid (OX, (CO2H)2) with an alkaline type fuel cell employing Fe-group nanoalloy catalysts, i.e. CO2-free power generation on non-Pt catalysts [Citation16–18]. The selective oxidation could produce 80% of potentially available electric power of ethylene glycol. Furthermore, we performed CO2-free power circulation using glycolic acid (GC, HOCH2-CO2H)/OX redox couple [Citation19,20]. GC is a monovalent alcohol having 8600 MJ m−3 of an energy density in the case of selective oxidation as described in the following equation:(1)
(1)
Power generation was achieved via four-electron oxidation of GC into OX without CO2 emission on a Pt catalyst. More importantly, GC was reproduced via electrochemical hydrogenation of OX on an anatase TiO2 catalyst with hydrogen generated from water at a Pt anode. These results are the first demonstration of CO2-free power circulation using an alcohol/acid redox couple. Recently, direct solar energy storage was also achieved by applying photoanode for water oxidation [Citation21].
Whereas we found out the excellent catalytic ability of TiO2 for OX reduction by testing the catalytic performance of various metals and their oxides in our previous paper [Citation19], GC oxidation have been performed only with a Pt catalyst. Therefore, there is room for exploring novel catalysts for power generation from GC. Here, in this study, we examined the catalytic performances of various transition metals, including Ti, V, Fe, Co, Ni, Cu, Zn, Zr, Nb, Mo, Rh, Pd, Ag, Ta, W, Re, Ir, Pt, and Au, for the electrochemical oxidation of GC, and found that Pt exhibits the best catalytic performance and a few other noble metals have a potential to be an anode catalyst. Furthermore, we investigate catalytic properties of a carbon-supported Pt catalyst (Pt/C) and appropriate conditions for the electrochemical GC oxidation.
In our previous study, regeneration of GC was achieved by four-electron reduction of OX. However, we do not have any ideas about detailed mechanism, i.e. four-electron reduction is completed via one step reaction or successive two-electron reductions accompanied with formation of glyoxylic acid (HOOC–COH, GO)[Citation19,22]. OX reduction has not been analyzed by electrochemical methods in detail. Knowledge of the reaction process will contribute to improvement of efficiency, reaction rate, product selectivity, and so on. We have found that crystallite phase of TiO2 is a decisive factor for OX reduction activity i.e. anatase-type TiO2 showed higher activities than that of rutile-type TiO2 [Citation19], and expected that further investigation of the effects of other characteristics of TiO2 contributes to achieve high efficiency for the reaction system. In this study, we examined electrochemical analysis of OX reduction on TiO2 cathode and effects of specific surface area of TiO2 on performances of OX reduction using various anatase-type TiO2. We clarified that four-electron reduction of OX to GC proceeded through successive two-electron reductions and application of TiO2 catalysts with large specific area can suppress H2 production and led to high selectivity for reduction of OX to GC.
2. Experimental details
2.1. Materials
Glycolic acid (GC, 97.0%), oxalic acid (OX, 98.0%), potassium hydroxide (85.0%), and sodium sulfate (99.0%) were purchased from Wako (Osaka, Japan). Ethylene glycol was purchased from Kanto (Tokyo, Japan). 20 wt% Pt/C was purchased from Alfa Aesar (Ward Hill, MA, USA). Ti (99.5%), V (99.7%), Fe (99.99%), Co (99.9%), Ni (99%), Cu (99.9%), Zn (99.5%), Zr (99.2%), Nb (99.9%), Mo (99.95%), Pd (99.95%), Ag (99.98%), Ta (99.95%), W (99.95%), Au (99.95%) plates and Rh (99.9%), Re (99.97%), Ir (99.9%), Pt (99.98%) wires were purchased from Nilaco (Tokyo, Japan). Proton-conducting membrane (Nafion®, NRE-212) was purchased from Sigma-Aldrich Japan (Tokyo, Japan). Carbon felt (KURECA PAPER E-525) was purchased from KUREHA (Tokyo, Japan). All chemicals were used without further purification. A porous TiO2 sphere (PTS) was synthesized by a procedure reported previously [Citation19]. A mixture of 1 mL of titanium tetrabutoxide, 10 mL of 2-propanol, and 30 mL of N,N-dimethylformamide were transferred into a 50 mL Teflon-lined autoclave and heated in an electric oven at 200 °C for 20 h. The product was collected by centrifugation and washed thoroughly with acetone and methanol. Obtained powder was calcined under air flow at 500 °C, and then PTS was synthesized. JRC-TIO-2, 7, 8, and 13 (Japan Reference Catalyst of TiO2, anatase-type TiO2 nanoparticles) were used as TiO2 samples.
2.2. Electrochemical studies
All electrochemical experiments were conducted using a three-electrode system connected to a VersaSTAT 4 potentiostat (Princeton Applied Research, Oak Ridge, TN, USA) or a HZ-7000 (Hokuto Denko, Tokyo, Japan). A coiled Pt wire (length 230 mm, diameter 0.5 mm, BAS Inc., Tokyo, Japan) was used as a counter electrode. An Ag/AgCl (RE-1B, BAS) or an Hg/HgO (RE-6A, BAS) reference electrode was used in acidic or alkaline conditions, respectively. Potentials applied to the working electrode were measured against a reference electrode and converted to the reversible hydrogen electrode (RHE) reference scale using:
2.2.1. Preparation of working electrodes
Ti, V, Fe, Co, Ni, Cu, Zn, Zr, Nb, Mo, Pd, Ag, Ta, W, Au plates (1 × 1 cm2) and Rh, Re, Ir, Pt wires (length 3 cm, diameter 0.5 mm) were used as a metal electrode for GC oxidation. Pt/C applied electrode was prepared using a commercial Pt/C (Alfa Aesar). An ethylene glycol suspension (0.225 g) of 20 wt% Pt/C was applied onto carbon felt (2 × 2 cm2). Japan Reference Catalyst of TiO2 (JRC-TIO) powders were used as electrode materials. A TiO2 electrode was prepared as follows. 4 mg of JRC-TIO-7 powder and 8 μL of 5 wt% Nafion solution were dispersed in 4 mL of 1:1 v/v water/isopropanol mixed solvent for longer than 30 min sonication to form a homogeneous ink. Then, 10 μL of the catalyst ink containing 10 μg of catalyst was loaded onto a rotating disk electrode (RDE) with 3 mm in diameter, i.e. 0.14 mg cm−2 of catalyst loading density. Ti plates (2 × 2 cm) were used as an electrode substrate after calcination at 450 °C for 30 min under air flow. JRC-TIO samples having a distinct specific surface area (JRC-TIO-2, 7, 8, 9, and 13) were chosen as TiO2 catalysts. A suspension of TiO2 powder (10 mg) in methanol (0.2 mL) was applied to the calcined Ti plate, and then, the TiO2-applied Ti plate was calcined at 500 °C for 1 h under flowing air.
2.2.2. Cyclic voltammetry (CV) measurements
CV measurements were conducted by employing a three-electrode system connected to a VersaSTAT 4 potentiostat. An electrolyte aqueous solution (40 mL) was introduced into a glass cell (100 mL in volume). After the glass cell was tightly sealed with Teflon cap, Ar gas was bubbled for 30 min in order to purge the air from the inside of the cell. The current value was recorded against the applied potential with 10 mV/s scan rate and two scan cycles. The aqueous electrolyte solution containing 0.5 M Na2SO4 and 0.1 M (for metal electrodes) or 0.5 M (for Pt/C electrode) GC was used for acidic conditions, and the aqueous electrolyte solution containing 20 wt% KOH and 0.5 M GC was used for alkaline condition. The blank CV measurements were conducted with the electrolyte solution without GC. For acidic conditions, pH of the blank electrolyte solution was adjusted with H2SO4 to be identical to that of the corresponding electrolyte solution with GC.
2.2.3. Linear sweep voltammetry measurements
Linear sweep voltammetry measurements were conducted by employing a three-electrode system connected to a HZ-7000 using RDE as a working electrode with varying rotating speed from 1000 rpm to 4000 rpm. An electrolyte aqueous solution (80 mL of 0.03 M OX and 0.2 M Na2SO4) was introduced into a glass cell (100 mL in volume, ALS Co., Ltd, Tokyo, Japan). After the glass cell was tightly sealed with Teflon cap, Ar gas was bubbled for 30 min to remove the air from the inside of the cell. The current value was recorded against the applied potential with 10 mV s−1 scan rate. The CV measurement for a blank solution was carried out by following the same procedures above-mentioned except for using electrolyte solution (80 mL of 0.2 M Na2SO4).
2.2.4. Electrochemical oxidation of GC and product analysis
The electrochemical oxidation of GC at a constant potential, i.e. chronoamperometry (CA), was performed in a two-compartment electrochemical cell sealed to be gas-tight with Teflon caps. A piece of proton-conducting membrane was used as a separator. An aqueous electrolyte solution (0.5 M Na2SO4+0.5 M GC or 20 wt%, i.e. 3.56 KOH+0.5 M GC or 3.56 M LiOH+0.5 M GC, 38 mL) was introduced into an anodic cell (75 mL in volume) into which the working and reference electrode were subsequently immersed. A counter electrode was placed in a cathodic cell (75 mL in volume) containing an aqueous electrolyte solution (0.5 M Na2SO4 (pH adjusted to 2.3 with H2SO4) or 20 wt% KOH, 38 mL). After the Teflon caps were tightly closed, Ar gas was bubbled in both the anodic and cathodic cells for 30 min to purge the air from the cell. GC electrooxidation was conducted at 1.5 V vs. RHE and 50 °C for 2 h where the potential was controlled using a VersaSTAT 4 potentiostat. The reaction solution was collected from the anodic cell and analyzed using a high-performance liquid chromatograph (HPLC, LC-20AD, Shimadzu, Kyoto, Japan) equipped with a refractive index detector (RID-10A, Shimadzu). The gas was collected from the anodic cell and analyzed using gas chromatograph (GC, GC-8A, Shimadzu). In the case of alkaline condition, the electrolyte solution after CA experiment was neutralized with H2SO4, and generated CO2 was quantified by GC.
2.2.5. Electrochemical reduction of OX and product analysis
CA experiments were conducted by employing a three-electrode system connected to a VersaSTAT4 potentiostat. The sample-modified Ti plate electrodes (2 × 2 cm) and RDE were used as a working electrode. The electrochemical reduction of OX at −0.7 V vs. RHE for Ti plate electrodes and −1.5 V vs. RHE for RDE was performed in a two-compartment electrochemical cell (75 mL volume for each). A piece of proton-conducting membrane was used as a separator. Electrolyte aqueous solutions (cathode: 40 mL of 0.03 M OX and 0.2 M Na2SO4, anode: 0.2 M Na2SO4) were introduced into the cells. The working/reference and counter electrodes were placed inside the cathode and anode cell, respectively. The pH value of the electrolyte solution in the cells was adjusted at 2.1 by adding H2SO4 solution. After the Teflon caps were tightly closed, Ar gas was bubbled both in cathode and anode cells for 30 min to purge the air from the cells. OX electrochemical reductions were conducted by controlling the working electrode potential at 50 °C. The reaction solution was collected from the cathode cell and analyzed using the HPLC.
2.2.6. Definition of Faradaic yield
The Faradaic yield in the electrochemical experiments is defined by the following equation:
where m products is the moles of products; n represents the number of electrons required for the formation of products in GC oxidation (n = 2, 4, 1, and 3 for formation of glyoxylic acid, OX, HCOOH, and CO2, respectively) and OX reduction (n = 2 and 4 for formation of GO and GC, respectively); F is Faraday constant (96,485 C/mol); and Q is the total charge in Coulombs passed across the electrode during the electrolysis.
2.2.7. Koutecky–Levich equation
Koutecky–Levich plots (J
−1 vs. ω
−1/2) were analyzed at various electrode potentials [Citation23]. The slopes of linear fit lines were used to calculate the number of electrons transferred (n) on the basis of the Koutecky–Levich equation:
where J is the measured current density, J K and J L are the kinetic- and diffusion-limiting current densities, ω is the angular velocity, n is transferred electron number, A is the area of electrode/electrocatalyst, C 0 is the bulk concentration of OX, D 0 is the diffusion coefficient of OX, ν is the kinematic viscosity of the electrolyte.
3. Results and discussion
3.1. GC oxidation
3.1.1. Catalytic activity test for transition metal electrodes
The catalytic test on a transition metal electrode for electrochemical oxidation of GC was conducted by performing cyclic voltammetry (CV) measurements using a metal plates of Ti, V, Fe, Co, Ni, Cu, Zn, Zr, Nb, Mo, Pd, Ag, Ta, W, and Au or wires of Rh, Re, Ir, and Pt as a working electrode in the presence and absence of GC. Figures shows CVs recorded with the transition metal working electrodes in 0.5 M Na2SO4 aqueous solution containing and not containing 0.1 M GC.
Figure 1. CVs (two-cycle scan) of V (a), Fe (b), Co (c), Cu (d), Zn (e), Mo (f), Re (g), and W (h) recorded in 0.1 M GC+0.5 M Na2SO4 (solid line) and 0.5 M Na2SO4 (broken line). The current range of graphs (a–g) is fixed to –50 to 700 mA.
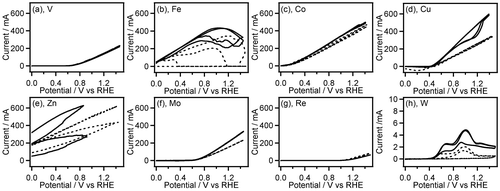
Figure 2. CVs (three-cycle scan) of Ti (a,b), Zr (c,d), Nb (e,f), Ta (g,h), and Ni (i,j) recorded in 0.1 M GC+0.5 M Na2SO4 (solid line) and 0.5 M Na2SO4 (broken line). The first (a,c,e,g,i) and the second, third (b,d,f,h,j) scan cycles of CVs are depicted separately. The current range of graphs (a–h) is fixed to –20 to 140 μA.
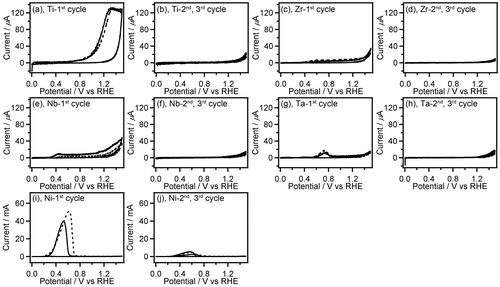
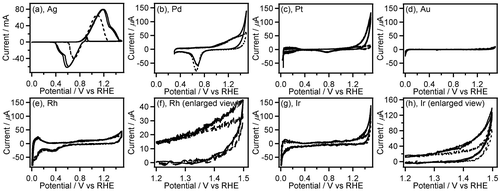
Figure 3. CVs (two-cycle scan) of Ag (a), Pd (b), Pt (c), Au (d), Rh (e,f), and Ir (g,h) recorded in 0.1 M GC+0.5 M Na2SO4 (solid line) and 0.5 M Na2SO4 (broken line). The current range of graphs (b–e,g) is fixed to –80 to 700 mA.
Most of the non-noble metals such as V, Fe, Co, Cu, Zn, Mo, Re and W showed large anodic current (peak current: 5–700 mA) in their CVs (Figure ). After the CV measurement of these metals, the surface of the metal plates lost luster and became dull, and the metal plates seemed to be smaller than their original size. Furthermore, the electrolyte solution after the CV measurements of Fe, Co, and Cu electrodes had characteristic colors (Figure ) originated from their ions. These observations suggest that oxidation of these metals results in elution of the metal ion into the electrolyte solution. Interestingly, the anodic current obtained in CVs of Fe, Co, Cu, Zn, Mo, and W was increased in the presence of GC. Therefore, these metals may have certain ability to catalyze electrooxidation of GC although the elution of metal ions occurs, which is an unfavorable feature for the electrooxidation catalysts. On the other hand, other non-noble metals, i.e. Ti, Zr, Nb, Ta and Ni exhibited lower anodic current (peak current: 20 μA–60 mA) in the first cycle of the CVs, and the anodic current decreased drastically in the second CV cycle (Figure ), suggesting the oxide film formation on the metal surface.
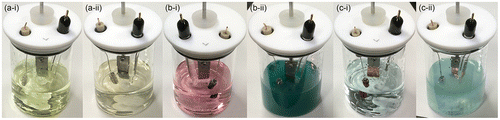
Figure 4. The colors of electrolyte solution after the CV measurements of Fe (a), Co (b), and Cu (c) electrodes in 0.1 M GC+0.5 M Na2SO4 (i) and 0.5 M Na2SO4 (ii).
Among the noble metals such as Ag, Pd, Pt, Au, Rh and Ir, only Ag displayed the large anodic waves (peak current: 60–80 mA) in the forward (positive) scans of the CVs accompanied by the corresponding cathodic waves in the reverse (negative) scans (Figure (a)). It is widely known that electrooxidation of Ag in aqueous solution gives Ag2O film on the Ag surface, and electroreduction of resulting Ag2O affords the original Ag metal [Citation24–26]. Therefore, the observed redox waves can be attributed to the Ag/Ag2O redox reaction. In this work, we used metal wires as electrode for CV measurement of Pt, Rh, Ir, and Re. The surface area of the metal wires is smaller than that of the metal plates (wires: ca. 0.47 cm2, plates: ca. 2 cm2). Even though we consider the smaller surface area of the metal wires, the anodic current in the absence of GC on the noble metals except for Ag, i.e. Pd, Pt, Au, Rh and Ir is very small (peak current: <80 μA, Figure (b)–(h)), which suggests the high oxidation resistance of these noble metals. In the CVs on the electrode of Rh, Pd, Ir, and Pt, the anodic current at potential more positive than 1.2 V vs. RHE was clearly increased in presence of GC, indicating electrochemical GC oxidation catalyzed on these metal electrodes. These results of CV measurements suggest that Rh, Pd, Ir, and Pt have preferable features, including high oxidation resistance and catalytic activity, for electrochemical oxidation of GC, and Pt shows the highest catalytic activity among all electrodes used here. We, hence, examined characteristics of Pt/C catalyzed electrochemical oxidation of GC in both acidic and alkaline media.
3.1.2. Pt/C catalyzed electrochemical oxidation of GC
Figure (a) and (b) compare CVs of Pt/C loaded carbon-felt electrode recorded in acidic (0.5 M GC+0.5 M Na2SO4, pH 2.3, (a)) and alkaline (0.5 M GC+20 wt% KOH, pH 14, (b)) media at 50 °C. The anodic current for the GC oxidation in acidic and alkaline media arose at 1.1 and 0.3 V vs. RHE, respectively, and increased constantly with potential to reach 150 and 500 mA at 1.5 V, respectively. Ample studies have demonstrated that the high concentration of OH− in the electrolyte and adsorbed OH on the Pt surface greatly facilitate the de-protonation of alcohols, and thus significantly lower energy barrier of alcohol oxidation reaction [Citation27–29]. This explains the substantial reduction of the onset potential and increase of catalytic current for the GC oxidation in alkaline media. In acidic solution, the catalytic current observed on the reverse (negative) scan was obviously lower than that obtained on the forward (positive) scan, and an anodic peak centered at 0.57 V was observed only in the reverse scan. (Figure (a)). This indicates that the catalyst was deactivated by the adsorption of CO generated by oxidative degradation of GC on the catalyst surface (vide infra), and the anodic peak around 0.6 V on the reverse scan is attributable to reactivation of the catalyst due to the desorption of CO.
Figure 5. CVs of Pt/C in 0.5 M GC+0.5 M Na2SO4 (a) and 0.5 M GC+20 wt% KOH (b) at 50 °C. And CA curves of Pt/C in 0.5 M GC+0.5 M Na2SO4 (c) and 0.5 M GC+20 wt% KOH (d) at 50 °C.
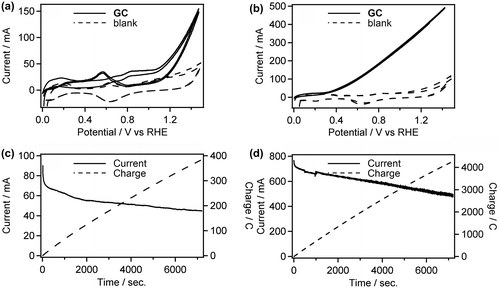
To elucidate the long-term stability of the Pt/C electrode and determine the oxidation products of GC, chronoamperometry (CA) experiments were performed in both acidic (0.5 M GC+0.5 M Na2SO4, pH 2.3) and alkaline (0.5 M GC+20 wt% KOH, pH 14) media at 50 °C. The applied potential of the CA experiments (1.5 V vs. RHE for both acidic and alkaline conditions) was decided from the CV results to obtain sufficient current necessary to products determination. Interestingly, Pt/C catalyst maintained the high activity (490‒770 mA) during the CA experiment in alkaline media (Figure (d)), while the catalyst was drastically deactivated in initial stage of the CA experiment, up to 80 s, and the electroreaction proceeded with the damaged catalyst (45‒65 mA) in acidic media (Figure (c)), Consequently, 385 and 4300 °C of charge passed across the electrode during the 7200 s of the CA experiment in acidic and alkaline media, respectively. Figure (a) and (b) show the products obtained in these CA experiments and Faradaic yield for each product, and Scheme illustrates the pathway for electrooxidation of GC as inferred from the literature describing the electrochemical ethylene glycol oxidation [Citation27–33]. The main products in GC oxidation in acidic solution were CO2 and formic acid (90.9 and 7.2% Faradaic yield, respectively). The preferential formation of the C1 compounds indicates the accelerated occurrence of the C‒C bond cleavage in the reacting molecules followed by further oxidation of the C1 intermediates generating adsorbed CO [Citation27,32]. This result supports our consideration for the catalyst deactivation observed in the CV and the CA experiments in acidic media. In addition, dissolution of Pt can be another reason for reduced activity of Pt/C catalyst in acidic media. It is reported that degradation of Pt catalyst for the fuel cell electrodes is caused by dissolution redeposition of Pt and acidic condition enhances Pt dissolution [Citation34,35]. On the other hand, electrooxidation of GC in alkaline media afforded OX and CO2 (47.8 and 52.1% Faradaic yield, respectively). To elucidate effects of the applied potential, temperature and alkali cations on the product selectivity, we conducted CA experiment under varied conditions. The CA experiment performed at the applied potential of 1.2 V in 0.5 M GC with 20 wt% KOH at 50 °C resulted in 51.7 and 47.5% of Faradaic yields for the formation of OX and CO2, respectively (Figure (c)), although we obtained approximately 100% selectivity for OX production under the same conditions in our previous paper [Citation19]. A possible reason for the difference in the product selectivity between the present and the previous experiments is certain differences in Pt/C catalysts used. We are now examining catalytic ability of various metal nanoparticles and nanoalloys for electrochemical GC oxidation in ongoing study, and it is becoming clear that subtle difference in catalyst properties, including size, morphology, and composition, greatly affects product selectivities. Figure (b)–(d) reveal that the reaction temperature gives greater influence on the product selectivity rather than applied potential. Sitta et al. investigated the effect of alkali cations, such as Li+, Na+ and K+ cations, on the electrocatalytic oxidation of ethylene glycol on a Pt electrode in alkaline media [Citation36]. In this study, we demonstrated that alkali cations made a significant impact on the product selectivity. In the CA experiment using LiOH as an electrolyte, Faradaic yield for OX production attained 92.2% (Figure (e)), which is approximately twice as high as the yield with K+ ions (Figure (b)). Garcia-Arez et al. suggested that alkali cations can form an ion pair with anions adsorbed on Pt surface [Citation37]. It is well known that alkali cations forms a cluster-like structure with water molecules (M+(H2O)X) in aqueous solutions, and a larger effective charge of Li+ facilitates the formation of a solvated cluster. The non-covalent interaction between OH species adsorbed on the surface, i.e. OHad and solvated cations inactivates OHad and blocks the catalyst surface, resulting in reduction of the amount of surface sites needed for the C–C bond breaking [Citation30]. Therefore, the smaller amount of the active surface site in LiOH solution realizes the high selectivity for OX production [Citation36]. These results suggest that environment-friendly power generation, i.e. low CO2 emission, will be achievable by optimizing catalysts and reaction conditions.
Figure 6. Faradaic yields for CO2, OX, GO, and HCOOH in GC electro-oxidation (a) at 1.5 V in 0.5 M GC and 0.5 M Na2SO4 at 50 °C, (b) at 1.5 V in 0.5 M GC and 20 wt%, i.e. 3.56 M KOH at 50 °C, (c) at 1.2 V in 0.5 M GC and 20 wt% KOH at 50 °C, (d) at 1.5 V in 0.5 M GC and 20 wt% KOH at 40 °C and (e) at 1.5 V in 0.5 M GC and 3.56 M LiOH at 50 °C.
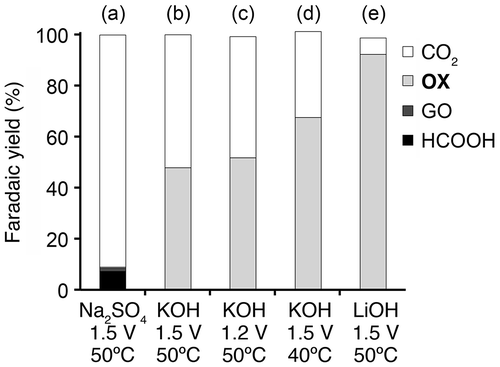
Figure 7. RDE linear sweep voltammograms of TiO2 in aqueous solution of 0.2 M Na2SO4 in the presence and absence of OX with various rotating rates at 50 °C.
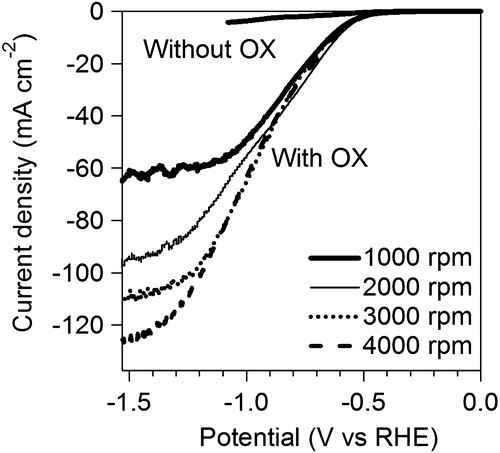
Figure 8. Koutecky–Levich plots at different potentials.
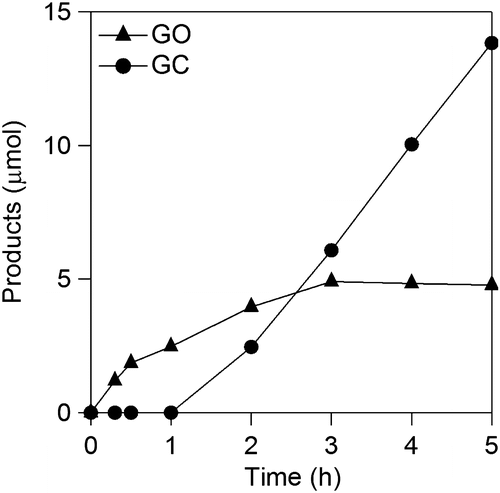
Figure 9. Time courses of GO and GC formations in a CA experiment at −1.5 V vs. RHE using RDE.
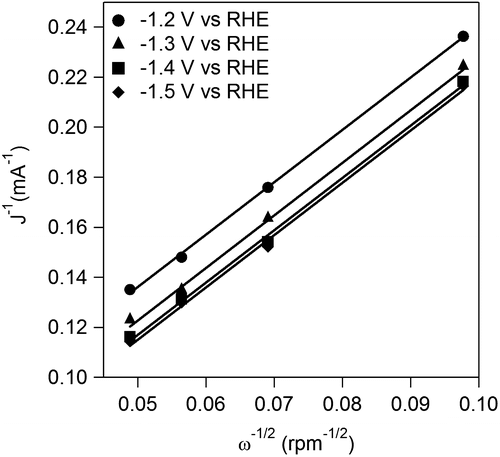
Figure 10a. Yields for GO and GC against specific surface area of TiO2.
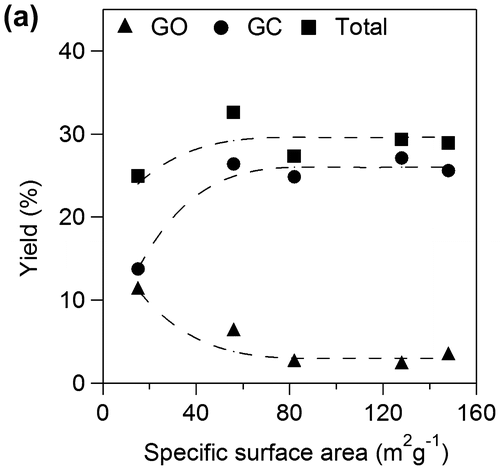
Figure 10b. Faradaic yields for GO and GC against specific surface area of TiO2.
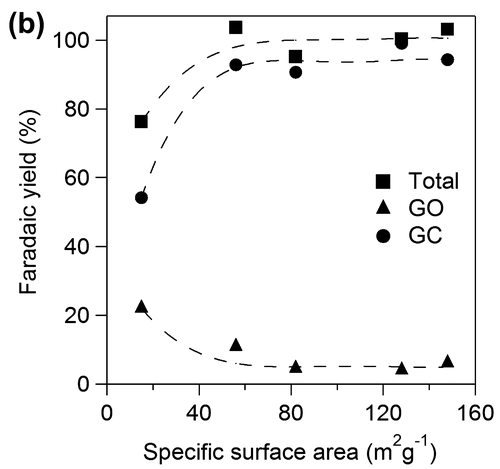
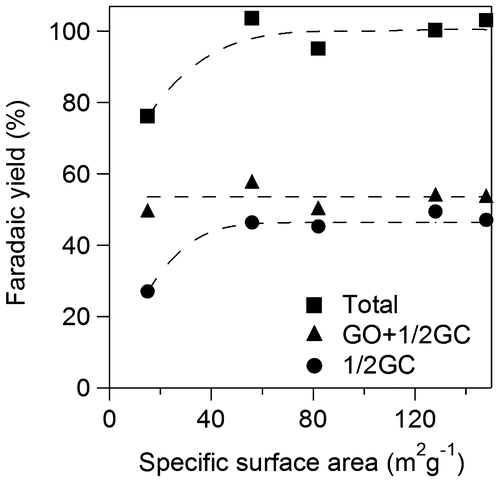
Figure 11. Faradaic yields for GO+1/2GC and 1/2GC against specific surface area of TiO2.
Scheme 1. Proposed pathway for GC oxidation.
3.2. OX reduction
3.2.1. Analysis of kinetics of OX reduction
Kinetics of OX reduction has not been investigated in detail although some studies for OX reduction were reported [Citation19,22]. We performed electrochemical reduction of OX using RDE to investigate the kinetics of OX reduction. Figure shows linear sweep voltammograms in aqueous solution of Na2SO4 in the presence and absence of OX using RDE with various rotating rate at 50 °C. Steep increase in current density was observed in the presence of OX while small current density was observed in the absence of OX below –0.3 V vs. RHE. The results indicated that the reductive currents were originated from OX reduction below −0.3 V vs. RHE.
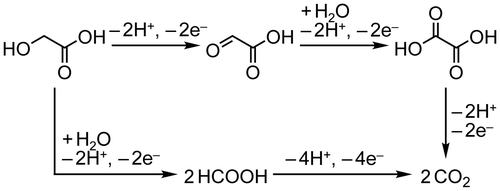
The kinetics of OX reduction including the electron transfer number (n) was analyzed on the basis of the Koutecky–Levich equation. Figure shows Koutecky–Levich plots obtained from the polarization curves at various potentials in Figure . The linearity of the Koutecky–Levich plots and near parallelism of the fitting lines suggest the first-order reaction kinetics toward the concentration of OX and similar electron transfer numbers for OX reduction at different potentials [Citation38]. The n values were calculated to be 2.3 at 1.2–1.5 V vs. RHE from the slopes of Koutecky–Levich plots. The n value, 2.3, corresponds to reduction of OX to GO. However, the large amount of GC, four-electron reduction compound, was observed in the CA experiments using Ti plate electrodes in our previous work [Citation19]. To elucidate the discrepancy, we performed a CA experiment using RDE. Figure shows time courses of the amount of GO and GC in a CA experiment using RDE at –1.5 V vs. RHE. Although GO formation was observed in the initial period of the experiment, the amount of GC was increased after 1.5 h. Considering that GC is detectable after 30 min in CA experiment using a Ti plate electrode in the previous work, the difference in products is probably assignable to the difference in the electrode area, i.e. areas of Ti plate and RDE are 4.0 and 0.071 cm2, respectively. Small electrode surface area of RDE causes a long reaction time for reduction of GO to GC because GO molecules formed through two-electron reduction of OX immediately desorb from TiO2 catalysts on RDE and diffuse into solution. On the other hand, reduction of GO to GC on a Ti plate relatively easily occurs due to the larger number of catalytic sites located on a Ti plate electrode. From a LSV curve recorded using RDE in 3 min, where only the GO formation proceeds (Figure ), we obtained 2.3 of the n value, whereas GC formation was observed in the experiments using a Ti plate. Time courses of product concentrations, as shown in Figure , seem to correspond with product distributions at the initial period on the Ti plate electrode because the area of Ti plate is 56 times larger than that of the RDE and reactions proceed faster on a larger electrode. Based on these results, we concluded that the four-electron reduction of OX to GC proceeds through successive two-electron reductions as described in Equations (Equation2(2)
(2) ) and (Equation3
(3)
(3) ). The OX is first reduced to GO through two-electron reduction, and then GC is produced from GO through further two-electron reduction.
(2)
(2)
(3)
(3)
3.2.2. Effects of specific surface area of TiO2 catalyst on performance of OX reduction
We examined effects of specific surface area of TiO2 catalyst applied onto Ti plate electrodes for OX reduction. Figure shows yields for GO and GC using various TiO2 electrodes for 2 h. Total yields for GO and GC increased with increase in specific surface area up to 60 m2 g−1 and became almost constant above 60 m2 g−1. The results suggest that the larger number of active sites contributes to higher yield in the range of small specific surface area and concentration of OX can be a rate determining factor on the catalysts having larger surface area above 60 m2 g−1, i.e. the TiO2 cathode having larger specific area would show higher activity for higher concentration of OX. Yields of GC increased with increase in specific surface area while yield of GO decreased up to 60 m2 g−1 and both yields also became constant above 60 m2 g−1. The results suggest that larger specific surface area also contributes to higher selectivity for GC. Next, we investigated effects of specific surface area on the product selectivity from the aspect of the amount of electrons consumed for production of GO, GC, and H2. Electrochemical reduction of OX to GC proceeded through successive two-electron reductions as described above, and H2 production by proton reduction is only regarded as a side reaction [Citation21]. Thus, target reactions in the system were reduction of OX to GO, reduction of GO to GC, and reduction of protons to H2. Figure shows Faradaic yields for GO and GC against specific surface area of TiO2. Total Faradaic yield of GO for GC increased with increase in the specific surface area up to 60 m2 g−1 and reached almost 100% above 60 m2 g−1. Faradaic yield of GO decreased and Faradaic yield of GC increased with increase in specific surface area. We reconstructed Faradaic yields for GO and GC in Figure to investigate product selectivity based on the amount of electrons used for reduction as follows. GC is produced from OX through GO formation by successive two-electron reductions. Therefore, a half of Faradaic yield for GC should be considered to be equal to the Faradaic yield for GO. Figure shows the half of Faradaic yield for GC (1/2GC) and summation of Faradaic yield for GO and the half of Faradaic yield for GC (GO+1/2GC) against specific surface area. Faradaic yield for 1/2GC, i.e. selectivity for reduction of GO to GC, was increased with increase in specific surface area up to 60 m2 g−1 and became almost constant above 60 m2 g−1 and Faradaic yield for GO+1/2GC i.e. reduction of OX to GO was constant around 55% in the all range of specific surface area. H2 production occurred below 60 m2 g−1 specific surface area since total Faradaic yield of GO and GC did not reach 100%. The results indicate that reduction of GO to GC competed with reduction of proton to H2 in the range of small specific surface area and large specific surface area contributed to suppression of proton reduction. Therefore, promotion of GO reduction and suppression of H2 production in the range of large specific surface area resulted in high selectivity of GC as shown in Figure . Although we cannot determine a definitive factor for the selectivity at this stage, surface area is considered to be one of controlling factors in this system. Based on the results, the TiO2 cathode having large specific surface area is appropriate for high yield and selectivity for GC in the OX reduction system.
4. Conclusions
In this work, fundamental experiments on both GC oxidation and OX reduction were conducted. The CV measurement with various transition metal electrode in aqueous solution containing GC demonstrated that Rh, Pd, Ir, and Pt have preferable features as a catalyst for electrochemical oxidation of GC, and Pt has the highest catalytic activity. We found that the selective oxidation of GC to OX on Pt/C more favorably proceeds in alkaline media. In particular, electrooxidation of GC in LiOH solution resulted in dominant formation of OX, i.e. 92.2% of Faradaic yield. The kinetic study of OX reduction clearly indicated that four-electron reduction of OX to form GC proceeds through two successive two-electron reductions. In addition, it was elucidated that application of TiO2 catalysts with large specific area to electrochemical reduction of OX can effectively suppress H2 production and achieve high selectivity for OX reduction. We hope that these findings will contribute not only to improve the energy efficiency for CN circulation but also to enhance catalytic conversion in any other electrochemical reactions using alcohol or acid molecules.
Disclosure statement
No potential conflict of interest was reported by the authors.
Funding
This work was supported by Japan Science and Technology Agency – CREST.
Related Research Data
References
- Turner JA . Sustainable hydrogen production. Science. 2004;305:972–974.10.1126/science.1103197
- Muradov NZ , Veziroglu TN . ‘Green’ path from fossil-based to hydrogen economy: an overview of carbon-neutral technologies. Int J Hydrogen Energy. 2008;33:6804–6839.10.1016/j.ijhydene.2008.08.054
- Züttel A , Borgschulte A , Schlapbach L . Hydrogen as a future energy carrier. Weinheim: Wiley-VCH; 2011.
- Mazloomi K , Gomes C . Hydrogen as an energy carrier: Prospects and challenges. Renew Sustainable Energ Rev. 2012;16:3024–3033.10.1016/j.rser.2012.02.028
- Sharma S , Ghoshal SK . Hydrogen the future transportation fuel: from production to applications. Renew Sust Energ Rev. 2015;43:1151–1158.10.1016/j.rser.2014.11.093
- Armaroli N , Balzani V . Solar electricity and solar fuels: status and perspectives in the context of the energy transition. Chem Eur J. 2016;22:32–57.10.1002/chem.201503580
- Barbir F . Transition to renewable energy systems with hydrogen as an energy carrier. Energy. 2009;34:308–312.10.1016/j.energy.2008.07.007
- Hosseini SE , Wahid MA . Hydrogen production from renewable and sustainable energy resources: promising green energy carrier for clean development. Renew Sust Energ Rev. 2016;57:850–866.10.1016/j.rser.2015.12.112
- Lu QP , Yu YF , Ma QL , et al . 2D transition-metal-dichalcogenide-nanosheet-based composites for photocatalytic and electrocatalytic hydrogen evolution reactions. Adv Mater. 2016;28:1917–1933.10.1002/adma.201503270
- Safizadeh F , Ghali E , Houlachi G . Electrocatalysis developments for hydrogen evolution reaction in alkaline solutions - A Review. Int J Hydrog Energy. 2015;40:256–274.10.1016/j.ijhydene.2014.10.109
- Zeng M , Li YG . Recent advances in heterogeneous electrocatalysts for the hydrogen evolution reaction. J Mater Chem A. 2015;3:14942–14962.10.1039/C5TA02974K
- Alhumaidan F , Cresswell D , Garforth A . Hydrogen storage in liquid organic hydride: producing hydrogen catalytically from methylcyclohexane. Energy Fuels. 2011;25:4217–4234.10.1021/ef200829x
- Klerke A , Christensen CH , Nørskov JK , et al . Ammonia for hydrogen storage: challenges and opportunities. J Mater Chem. 2008;18:2304–2310.10.1039/b720020j
- Orimo S-I , Nakamori Y , Eliseo JR , et al . Complex hydrides for hydrogen storage. Chem Rev. 2007;107:4111–4132.
- Hull JF , Himeda Y , Wang W-H , et al . Reversible hydrogen storage using CO2 and a proton-switchable iridium catalyst in aqueous media under mild temperatures and pressures. Nat Chem. 2012;4:383–388.10.1038/nchem.1295
- Matsumoto T , Sadakiyo M , Ooi ML , et al . CO2-free power generation on an iron group nanoalloy catalyst via selective oxidation of ethylene glycol to oxalic acid in alkaline media. Sci Rep. 2014;4:5620.
- Matsumoto T , Sadakiyo M , Ooi ML , et al . Atomically mixed Fe-group nanoalloys: catalyst design for the selective electrooxidation of ethylene glycol to oxalic acid. Phys Chem Chem Phys. 2015;17:11359–11366.10.1039/C5CP00954E
- Takeguchi T , Arikawa H , Yamauchi M , et al . Selective ethylene glycol oxidation reaction for carbon neutral energy cycle system. ECS Trans. 2011;41:1755–1759.10.1149/1.3635707
- Watanabe R , Yamauchi M , Sadakiyo M , et al . CO2-free electric power circulation via direct charge and discharge using the glycolic acid/oxalic acid redox couple. Energy Environ Sci. 2015;8:1456–1462.10.1039/C5EE00192G
- Yamauchi M , Ozawa N , Kubo M . Experimental and quantum chemical approaches to develop highly selective nanocatalysts for CO2-free power circulation. Chem Rec. 2016;16:2249–2259.10.1002/tcr.v16.5
- Kitano S , Yamauchi M , Hata S , et al . Hydrogenation of oxalic acid using light-assisted water electrolysis for the production of an alcoholic compound. Green Chem. 2016;18:3700–3706.10.1039/C6GC01135G
- Zhao FM , Yan F , Qian Y , et al . Roughened TiO2 film electrodes for electrocatalytic reduction of oxalic acid to glyoxylic acid. J Electroanal Chem. 2013;698:31–38.10.1016/j.jelechem.2013.03.014
- Chen W , Chen SW . Oxygen electroreduction catalyzed by gold nanoclusters: strong core size effects. Angew Chem Int Ed. 2009;48:4386–4389.10.1002/(ISSN)1521-3773
- Dirkse TP , Vries DB . The effect of continuously changing potential on the silver electrode in alkaline solutions. J Phys Chem. 1959;63:107–110.10.1021/j150571a028
- Teijelo ML , Vilche JR , Arvía AJ . Complex potentiodynamic response of silver in alkaline Electrolytes in the potential range of the Ag/Ag2O Couple. J Electroanal Chem. 1982;131:331–339.10.1016/0022-0728(82)87082-4
- Wan Y , Wang XL , Liu SY , et al . Effect of electrochemical factors on formation and reduction of silver oxides. Int J Electrochem Sci. 2013;8:12837–12850.
- Bełtowska-Brzezinska M , Luczak T , Holze R . Electrocatalytic oxidation of mono- and polyhydric alcohols on gold and platinum. J App Electrochem. 1997;27:999–1011.10.1023/A:1018422206817
- Simões M , Baranton S , Coutanceau C . Electro-oxidation of glycerol at Pd based nano-catalysts for an application in alkaline fuel cells for chemicals and energy cogeneration. App Catal B. 2010;93:354–362.10.1016/j.apcatb.2009.10.008
- Xin L , Zhang Z , Qi J , et al . Electrocatalytic oxidation of ethylene glycol (EG) on supported Pt and Au catalysts in alkaline media: Reaction pathway investigation in three-electrode cell and fuel cell reactors. App Catal B. 2012;125:85–94.10.1016/j.apcatb.2012.05.024
- Christensen PA , Hamnett A . The oxidation of ethylene-glycol at a platinum-electrode in acid and base – an in situ FTIR study. J Electroanal Chem. 1989;260:347–359.10.1016/0022-0728(89)87149-9
- Chang SC , Ho YH , Weaver MJ . Applications of real-time FTIR spectroscopy to the elucidation of complex electroorganic pathways – Electrooxidation of ehylene-glycol on gold, platinum, and nickel in alkaline-solution. J Am Chem Soc. 1991;113:9506–9513.10.1021/ja00025a014
- Wieland B , Lancaster JP , Hoaglund CS , et al . Electrochemical and infrared spectroscopic quantitative determination of the platinum-catalyzed ethylene glycol oxidation mechanism at CO adsorption potentials. Langmuir. 1996;12:2594–2601.10.1021/la9506943
- Bambagioni V , Bevilacqua M , Bianchini C , et al . Ethylene glycol electrooxidation on smooth and nanostructured Pd electrodes in alkaline media. Fuel Cells. 2010;10:582–590.10.1002/fuce.v10:4
- Mitsushima S , Koizumi Y , Uzuka S , et al . Dissolution of platinum in acidic media. Electrochim Acta. 2008;54:255–460.
- Yadav AP , Okayasu T , Sugawara Y , et al . Effects of pH on dissolution and surface area loss of platinum due to potential cycling. J Electrochem Soc. 2012;159:C190.10.1149/2.065204jes
- Sitta E , Batista BC , Varela H . The impact of the alkali cation on the mechanism of the electro-oxidation of ethylene glycol on Pt. Chem Commun. 2011;47:3775–3777.10.1039/c0cc05353 h
- Garcia-Araez N , Climent V , Rodriguez P , et al . Thermodynamic evidence for K+–SO4 2− ion pair formation on Pt(111). New insight into cation specific adsorption. Phys Chem Chem Phys. 2010;12:12146–12152.10.1039/c0cp00247j
- Mayrhofer KJJ , Strmcnik D , Blizanac BB , et al . Measurement of oxygen reduction activities via the rotating disc electrode method: From Pt model surfaces to carbon-supported high surface area catalysts. Electrochim Acta. 2008;53:3181–3188.10.1016/j.electacta.2007.11.057