
 ?Mathematical formulae have been encoded as MathML and are displayed in this HTML version using MathJax in order to improve their display. Uncheck the box to turn MathJax off. This feature requires Javascript. Click on a formula to zoom.
ABSTRACT
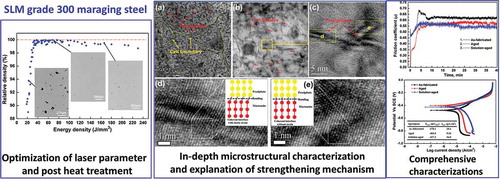
A nearly fully dense grade 300 maraging steel was fabricated by selective laser melting (SLM) additive manufacturing with optimum laser parameters. Different heat treatments were elaborately applied based on the detected phase transformation temperatures. Microstructures, precipitation characteristics, residual stress and properties of the as-fabricated and heat-treated SLM parts were systematically characterized and analyzed. The observed submicron grain size (0.31 μm on average) suggests an extremely high cooling rate up to 107 K/s. Massive needle-shaped nanoprecipitates Ni3X (X = Ti, Al, Mo) are clearly present in the martensitic matrix, which accounts for the age hardening. The interfacial relations between the precipitate and matrix are revealed by electron microscopy and illustrated in detail. Strengthening mechanism is explained by Orowan bowing mechanism and coherency strain hardening. Building orientation-based mechanical anisotropy, caused by ‘layer-wise effect’, is also investigated in as-fabricated and heat-treated specimens. The findings reveal that heat treatments not only induce strengthening, but also significantly relieve the residual stress and slightly eliminate the mechanical anisotropy. In addition, comprehensive performance in terms of Charpy impact test, tribological performance, as well as corrosion resistance of the as-fabricated and heat-treated parts are characterized and systematically investigated in comparison with traditionally produced maraging steels as guidance for industry applications.
Graphical Abstract
1. Introduction
Maraging steel (MS) is a special advanced high-strength steel developed in the 1960s, which combines ultra-high strength with good toughness and ductility [Citation1,Citation2]. The ultra-high strength is caused by precipitation strengthening of intermetallics (such as Fe2Mo, NiAl, Ni3(Ti, Al, Mo), Ni(Al, Fe), etc.) with homogeneous distribution in the low-carbon martensitic matrix after aging at a temperature of about 455–510 °C. The high toughness and ductility originate from the relatively soft (about 30 HRC), ductile and machinable martensitic matrix [Citation3]. Since the martensitic matrix is highly alloyed low-carbon, iron-nickel lath martensites, containing a high dislocation density but no twinning. Application fields of MSs include rocket motor cases, aircraft structural components, motor racing, and metal casting dies, gears and fasteners, etc. [Citation4], which generally require ultra-high strength combined with good fracture toughness.
Selective laser melting (SLM), as a typical metal additive manufacturing (AM) technique, has attracted a lot of attention in recent years. During the SLM process, a thin layer (typically 20–100 μm) of powder is pre-coated by a blade coater, and then a laser beam is used to melt, solidify and bond powder particles together. It produces 3D parts in such an incremental layer-wise manner, with each layer geometrically determined by the sliced STL file [Citation5]. SLM is an aggregation of plenty of micro-welding processes, since the powder is locally melted by the absorption of laser radiation, and then the liquid melt pools solidify and metallurgically bond to the adjacent track and the previously sintered layer.
MS is a suitable metal material for SLM fabrication. The almost absolute lack of interstitial alloy elements in MS leads to good weldability [Citation6], which makes MS ideal for metal additive manufacturing processes, especially for the laser metal deposition (LMD) and SLM [Citation7]. Since the SLM shares the similar metallurgical process with micro-welding, in which a small melt pool is generated by laser melting the powder and achieving a solid material. Besides, the low carbon content in MS reduces the tendency of quench cracks. In comparison to the cooling rates during quenching (normally under 103 K/s) [Citation8], the SLM process has an extremely high cooling rate (up to 108 K/s) [Citation9]. Thus a material with a high resistance to quench cracking is of great significance for SLM fabrication. Moreover, because of the high cooling rate, the martensitic matrix is rapidly quenched from the austenitic region to the martensite onset temperature; as a result, MS produced by SLM has a relatively high strength compared to conventional processing methods without heat treatment [Citation7,Citation10].
More importantly, the unique feature of SLM offers several prominent advantages over other conventional manufacture methods, such as freedom of design, high spatial resolution, high resource efficiency, rapid customization and production, etc. [Citation11]. Recent researches successful displayed the complete feasibility of SLM high laser reflective copper alloy [Citation12], refractory pure tungsten [Citation13], functional multi-materials [Citation14], and graded lattice structures [Citation15]. Consequently, the SLM technology is an efficient method to expand application circumstances and fields of MS, such as conformal cooling injection tooling [Citation16,Citation17], MS-based functional multi-materials [Citation14,Citation18], and geometrically complex aircraft components which need excellent mechanical properties but small quantities.
Nevertheless, compared with the intensively reported titanium alloy [Citation19], nickel alloy [Citation20] and aluminium alloy [Citation21], relatively few researches concerning SLM fabricated MS have been reported, and they generally focused on laser process optimization [Citation22,Citation23], heat treatment exploration and mechanical performance development [Citation17,Citation24,Citation25]. However, the effects of building orientation on the mechanical properties, the influence of heat treatment on the mechanical anisotropy, precipitation behaviors and strengthening mechanisms, etc., are not yet systematically investigated. In this paper, high-performance MS was produced by SLM technique by optimizing parameters and the mentioned research blanks were addressed. Comprehensive performance of the SLM-produced parts was also characterized and systematically investigated in comparison with traditionally fabricated MS as guidance for the industrial applications.
2. Experimental details
The pre-alloyed spherical grade 300 MS powder (composition of Fe-18.2Ni-9Co-5.2Mo-0.8Ti-0.2Cr-0.15Al, wt%) supplied by Electro Optical Systems (EOS) GmbH (Krailling, Germany) was used as the raw material. The powder particles with a mean diameter of about 42 μm are almost spherical shapes. The oxygen content of the raw powder was measured to be 342 ppm. The experiments were carried out in an EOS M290 SLM (powder bed) system (EOS GmbH, Krailling, Germany). The oxygen content in the process chamber was maintained under 0.6% by pumping in continuous nitrogen. A layer thickness (t) of 40 μm was selected to match the particle size of the powder. The laser process parameters including laser power (P), scan speed (v) and hatch space (h) were optimized in the ranges of 200–370 W, 500–2300 mm/s and 50–150 μm, respectively. The laser scanned in a zigzag raster pattern with 67° rotation between the neighboring layers, which was illustrated in reference [Citation10].
Phase transformation temperatures (PTTs) of as-fabricated (AF) specimens were detected by using a Netzsch STA (Selb, Germany) 449 differential scanning calorimetry (DSC). The specimens were heated up to 900 °C with a heating rate of 10 °C/min in an argon protective atmosphere. Two kinds of post-fabrication heat treatments were elaborately chosen by referencing the PTTs determined in DSC analysis, that is, age-treatment (AT), and solution-age treatment (SAT). Samples were heat-treated in an argon atmosphere and air-cooled after the annealing.
The polished specimens were sectioned along the vertical (build) direction to study the effects of the laser parameters on the micropore and relative density using image analysis method. Ten images were captured at a fixed magnification of 25× on a Leica DMI5000M (Wetzlar, Germany) optical microscope (OM) for relative density analysis. Archimedes density was determined by an OHAUS Adventurer® Analytical balance (Parsippany, NJ, USA). The vertical and horizontal cross-sections after polish and etch were observed by the OM, and a Zeiss Merlin (Jena, Germany) field emission scanning electron microscope (FE-SEM). A JEOL 2100F (Tokyo, Japan) transmission electron microscopy (TEM) operated at 200 kV was used for observing nanosized structures and precipitates. Specimens taken from the vertical cross-section for electron back-scattered diffraction (EBSD) test were vibration polished. EBSD test was carried out on an FEI Nova NanoSEM 450 SEM system (Oregon, USA) at 20 kV through an EDAX Hikari EBSD detector (Mahwah, NJ, USA), using a step size of 50 nm. The EBSD data were analyzed using the OIM Analysis™ software (EDAX Inc., Mahwah, NJ, USA). The residual stress was determined by the sin2ψ method using a Malvern Panalytical X′ Pert (Almelo, Netherlands) X-ray diffraction (XRD) with Cu Kα radiation, in step scan mode with a step size of 0.02°, time per step 3 s. A high indexed lattice plane, i.e., fcc (220) diffraction peak, was used. The stress measurements were carried out using four angles ϕ (0°, 15°, 30°and 45°).
The mechanical properties of as-fabricated and heat treated specimens with both horizontal and vertical build directions were evaluated by hardness, tensile tests and Charpy impact tests. The hardness of the specimens was measured by a TH320 Rockwell hardness tester (Beijing, China) according to the 150 kg loaded Rockwell C scale (HRC), and estimated by an average value from 10 measured points. The tensile properties were evaluated by an Instron 5900 universal material testing machine (Norwood, MA, USA) based on ASTM (West Conshohocken, PA, USA) E8 with the cross head speed of 1 mm/min. Charpy impact tests were done according to ASTM E23 standard with a standard specimen size of 10 × 10 × 55 mm and a notch as the standard defined [Citation26]. Tribological tests for as-fabricated and heat treated specimens were carried out by using a Bruker UMT-3 ball-on-disc tribometer (Karlsruhe, Germany) with a 4 mm diameter silicon carbide (SiC) ball as counterpart at the room temperature in an ambient atmospheric condition. The testing parameters were set as: constant normal loading force of 10 N, rotating speed of 250 rpm, rotational diameter 5 mm and sliding time of 40 min. The worn surfaces were characterized by the FE-SEM and the wear tracks of the worn surfaces were investigated by a Bruker DektakXT 3D model Stylus Profiler (Karlsruhe, Germany). Potentiodynamic polarization tests of as-fabricated and heat-treated specimens were conducted using a Metrohm Autolab PGSTAT302N electrochemical workstation (Herisau, Switzerland) to study the anodic polarization behavior of the specimens in a 3.5% NaCl solution with pH value of 7 at room temperature (about 23 °C), and the exposure area of the specimens was 0.785 cm2. Polarization curves were recorded with a scan rate of 0.5 mV/s and a sweeping range from 400 mV below the open circuit potential (Eoc) to 400 mV above the Eoc.
3. Results
3.1. Laser parameter optimization
Generally, the volumetric laser energy density (E
v
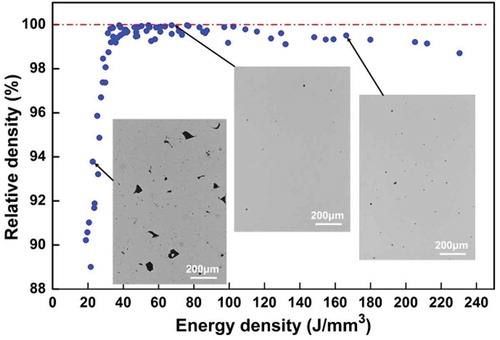
) can be calculated according to the equation . The density of an SLM-produced part strongly depends on the set-up of the laser parameters, and the principal goal of SLM processing methods is to produce fully dense parts. Thereby, the relative density versus E
v
was plotted in , representative micrographs showing densification characteristics were also included. Insufficient laser energy, especially when E
v < 35 J/mm3, caused irregular-shape pores with un-melted powder particles inside, which is a typical character of lacking fusion. With laser energy input increase, the porosity is reduced. However, higher energy inputs do not significantly improve the density, but cause a slight decrease of the density. Since higher laser energy will cause material vaporization and even attendant keyhole effect, when the vapor bubbles are trapped in the melt pools, then the defects will generate in the solidified melt pools [Citation27]. It was found that an optimum energy input of about 67 J/mm3 is required to get an almost fully dense part with a relative density of 99.9%. The P, v and h of the optimum parameters are 285 W, 960 mm/s and 110 μm, respectively.
Figure 1. Effect of volumetric laser energy (Ev ) on the relative density of SLM-produced MS.
3.2. Post-fabrication heat treatments
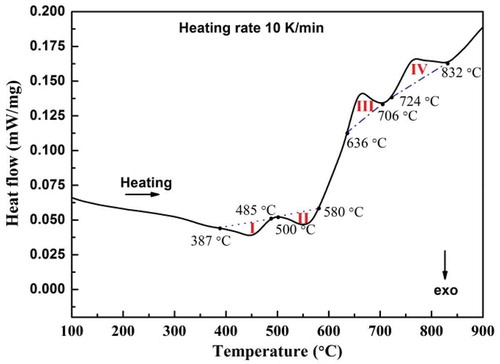
The phase transformation behaviors of the AF specimen produced using the optimum laser parameters were studied by DSC. The DSC curve in is characterized by two exothermic peaks (I and II zones), followed by two endothermic peaks (III and IV zones). The zone I exothermic peak at 387–485 °C corresponds to the recovery of martensite and the precipitation of intermetallics [Citation28]. The zone II exothermic peak at 500–580 °C may be incited by grain growth or reverse transformation from martensite to austenite [Citation29,Citation30], heat treatment at this range will easily cause over aging. The endothermic peak of zone III at 636–706 °C correlates to the martensite to austenite transformation and the formation of retained austenite [Citation28,Citation31]. The exothermic peak of zone IV at 724–832 °C may result from the solution of precipitates or recrystallization [Citation29,Citation32]. Therefore, aging at 490 °C for 6 h was designed, since it is slightly higher than the precipitation finish temperature (485 °C). Solution treatment at 840 °C for 1 h was also determined based on the finish PTTs of zone IV (832 °C). Solution-age treatment (SAT), which integrates 840 °C for 1 h solution and followed by 490 °C for 6 h age treatments was also performed.
Figure 2. DSC trace of the as-fabricated MS by SLM.
The Archimedes density of AF and AT specimens was measured to be 8.05 ± 0.02 g/cm3 and 8.04 ± 0.02g/cm3, respectively, which is comparable to the traditionally produced methods with a reported density of 8.0–8.1 g/cm3 [Citation33,Citation34]. It implies an almost fully dense MS was achieved. The pores in the AF specimen were formed due to the inevitable entrapment of protective nitrogen gas into the melt pool during SLM process. The rolled gas in the pores could swell due to the thermal expansion effect during the heat treatment, resulting in micropore growth and a slight densification decrease.
3.3. Microstructure analysis
3.3.1. SEM observation
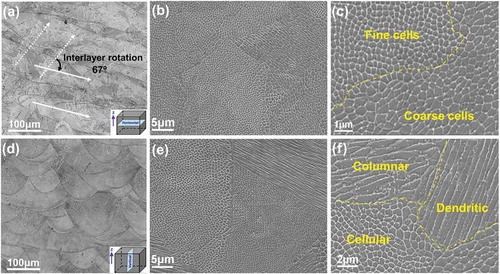
shows representative microstructures taken from the horizontal and vertical cross-sections of the as-fabricated specimen. The OM image of a horizontal cross-section in ), displays the laser motion tracks, with a 67° rotation between contiguous layers. By contrast, the OM image of the vertical cross-section ()) clearly shows the melt pools profile. Submicron-sized fine cellular microstructures with size of approx. 0.2–0.6 μm were observed in the horizontal cross-section ()), which can improve the hardness and strength of SLM steels in comparison to conventionally manufactured steels [Citation7,Citation11]. These fine cellular structures are typical microstructures of SLM process, due to constitutional supercooling together with a high velocity of the solidification. The same cellular structure was also found in SLM CoCr-Mo, Al-Si alloys [Citation35]. Two distinct regions with one significantly coarser than the other can be observed in ). It indicates that these two regions have different thermal histories and different cooling rates during solidification. Generally, the coarse structure region would be the laser overlapped zone or heat affected zone with relative low cooling rate. As observed from the vertical cross-section ()), the elongated cells and acicular structures are prevalent in addition to cellular structures. The variation of structural morphology is determined by both the temperature gradient (G) and growth rate (R), since the G and R vary in different zones of a melt pool.
Figure 3. Representative OM and SEM images taken from the horizontal (a)–(c) and vertical (d)–(f) cross-sections of the AF specimen.
3.3.2. EBSD analysis
shows EBSD analysis of the vertical cross-sections taken from the as-fabricated specimen. The color inverse pole figure (IPF) in ) reveals random orientation of the grains, which is also demonstrated by the corresponding pole figures (PF) without specific textures in ). During the metal solidification process, grains tend to grow in the direction perpendicular to melt pool boundary because this is the direction of the maximum temperature gradient and hence maximum heat extraction and highest degree of undercooling. The columnar dendrites or cells within each grain tend to grow in the easy-growth direction, and the 〈100〉 crystallographic orientation is the preferable crystallization direction for alloys with cubic crystal system [Citation36]. However, no texture present in this study. The absence of texture along building direction is possibly caused by the 67° rotations among layers, which results in altering of heat flux direction [Citation20]. Non-textured structures in building direction were also found in SLM MS with 90° rotation between adjacent layers [Citation34]. The grain size distribution counted from ) is exhibited in ), the average grain size is 0.31 μm, which agrees well with the observed SEM microstructures in .
Figure 4. EBSD analysis of the vertical cross-sections taken from the as-fabricated specimen: (a) color inverse pole figure (IPF) showing grain orientation distributions and (b) corresponding pole figure (PF), (c) grain size distribution, (d) high-magnification IPF and (e) grain boundary map.
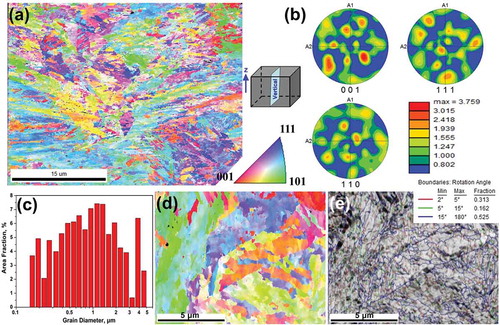
High-magnification IPF provided in ) shows the lath martensite structures, and grain boundary map in ) indicates that the fractions of low-angle grain boundaries (LAGBs) and high-angle grain boundaries (HAGBs) are 47.5% and 52.5%, respectively. HAGBs are mainly present at the boundaries between lath martensite structures, and the LAGBs are more likely formed inside the martensite structures.
3.3.3. TEM analysis
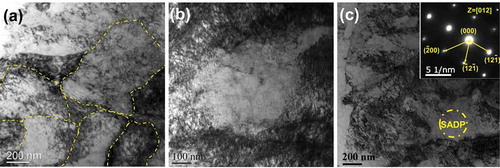
Further detailed microstructural observations of AF specimen by TEM have been carried out and given in . Typical bright field (BF) TEM image taken the horizontal cross-section is exhibited in ), showing cellular structures. A zoom-in BF-TEM image of ), is provided in ), the dark contrast at the cell boundary is considered to be caused by a very high dislocation density. Because the relatively soft (30 HRC) and ductile low-carbon lath martensite in MS normally contains a high dislocation density in the order of 1011−12/cm2 [Citation23]. As shown in ), the vertical cross-sectional BF-TEM image reveals an acicular martensitic structure, which is determined by the corresponding selected area electron diffraction (SAED) pattern generated from the [012] zone axis.
Figure 5. TEM images of AF specimen: (a) BF-TEM image taken from the horizontal cross-section showing cellular structures, (b) zoom-in image of (a) showing high-density dislocations, and (c) BF-TEM image with corresponding SAED taken from the vertical cross-section exhibiting acicular martensites.
3.4. Precipitate characteristic
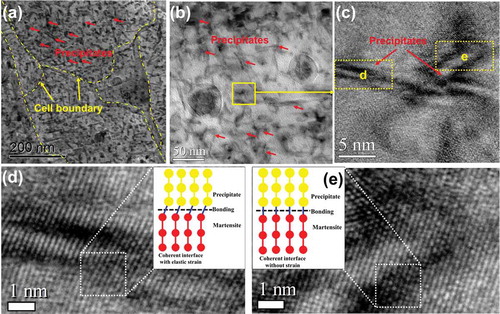
TEM analysis of age-treated specimen is given in for intensive investigation of precipitate characteristics and strengthening mechanism. ) shows a BF-TEM overview of massive precipitates homogeneously distributed in the cellular structure, and the cell boundaries can be still observed. The megascopic BF-TEM image of ) is provided in ), the needle-shaped nanoprecipitates with a size of about 6–10 nm in diameter and 15–50 nm in length, are clearly exhibited in the bright matrix. Our previous study confirmed that the nanoprecipitates are Ni3X (X = Ti, Al, Mo) and the bright matrix is an almost full amorphous structure [Citation10]. The stresses present in the parent matrix as the precipitate grows, strongly influences the shape of the precipitate. Growth as discs or needle is clearly preferred since it can minimize the strain in the matrix. and are HRTEM images revealing the interface between precipitates and matrix. ) depicts a coherent interface with elastic strain, while ) describes a fully coherent interface without strain. In general, the interfacial free energy will be minimized with better matching of the two phases. Incoherent interfaces have high energy and are relatively mobile because of the greater freedom of atomic motion.
Figure 6. TEM analysis of precipitate characteristics in age-treated specimen: (a) BF-TEM overview showing massive nanoprecipitates embedded in amorphous matrix, (b) zoom-in BF-TEM image of (a) showing precipitate morphology, (c) zoom-in image taken from the given region of (b), (d) high-resolution TEM (HRTEM) image showing the coherent interface with elastic strain; and (e) HRTEM image showing the complete coherent interface.
3.5. Residual stress
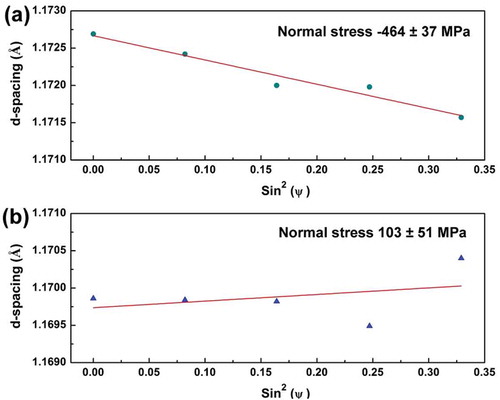
It has been proved that the residual stress in SLM-produced specimen reaches the highest value on the top surface [Citation37]. So residual stress in the top surfaces of AF and AT specimens was determined by the XRD sin2ψ method, and the results are shown in . A significant compressive residual stress of 464 MPa exists in the AF specimen, which generates from the high-rate cooling of melt pools during the SLM process. Usually, the residual stresses are arising from two mechanisms: thermal gradient mechanism (TGM) and the cool-down phase of molten top layers [Citation37]. For the top surface, no cooling and shrinkage of the molten upper layer induced stress, so the cracks were caused by TGM. TGM results from the large thermal gradients that occur around the laser spot and causes laser bending of sheets along straight lines. The rapid heating of the top surface along with the relatively slow heat conduction of the material develops a steep temperature gradient. When the heated top layer expands, it is restricted by the underlying material, imposing elastic compressive strains. The laser scan pattern with 67° rotations among layers, may also contribute to the formation of compressive stress, since the shrinkage and bending during the cooling process could be counteracted and suppressed with laser heat flux rotating. As expected, the heat treatment can significantly reduce residual stress, since the residual stress in AT specimen is only 103 MPa. The altering of stress type, that is, from compressive type in AF specimen to tensile type in AT specimen, is likely to be induced by massive precipitates squeezing into the martensite matrix.
Figure 7. Residual stress measured from the horizontal surface of (a) AF and (b) AT specimens.
3.6. Mechanical performance analysis
3.6.1 Hardness and tensile properties
The tensile properties and hardness features of the AF and heat-treated SLM specimens along the horizontal and vertical directions are summarized in . For the horizontal specimens, the ultimate tensile strength (UTS) increases from 1165 MPa to 2014 MPa after aging, which is at the cost of reducing the elongation at break (El) from 12.4% to 3.3%. Meanwhile, age treatment leads to an improvement of hardness, from about 35 HRC to 55 HRC. Notably, solutions treatment increases the El from 12.4% to 14.4%, since a fully martensitic structure was obtained after solution treatment, which is soft (28–30 HRC) and deformable [Citation10]. Owing to the high nickel content and almost free of carbon, martensite in MS is an iron-nickel martensite, that is, a solid solution of nickel in α-Fe. Therefore, a solution and subsequent age dual heat treatment method was adopted for improving both strength and ductility. As expected, the tensile properties (UTS = 1943 MPa, YS = 1882 MPa and El = 5.6%, where YS stands for yield strength) and the hardness (52–54 HRC) of SAT specimens meet the wrought requirements. Compared with the horizontal specimens, the hardness and tensile properties of vertically fabricated specimens are overall just slightly lower. But no obvious build orientation based anisotropy of mechanical properties was observed in AF specimens or heat-treated specimens.
Table 1. Comparison of the mechanical properties for grade 300 MS fabricated by SLM and conventional wrought method.
3.6.2 Charpy impact behavior
When a material experiences a sudden and intense impact, it may behave in a much more brittle manner than is observed in the tensile test. We measure the energy needed to fracture a material and evaluate the brittleness as well as impact toughness of a material under high strain rates in an impact test. The impact energies and fracture morphologies of AF and heat-treated SLM specimens with both horizontal and vertical building orientations are provided in . As observed in ), the impact energies of heat-treated specimens (12.32–15.38 J) are much lower than AF specimens. Because, the heat treatments increased the brittleness, less energy was needed to cause a complete rupture. Besides, one can note that SAT specimens (14.68–15.38 J) present slightly higher impact energies compared with aged specimens (12.32–13.85 J), so SAT specimen obtained a superior impact toughness in these two kinds of heat treatments. This feature is consistent with the tensile performance that solution-aged specimens achieved superior tensile toughness in comparison with single aged specimens. Fracture morphologies are compared in ), evident lateral expansion and ductile fractures appear in AF specimens, which indicate high impact toughness. In contrast, the plain fracture surfaces almost without any plastic deformation present in the heat-treated specimens, indicating a significant increase in brittleness.
Figure 8. Impact energies (a) and fracture morphologies (b) of as-fabricated and heat-treated MS specimens with horizontal and vertical building directions.
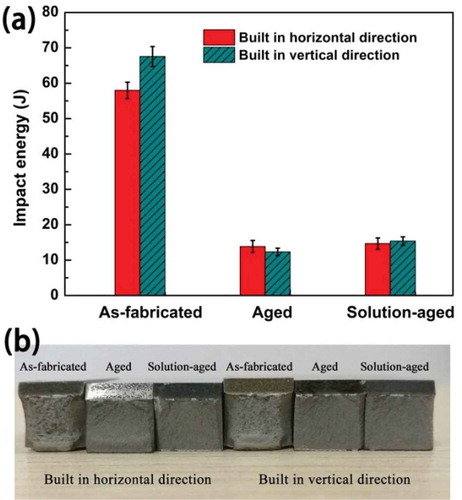
The impact energies of AF specimens vary from building orientations, in which specimens built in vertical direction present higher impact energy (67.55 J) than that of horizontally built specimens (57.97 J). This kind of fabrication orientation based anisotropy is mainly caused by the layer-wise building method and can be named as ‘layer-wise effect’. During an impact, impact energy can be partly absorbed by plastic deformation via interlayer shear slips, for slips are susceptible to develop at the interfaces of the stacking layers, which may act as macroscopical slip bands. Therefore, more energy is needed to cause a fracture in AF specimen with vertical building direction. However, the layer-wise effect can be reduced or removed by appropriate heat treatment, so the anisotropy of impact energy is alleviative and inconspicuous in heat-treated specimens. It is worth mentioning that, Bai et al. [Citation22] and Kempen et al. [Citation38] reported that the impact energy of SLM produced 18Ni300 were only about 24 J and 43 J for the as-fabricated condition, respectively, and both of them obtained about 5 J for the aged specimens.
3.7. Tribological performance analysis
Friction coefficients and wear track profiles of MS specimens are exhibited in with relative tribological performance listed in . The average friction coefficients of the AF, AT and SAT specimens, as observed in ), are 0.62, 0.56 and 0.58, respectively. The coefficient of AF specimen is higher than that of heat-treated specimens and is rather unstable in the primary stage of sliding. The 3D morphology (as illustrated in )) depicts the wear track after sliding, and the precise sectional line profiles are carried out to calculate the depth, width and area (A) of the wear track ()). The wear rate coefficient (Kc) was calculated by using the following formula [Citation39]:
Table 2. Tribological properties of SLM fabricated MS specimens.
Figure 9. Friction coefficient (a), 3D wear track morphology (b), and sectional line profiles of wear track of SLM specimens.
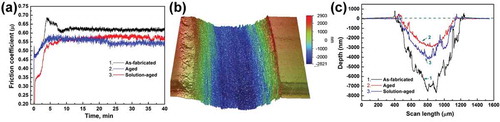
where A is the cross-section area of the wear track in mm2 and R is the radius of the wear track in mm, F is the normal load in N and S is the total sliding distance covered in m. The wear volume (V) is approximately equal to 2πR∙A. As summarized in , the depth, width and area of wear track for the heat-treated specimens, especially for the AT specimen, are much smaller than that of the AF specimen, and the wear rate Kc of heat-treated specimens (1.91 × 10⁻⁸–2.53 × 10⁻⁸ mm3/Nm) decreased about 40%–60% in comparison to the AF specimens (4.43 × 10⁻⁸ mm3/Nm). So the wear resistance increased to about two times by heat treatment. The AT specimen exhibits a slightly better tribological performance than SAT one regarding friction coefficient and wear rate.
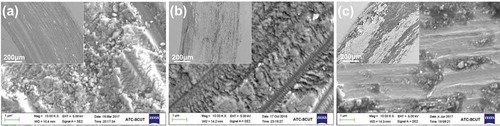
SEM morphologies of worn tracks are illustrated in to investigate the wear mechanism. As observed from the insert full-scale images of wear track, the wear track of AF specimen is relatively deeper and wider than that of heat-treated specimens. The worn morphologies of the AF specimen ()) are characterized with a large amount of granular wear debris, indicating heavy plastic deformation and serious surface destruction after the wear test. So the AF specimen may experience an adhesive wear mechanism. There are some grievous ploughed grooves along with some delamination lamellas in the AT specimens in ), indicating a characteristic of the abrasive wear mechanism. The aforementioned variation of wear characteristics can be explained as follows: due to insufficient strength in the AF specimen, the high contact stress caused serious plastic deformation and formed adhesive points, when the adhesive points were torn off, debris was produced and gradually accumulated. For the AT specimens, on one hand, improved strength caused by nanoprecipitates strengthening mechanism can decrease the plastic deformation and the tendency of adhesive wear; on the other hand, the intermetallics phases could act as the supporting part during the wear process. The small delamination lamella without significant delamination layers or wear debris in AT specimen is due to the increased hardness. Similar worn morphology could also be observed in SLM Al-12Si, since oxidative wear mechanism is prevailing which generated harder oxides as supporting particles during wear [Citation40]. As for the SAT specimen, it integrated high strength and novel toughness, its wear micrograph in ) exhibits shallow grooves and debris clusters, which could be taken as a mixed abrasive and adhesive wear mode.
Figure 10. SEM micrographs of as-fabricated and heat-treated MS specimens after wear tests.
3.8. Corrosion resistance analysis
shows the potentiodynamic anode polarization curves and corrosion properties of MS specimens. Corrosion potential (Ecorr) and corrosion current density (Icorr) are used to compare the corrosion behaviors of MS in different conditions. The as-fabricated specimens have a low corrosion potential of −478.1 mV vs. saturated calomel electrode (SCE), since the high nickel content and absence of carbides favor a good corrosion resistance. The specimens show a nobler corrosion potential of −427.2 ~ −403.0 mVSCE after heat treatments. The possible reason for the increased Ecorr could be that the precipitates have a higher corrosion potential than that of the Fe matrix, so the whole potentials of heat-treated specimens were improved. Meanwhile, the corrosion current density (Icorr) of the heat-treated specimens (9.36 ~ 34.0 μA/cm2) shows no significant distinction compared with the AF specimen (10.4 μA/cm2).
Figure 11. Potentiodynamic polarization curves and summarized relative corrosion properties of as-fabricated and heat-treated MS specimens.
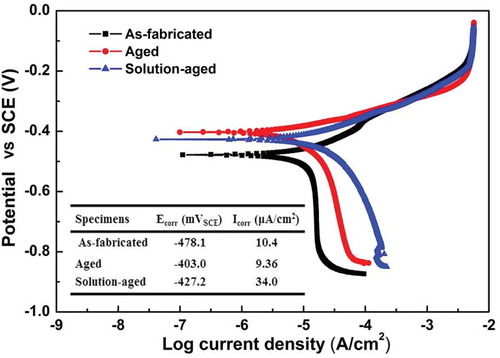
MS is prone to general corrosion mainly due to the martensitic matrix with intermetallic precipitates, such as Ni3(Ti, Al, Mo). Because the galvanic coupling forms between the precipitates and the matrix, in which the α-Fe with low potential acts as the anode and the precipitates act as the cathode. So the micro-galvanic corrosion increased the dissolution rate of the matrix in the 3.5% NaCl solution. Besides, the interface between the reverted austenite and the martensite is an area in which the nucleation of corrosion pits occurs, so the Icorr of the SAT specimens slightly decreased. Interestingly, the Icorr of the AT specimens is marginally higher than that of AF specimen, since massive amorphous phase sharply alleviated the grain boundary corrosion of Fe matrix and decreased the corrosion rate. However, solution treatment at 840 °C caused crystallization of amorphous phase, so the suppressed Icorr by amorphous phase disappeared in SAT specimens.
4. Discussion
4.1. Microstructure
As has been widely accepted, G (K/m) and R (m/s) play important roles in morphology and size of the structure during the solidification. The ratio of G/R determines the mode of solidification (planar, columnar, or equiaxed dendrites), while the product of G × R indicates the cooling rate (K/s) that controls the size of the solidification structures [Citation36]. For the same cellular morphology in ), the ratios of G/R are similar, while the G × R value of the coarse grains is much smaller than that of the fine grains. Therefore, both the G and R in coarse regions are small, and the small R means reduced under cooling rate, so that this region can be the laser heat affected region or the laser overlapped region. Besides, owing to the high cooling rate of the molten pool, the primary cellular spacing (λ) is only about 0.2 μm for fine regions and 0.6 μm for coarse regions, so the cooling rate (CR
) can be estimated as 7.67 × 10⁷ K/s – 2.75 × 10⁶ K/s, according to the equation [Citation41]. During the solidification of an alloy, a planar growth occurs when G is very high or/and R is extremely low value. As R increases, the solidification morphology can shift to cellular, columnar, and then dendritic [Citation36,Citation42]. So the different growth rates caused the formation of dissimilar structure morphologies in ), including cellular, columnar, and dendritic structures.
Generally speaking, LAGBs are composed of an array of dislocations. HAGBs are considerably more disordered, with large misfit areas and high density of dislocations in comparison to LAGBs. So the high content of HAGBs in AF specimen may be incited by the relatively large residual stress (464 MPa), as revealed in Section 3.5, and related to high dislocation density in lath martensites as exhibited in . It has been proved that the friction of HAGBs was decreased after age heat treatment, which is possibly due to the movement of dislocations is impeded by massive and small precipitates [Citation24]. The other reason is that the residual stress was relieved after heat treatment (only 103 MPa), so the deformation caused dislocations was reduced.
4.2. Precipitation hardening mechanism
There are two main mechanisms for precipitation hardening, that is, dislocation cutting through particles and dislocations bowing around particles, which depend on the precipitate size. When the precipitate size is larger than the critical radius rcritical (normally about 15b, Burgers vector b = 0.249 nm), the hardening mechanism follows Orowan bowing mechanism [Citation43]. In our work, the homogeneously distributed needle-shaped nanoprecipitates in ) are about 8 nm in diameter and 30 nm in length, it can be simplified as a sphere in an equivalent volume of 14 nm in diameter. So the main hardening mechanism is Orowan bowing. The interspace of precipitate (λ) is observed as about 25 nm. So the yield strength of 2142 MPa for aging hardened specimen can be theoretically calculated by following Orowan relationship, the equation was elucidated in previous work [Citation10]. The calculated result is in reasonable agreement with the measured value (1967 MPa). The amorphous matrix in ) is exclusive to high cooling rate SLM process, which enables us to quantify the precipitates exactly, and verifies the precipitation hardening hypotheses in calculable way.
Coherency strain hardening is another contribution to the strengthening of age treatment. Coherent precipitates were observed in ). The very small grain size (about 0.31μm), high content of HAGBs (52.5%), together with a great number of crystalline defects (high dislocation density, shown in )) promoted the nucleation of the coherent precipitates [Citation32,Citation44]. Coherency hardening originates from atomic volume difference between precipitate and the matrix, which results in a coherency strain. Because the crystallographic parameters of precipitates, such as hexagonal η-Ni3Ti (a = 5.101 Å, c = 8.306 Å), cubic Ni3Al (a = 3.572 Å) and orthorhombic Ni3Mo (a = 5.064 Å, b = 4.224 Å and c = 4.448 Å), are different with the cubic α-Fe (a = 2.866 Å) martensitic matrix. For small particles, coherency strain hardening increases with increasing particle size, whereas for larger articles, the coherency strain hardening decreases with increasing particle size, when the particle size reaches 15 nm, the strength increment is less than 100 MPa [Citation43]. Strengthening from elastic coherency strains is limited; therefore, the main hardening mechanism in SLM MS is precipitated-phase strengthening.
4.3. Anisotropy in mechanical behavior
Due to the layer-wise manner building of SLM, parts build-up in different directions (vertical and horizontal) are likely present anisotropies in mechanical properties, such as SLM 316L [Citation45] and SLM IN738LC alloy [Citation46] exhibited pronounced anisotropy in both microstructures and mechanical property. Interestingly, the anisotropy of the mechanical behavior, including hardness and tensile properties, in this SLM-produced MS are detectable but not noticeable. Reasons accounting for the faint anisotropy in SLM MS include: (i) the absence of remarkable texture along building direction, due to the altering of heat flux direction caused by the 67° rotations of laser scan among layers; (ii) strong intra-layer and interlayer bonding were fulfilled by optimum laser parameter, which weakens layer-wise effect. Slight anisotropy in Charpy impact behavior of AF specimen was reduced by heat treatment, since the residual stress was released during heat treatment, and the massive homogeneous precipitates may also account for the alleviation of layer-wise effect and promotion of isotropic microstructure and property.
5. Conclusions
High-performance grade 300 MS was fabricated by selective laser melting using optimized laser parameters. The microstructure and properties of as-fabricated and heat-treated specimens were systematically investigated and discussed. Conclusions are summarized as follows.
The almost fully dense (99.9%) MS was prepared by using an optimum laser energy density of 67 J/mm3. DSC traced the phase transformation temperatures of the AF specimen, which gave valuable guidance to the heat treatments.
Both SEM and EBSD revealed a submicron grain (average 0.31μm) of AF specimen, predicting an extremely high cooling rate up to 107 K/s. TEM image exhibits a high-density dislocation at the cell boundaries in AF specimens, which was beneficial to precipitation. Massive and homogeneous distributed needle-shaped nanoprecipitates Ni3X (X = Ti, Al, Mo) clearly exhibited in the martensitic matrix in AT specimen, which accounted for the age hardening.
Heat treatments were crucial to improving the properties of SLM-produced MS. The residual stress significantly decreased from 464 MPa to 103 MPa after age treatment, the hardness, tensile strength and tribological performance were also remarkably improved. The building orientation based anisotropy of the mechanical behaviors in this SLM-produced MS, including hardness, tensile properties and Charpy impact behavior, were detected but not obvious. Heat treatment had effect on eliminating the mechanical anisotropy.
Disclosure statement
No potential conflict of interest was reported by the authors.
Additional information
Funding
References
- Vasudevan VK , Kim SJ , Wayman CM. Precipitation reactions and strengthening behavior in 18 Wt Pct nickel maraging steels. Metallurgical Trans A. 1990;21:2655–2668.
- Kürnsteiner P , Wilms MB , Weisheit A , et al. Massive nanoprecipitation in an Fe-19Ni-x Al maraging steel triggered by the intrinsic heat treatment during laser metal deposition. Acta Mater. 2017;129:52–60.
- A.I.H. Committee . Properties and selection: irons steels and high performance alloys. In: ASM handbook. USA: Materials Information Company; 1991. p. 1872–1873.
- Hermann Becker T , Dimitrov D. The achievable mechanical properties of SLM produced Maraging Steel 300 components. Rapid Prototyping J. 2016;22:487–494.
- Olakanmi EO , Cochrane RF , Dalgarno KW . A review on selective laser sintering/melting (SLS/SLM) of aluminium alloy powders: processing, microstructure, and properties. Prog Mater Sci. 2015;74:401–477.
- Lang F , Kenyon N . Welding of maraging steels. Welding Research Council; 1971.
- Jägle E , Sheng Z , Kürnsteiner P , et al. Comparison of Maraging Steel Micro- and Nanostructure Produced Conventionally and by Laser Additive Manufacturing. Materials. 2016;10:8.
- Xu Z , Zhang Y . Quench rates in air, water, and liquid nitrogen, and inference of temperature in volcanic eruption columns. Earth Planet Sci Lett. 2002;200:315–330.
- Jägle EA , Choi P-P , Van Humbeeck J , et al. Precipitation and austenite reversion behavior of a maraging steel produced by selective laser melting. J Mater Res. 2014;29:2072–2079.
- Tan C , Zhou K , Ma W , et al. Microstructural evolution, nanoprecipitation behavior and mechanical properties of selective laser melted high-performance grade 300 maraging steel. Mater Des. 2017;134:23–34.
- Herzog D , Seyda V , Wycisk E , et al. Additive manufacturing of metals. Acta Mater. 2016;117:371–392.
- Scudino S , Unterdörfer C , Prashanth K , et al. Additive manufacturing of Cu–10Sn bronze. Mater Lett. 2015;156:202–204.
- Tan C , Zhou K , Ma W , et al. Selective laser melting of high-performance pure tungsten: parameter design, densification behavior and mechanical properties. Sci Technol Adv Mater. 2018;19:370-380.
- Tan C , Zhou K , Ma W , et al. Interfacial characteristic and mechanical performance of maraging steel-copper functional bimetal produced by selective laser melting based hybrid manufacture. Mater Des. 2018;155:77–85.
- Al-Saedi DSJ , Masood SH , Faizan-Ur-Rab M , et al. Mechanical properties and energy absorption capability of functionally graded F2BCC lattice fabricated by SLM. Mater Des. 2018;144:32–44.
- Liu C , Cai Z , Dai Y , et al. Experimental comparison of the flow rate and cooling performance of internal cooling channels fabricated via selective laser melting and conventional drilling process. Int J Adv Manufact Technol. 2018;96:2757–2767.
- Bai Y , Yang Y , Xiao Z , et al. Selective laser melting of maraging steel: mechanical properties development and its application in mold. Rapid Prototyping J. 2018;24:623–629.
- Cyr E , Asgari H , Shamsdini S , et al. Fracture behaviour of additively manufactured MS1-H13 hybrid hard steels. Mater Lett. 2018;212:174–177.
- Gorsse S , Hutchinson C , Gouné M , et al. Additive manufacturing of metals: a brief review of the characteristic microstructures and properties of steels, Ti-6Al-4V and high-entropy alloys. Sci Technol Adv Mater. 2017;18:584–610.
- Carter LN , Martin C , Withers PJ , et al. The influence of the laser scan strategy on grain structure and cracking behaviour in SLM powder-bed fabricated nickel superalloy. J Alloys Compd. 2014;615:338–347.
- Prashanth K , Scudino S , Eckert J . Defining the tensile properties of Al-12Si parts produced by selective laser melting. Acta Mater. 2017;126:25–35.
- Bai Y , Yang Y , Wang D , et al. Influence mechanism of parameters process and mechanical properties evolution mechanism of maraging steel 300 by selective laser melting. Mater Sci Eng A. 2017;703:116–123.
- Casalino G , Campanelli SL , Contuzzi N , et al. Experimental investigation and statistical optimisation of the selective laser melting process of a maraging steel. Opt Laser Technol. 2015;65:151–158.
- Mutua J , Nakata S , Onda T , et al. Optimization of selective laser melting parameters and influence of post heat treatment on microstructure and mechanical properties of maraging steel. Mater Des. 2018;139:486–497.
- Casati R , Lemke J , Tuissi A , et al. Aging behaviour and mechanical performance of 18-Ni 300 steel processed by selective laser melting. Metals. 2016;6:218.
- A.S.T.M. Standard, ASTM E23-12c . Standard test methods for notched bar impact testing of metallic materials. West Conshohocken, PA, USA: ASTM International; 2012.
- Svenungsson J , Choquet I , Kaplan AFH . Laser welding process – a review of keyhole welding modelling. Physics Procedia. 2015;78:182–191.
- Bui N , Dabosi F . Contribution to the study of the effect of molybdenum on the ageing kinetics of maraging steels. Cobalt. 1972;192–201.
- Guo Z , Sha W , Li D . Quantification of phase transformation kinetics of 18 wt.% Ni C250 maraging steel. Mater Sci Eng A. 2004;373:10–20.
- Pereloma EV , Shekhter A , Miller MK , et al. Ageing behaviour of an Fe–20Ni–1.8Mn–1.6Ti–0.59Al (wt%) maraging alloy: clustering, precipitation and hardening. Acta Mater. 2004;52:5589–5602.
- Goldberg A , O’Connor DG . Influence of heating rate on transformations in an 18 per cent nickel maraging steel. Nature. 1967;213:170.
- Menapace C , Lonardelli I , Molinari A . Phase transformation in a nanostructured M300 maraging steel obtained by SPS of mechanically alloyed powders. J Therm Anal Calorim. 2010;101:815–821.
- S.A. 6514H . Steel, maraging, bars, forgings, tubing, and rings 18.5Ni - 9.0Co - 4.9Mo - 0.65Ti - 0.10Al consumable electrode vacuum melted, annealed. USA: SAE International; 2012. p. 8.
- Suryawanshi J , Prashanth KG , Ramamurty U . Tensile, fracture, and fatigue crack growth properties of a 3D printed maraging steel through selective laser melting. J Alloys Compd. 2017;725:355–364.
- Prashanth K , Eckert J . Formation of metastable cellular microstructures in selective laser melted alloys. J Alloys Compd. 2017;707:27–34.
- Kou S . Welding metallurgy. 2nd ed ed. New York: Wiley; 2003.
- Mercelis P , Kruth JP . Residual stresses in selective laser sintering and selective laser melting. Rapid Prototyping J. 2006;12:254–265.
- Kempen K , Yasa E , Thijs L , et al. Microstructure and mechanical properties of selective laser melted 18Ni-300 steel. Physics Procedia. 2011;12:255–263.
- Tan C , Kuang T , Zhou K , et al. Fabrication and characterization of in-situ duplex plasma-treated nanocrystalline Ti/AlTiN coatings. Ceramics Int. 2016;42:10793–10800.
- Prashanth K , Debalina B , Wang Z , et al. Tribological and corrosion properties of Al-12Si produced by selective laser melting. J Mater Res. 2014;29:2044–2054.
- Schubert T , Löser W , Schinnerling S , et al. Alternative phase formation in thin strip casting of stainless steels. Mater Sci Tech-Lond. 2013;11:181–185.
- Lee Y , Nordin M , Babu SS , et al. Effect of fluid convection on dendrite arm spacing in laser deposition. Metallurgical Mater Trans B. 2014;45:1520–1529.
- Gladman T . Precipitation hardening in metals. Mater Sci Tech-Lond. 1999;15:30–36.
- He Y , Yang K , Liu K , et al. Age hardening and mechanical properties of a 2400 MPa grade cobalt-free maraging steel. Metallurgical Mater Trans. 2006;37:1107–1116.
- Niendorf T , Leuders S , Riemer A , et al. Highly Anisotropic Steel Processed by Selective Laser Melting. Metallurgical Mater Trans B. 2013;44:794–796.
- Kunze K , Etter T , Grässlin J , et al. Texture, anisotropy in microstructure and mechanical properties of IN738LC alloy processed by selective laser melting (SLM). Mater Sci Eng A. 2015;620:213–222.