
 ?Mathematical formulae have been encoded as MathML and are displayed in this HTML version using MathJax in order to improve their display. Uncheck the box to turn MathJax off. This feature requires Javascript. Click on a formula to zoom.
ABSTRACT
We systematically investigated trilanthanide gallates (Ln3GaO6) with the space group Cmc21 as oxygen-ion conductors using first-principles calculations. Six Ln3GaO6 (Ln = Nd, Gd, Tb, Ho, Dy, or Er) are both energetically and dynamically stable among 15 Ln3GaO6 compounds, which is consistent with previous experimental studies reporting successful syntheses of single phases. La3GaO6 and Lu3GaO6 may be metastable despite a slightly higher energy than those of competing reference states, as phonon calculations predict them to be dynamically stable. The formation and the migration barrier energies of an oxygen vacancy (VO) suggest that eight Ln3GaO6 (Ln = La, Nd, Gd, Tb, Ho, Dy, Er, or Lu) can act as oxygen-ion conductors based on VO. Ga plays a role of decreasing the distances between the oxygen sites of Ln3GaO6 compared with those of Ln2O3 so that a VO migrates easier with a reduced migration barrier energy. Larger oxygen-ion diffusivities and lower migration barrier energies of VO for the eight Ln3GaO6 are obtained for smaller atomic numbers of Ln having larger radii of Ln3+. Their oxygen-ion conductivities at 1000 K are predicted to have a similar order of magnitude to that of yttria-stabilized zirconia.
Graphical abstract
1. Introduction
Oxygen-ion conductors with high oxygen-ion conductivities (σO) have been developed for important applications [Citation1,Citation2], such as electrolytes of solid oxide fuel cells (SOFC), oxygen separation membranes, and gas sensors. Currently, yttria-stabilized zirconia (YSZ) is widely used because of its advantages, such as abundance, chemical stability, non-toxicity, and low cost. This material is known to exhibit a σO of ~10−2 S/cm at a high temperature of 1000 K [Citation2,Citation3]. For useful industrial applications, it is necessary to be further improved to have similar σO values at lower temperatures or a higher σO at a similar temperature. Indeed, there are several oxides such as Gd-doped CeO2 (GDC) [Citation4] and pure or Er-doped δ-phase of Bi2O3 [Citation5,Citation6], which have been reported to have higher σO at the same temperature than YSZ. However, there have been great efforts for the development of new oxygen-ion conductors that can substitute for YSZ with enough merits in practice.
Lanthanide gallates (Ln–Ga–O) have also been investigated as oxygen ionic conductors. Actually, Sr- and Mg-doped LaGaO3 (LSGM) [Citation7–Citation11] with a perovskite structure have been widely developed as an electrolyte for intermediate temperature (~500–750 °C) [Citation12] SOFCs because their σO is higher than that of YSZ at this temperature. In addition, trilanthanide gallates in another composition ratio (Ln3GaO6) have also been introduced as oxygen-ion conductors. Purohit et al. [Citation13] reported that pure and Sr- or Ca-doped Nd3GaO6 achieved a σO of 2.7 × 10⁻⁴ and 0.7 × 10⁻² S/cm at 800 °C, respectively. Iakovleva et al. [Citation14] reported that a Sr-doped Gd3GaO6 achieved a total conductivity of 0.9 × 10⁻² S/cm (with σO of 0.3 × 10⁻² S/cm and the remaining conductivity likely originating from protons) at 800 °C. Their σO values are not significantly different from that of YSZ at ~1000 K. Some Ln3GaO6 (Ln = Nd, Sm, Eu, Gd, Tb, Dy, Ho, or Er) were synthesized as a single phase with the space group Cmc21 [Citation15–Citation17]. The abovementioned experimental reports suggest that other Ln3GaO6 compounds may show similar (or higher) σO values.
In contrast to experimental reports on Ln3GaO6, first-principles calculations on these ternary oxides are very rare. However, for binary lanthanide sesquioxides (Ln2O3) [Citation18–Citation21], the locations of the f-levels inside the O 2p–Ln 5d band gap (Eg) have been predicted using first-principles calculations (see Section 3.2). Whether the localized f-levels exist inside or outside of Eg(O 2p–Ln 5d) depending on the type of Ln (number of f-electrons) changes the characteristics of the highest occupied molecular orbital (HOMO) and the lowest unoccupied molecular orbital (LUMO), and the Eg value. Therefore, it is useful to investigate the electronic structures of Ln3GaO6 by the first-principles calculations.
In this study, we used the systematic first-principles calculations to determine the structural and energetic properties based on the crystal and electronic structures of Ln3GaO6 with all types of Ln. We classified the type of Ln3GaO6 according to the location of f-levels in the band gap. Then, for the Ln3GaO6 type, whose electronic structures are less affected by the f-levels, we further investigated the energetic and dynamical stabilities, and the properties related to σO, namely, the formation energy (Ev) and migration barrier energy (Em) of the oxygen vacancy (VO). Finally, we compared the computed oxygen-ion diffusivity (DO) among the Ln3GaO6 types including the VO by the first-principles molecular dynamics (FPMD) and predicted their σO values.
2. Methodology
2.1. Crystal structure
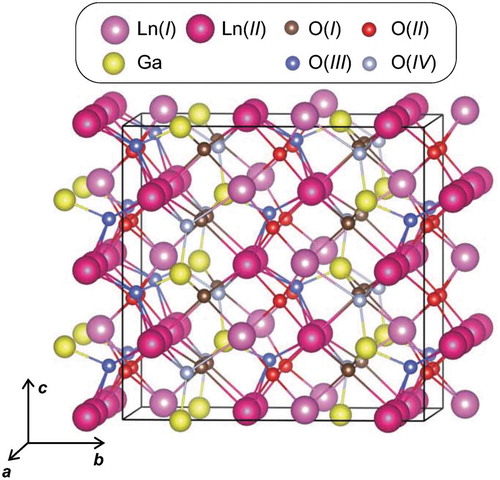
shows the crystal structure of Ln3GaO6 in the orthorhombic crystal system with the space group Cmc21. This crystal structure consists of two, one, and four types of Ln, Ga, and O sites, respectively. The Wyckoff letters with the multiplicity of La(I), La(II), Ga, O(I), O(II), O(III), and O(IV) are 8a, 16b, 8a, 16b, 16b, 8a, and 8a, respectively, when we consider them in the crystal structure shown in . The coordination numbers (CNs) of Ln [both of La(I) and La(II)] and Ga with respect to O are seven and four, respectively. Note that the CN of Ln in the binary Ln2O3 (both of cubic and hexagonal crystal systems) is six. O(I), O(II), O(III), and O(IV) have three, four, four, and three chemical bonds with Ln, respectively. In addition, O(I), O(III), and O(IV) have one chemical bond with Ga, whereas O(II) has no chemical bond with Ga, but only with Ln. In total, we obtain 15 types of Ln3GaO6 (Ln = La, Ce, Pr, Nd, Pm, Sm, Eu, Gd, Tb, Dy, Ho, Er, Tm, Yb, or Lu) in this crystal structure.
Figure 1. Crystal structure of Ln3GaO6 with space group Cmc21. The supercell (1 × 1 × 2 conventional orthorhombic unit cell) with 24 Ln, 8 Ga, and 48 O atoms is shown. Different types of Ln and O sites are presented by different colors.
2.2. First-principles calculations
All first-principles calculations were performed using the project augmented wave (PAW) [Citation22,Citation23] method implemented in the Vienna Ab-initio Simulation Package (VASP) [Citation24,Citation25] within the framework of a generalized gradient approximation (GGA) of Perdew–Burke–Ernzerhof (PBE) form [Citation26]. As the valence electrons, 5p, 5d, and 6s for Ln (5s is also included for La, Ce, Pr, Nd, Pm, and Sm), 3d, 4s, and 4p for Ga, and 2s and 2p for O were considered. In addition, on-site Coulomb interaction [Citation27] with an effective U−J of 5 eV (GGA+U) for the f-orbitals of Ln was partially employed in the calculations. The value of U−J was selected by referring to previous theoretical calculations [Citation19,Citation28–Citation30] on Ln2O3, which suggested an adequate range of the value as 5–7 eV with crosschecks on experimental reports. For the GGA+U method, 4f, 5s, 5p, 5d, and 6s electrons of Ln were also considered as the valence electrons. Henceforth, we refer to the former and latter methods as the GGA/w.o.f (without f-valences but in the frozen core) and GGA+U/w.f methods (with f-valences), respectively.
The structural relaxations of primitive unit cells with the associated changes in lattice constants and atomic coordinates were performed until the interatomic force on each atom was reduced to within 0.005 eV/Å. The cutoff energy was set as 500 eV. Brillouin zone was sampled by using Γ-centered 4 × 4 × 4 meshes. Gaussian smearing for the Brillouin zone integrations was employed with widths of 0.1 eV. Electronic spin polarizations were basically turned on except for the case where the up spin and down spin were confirmed to be compensated by each other.
We also computed Ev and Em because their low values are favorable for achieving a higher σO [Citation31,Citation32]. The Ev values were computed using the supercell method [Citation33] as follows:
where E(Ln3GaO6:VOq) is the energy of a supercell including a VO, E(Ln3GaO6) is the energy of a supercell of pure Ln3GaO6, μO is the chemical potential of O, q is the charge of VO, EHOMO is the eigenvalue of the HOMO level mainly formed by O 2p, EFermi is the Fermi level as a variable, and ΔELZ is the correction term suggested by Lany and Zunger [Citation34,Citation35] to compensate for the image charge interactions between supercells for the charged VO. The calculations for the supercell with a VO were performed until the interatomic forces on each atom were reduced to within 0.02 eV/Å for fixed lattice constants. The sizes of the supercells (80 atoms) were set as 1 × 1 × 2 orthorhombic conventional unit cells as shown in . The Γ-centered 2 × 2 × 2 meshes were used for the k-space sampling. The transformations between primitive and orthorhombic conventional unit cells were performed by SPGLIB implemented in PHONOPY [Citation36,Citation37]. The dielectric constants for the correction term of the image charge interaction were obtained using primitive cells with the density functional perturbation theory (DFPT) [Citation38]. When VO are charged, neutralizing background charges were added.
The phonon calculations of Ln3GaO6 were performed by using PHONOPY [Citation36,Citation37]. To calculate the phonon frequencies, we combined the supercell approach and DFPT [Citation38]. Force constants of the oxides were calculated by applying DFPT at the Γ point to the supercell model (the same size supercell with 80 atoms) of the oxides. Phonon frequencies were then calculated from the force constants. Ln3GaO6 compounds were judged to be dynamically stable if they did not have imaginary phonon frequencies in their phonon densities of states (DOSs).
The Em values were calculated using the climbing image nudged elastic band (CI-NEB) method [Citation39,Citation40] with three intermediate images. The CI-NEB calculations were performed until the forces decreased below 0.03 eV/Å with a spring constant of 5 eV/Å2 between the images. We employed a doubly charged oxygen vacancy (VO2+) for Em assuming that it was formed by the reduction in cation valence upon doping.
2.3. First-principles molecular dynamics
In order to investigate DO, we performed FPMD using the same size supercell as for the computations of Ev and Em including one VO2+. For computational efficiency, the cutoff energy was decreased to 300 eV, only Γ-point was sampled for the Brillouin zone, and the valence electrons were considered as 5p, 5d, and 6s for Ln (5s is also included for La and Nd), 4s and 4p for Ga, and 2s and 2p for O. For O, a soft pseudopotential with a reduced maximum cutoff energy (288 eV) was employed. The GGA/w.o.f method was used without spin polarizations.
The D value of each chemical element at high temperatures can be obtained from the mean square displacement (MSD) after a long simulation time t by the following equation [Citation41,Citation42]:
Here, MSD(t) can be obtained by
where n is the number of atoms of each chemical element, and ri(0) and ri(t) are the positions of the ith atom at the time origin and new time t, respectively. To improve the statistics, the MSD is smoothed by averaging MSD(t, t0) using multiple time origins t0 by EquationEquation (4)(4)
(4) .
The interval of 2 fs for each cycle of atomic movements was used. For the first 1000 cycles, the temperature was elevated from 573 K to the target temperature of 1873 K. Then, FPMD calculations were performed on the basis of Nose thermostat [Citation43,Citation44] with a canonical ensemble for 150,000 cycles taking the average over time from 4 to 300 ps to obtain the MSD with enough movements of O atoms without considering the first 2000 cycles. D is averaged for three trials of FPMD, with different initial positions of VO2+ at O(I), O(II), and O(III) sites.
3. Results and discussion
3.1. Crystal structure
) shows the O–Ln and O–Ga bond lengths of the 15 types of Ln3GaO6 in this study. We separate the two types of O–Ln according to the CN of O. Calculated and experimental values [Citation15], including Ln–O and Ga–O bond lengths, are provided in Supplementary Table S1. Note that when we obtain the mean bond lengths, the O–Ln bond lengths are counted as the distances between O and its three or four neighboring Ln, while the Ln–O bond lengths are counted as the distances between Ln and its seven neighboring O. We only considered the bond lengths among the distances between O and cations within a cutoff radius of 1.3 × the maximum peak obtained from the radial distribution functions (see Supplementary Figure S1). Our computational results obtained by both the GGA+U/w.f and GGA/w.o.f methods are consistent with the experimental reports. The computed bond lengths are slightly longer than the experimental bond lengths with an error of 3.5%. The differences of the bond lengths between the GGA+U/w.f and GGA/w.o.f methods are very small.
Figure 2. (a) Mean bond lengths of 15 Ln3GaO6 and (b) volume (eV/atom, left vertical axis) of 15 Ln3GaO6 and Ln2O3, and Ln3+ radius (right vertical axis). The experimental values of volume and the radius of Ln3+ are from Refs. [Citation15] and [Citation45], respectively.
![Figure 2. (a) Mean bond lengths of 15 Ln3GaO6 and (b) volume (eV/atom, left vertical axis) of 15 Ln3GaO6 and Ln2O3, and Ln3+ radius (right vertical axis). The experimental values of volume and the radius of Ln3+ are from Refs. [Citation15] and [Citation45], respectively.](/cms/asset/8defb199-6dba-4143-a9a7-7e1d3ccf497f/tsta_a_1578183_f0002_oc.jpg)
In general, the Ln–O bond lengths decrease with increasing atomic numbers of Ln. For the GGA+U/w.f method, the O–La (CN of O = 4) and O–La (CN of O = 5) bond lengths are longer than O–Lu (CN of O = 4) and O–Lu (CN of O = 5) bond lengths by 0.26 and 0.29 Å, respectively. However, the O–Ga bond lengths show a little variation with the atomic number of Ln. The O–Ga bond lengths of La3GaO6 and Lu3GaO6 differ from each other only by 0.02 Å.
) shows the volumes of Ln3GaO6 and the radii of Ln3+ (rLn3+). The calculated and experimental values [Citation15] of volumes and lattice constants are mutually consistent, as shown in Supplementary Table S2.
As with the O–Ln bond lengths, in general, the volumes of Ln3GaO6 decrease with increasing atomic numbers of Ln. In addition, these values have a strong correlation with rLn3+. Considering that the O–Ga bond lengths change little among Ln3GaO6, these results suggest that the size of Ln3GaO6 depends on rLn3+.
In addition, we also compare the volumes of Ln3GaO6 and binary Ln2O3 (space group Ia-3 in the cubic crystal system) to determine the volume difference due to the existence of Ga as shown in ). As with Ln3GaO6, the decreasing tendency of the volume of Ln2O3 with increasing atomic number of Ln is found, which is consistent with a previous study by Petit et al. [Citation18]. The volumes per atom of Ln3GaO6 are smaller than those of Ln2O3 by 9–15%. This may be ascribed to the considerably smaller ionic radius of Ga3+ (0.62 Å) than those of Ln3+ (0.86–1.03 Å) [Citation45].
3.2. Electronic structure and location of f-levels
Before proceeding to our computational results of Ln3GaO6, it is worth reviewing previous studies on the locations of localized f-levels inside or outside of the Eg of Ln2O3. Without f-levels, HOMO and LUMO are mainly generated by O 2p and Ln 5d orbitals, respectively. However, because the localized f-levels locate inside Eg(O 2p–Ln 5d), the Eg values and the characteristics of orbitals forming HOMO and LUMO strongly depend on Ln and its f-orbital filling. To correct the location of f-levels, Jiang et al. [Citation19,Citation20] employed GW-level calculations based on the wavefunctions of the LDA+U method and obtained similar Eg values to experimental values. Gillen et al. [Citation21] used hybrid functionals, namely, HSE03 and HSE06, and screened exchange local-density-approximations (sx-LDA). Altman et al. [Citation46] observed the dependence of the location of f-levels on the type of Ln by X-ray absorption spectroscopy. These studies show a common trend: La2O3, Gd2O3, and Lu2O3, which have the earliest, the middle, and the last f-numbers of Ln, respectively, have less dependence on Eg(O 2p–Ln 5d) for the f-levels because their f-levels are relatively far from the O 2p-HOMO and Ln 5d-LUMO. Ce2O3 and Tb2O3, which have one larger f-number of Ln than La2O3 and Gd2O3, respectively, have occupied f-levels that are located much higher than those of La2O3 and Gd2O3. Then, from Ce2O3 to Gd2O3, and from Tb2O3 to Lu2O3, the locations of the occupied and unoccupied f-levels monotonically get shifted to lower levels with increasing atomic number of Ln. In the result, Ce2O3 and Pr2O3 have Eg(Ln 4f–Ln 5d) with the occupied f-levels located above the O 2p levels, whereas Ln2O3 (Ln = Pm, Sm, Eu, Tm, or Yb) have Eg(O 2p–Ln 4f) with unoccupied f-levels located below Ln 5d levels. For the other Ln2O3, the locations of the f-levels are shallow or out of Eg(O 2p–Ln 5d).
GW-level calculations can yield more accurate electronic structures; however, with current computational resources, it is not easy to systematically apply them to various materials that have large unit cells. Alternatively, we analyzed the location of the f-levels using two steps; first, we directly analyzed the f-levels using the projected electronic DOSs (PDOSs) by the GGA+U/w.f method. Then, we compared the Eg values of the GGA/w.o.f and GGA+U/w.f methods.
We analyzed whether the f-levels are formed inside Eg using the PDOSs obtained by the GGA+U/w.f method as shown in . Without the f-levels, the HOMO and LUMO are mainly generated by O 2p and Ga 4s orbitals, respectively, which differs from that of Ln2O3. Unoccupied Ln 5d-levels are slightly higher than the Ga 4s-LUMO (also see the PDOS obtained by the GGA/w.o.f method in Supplementary Figure S2).
Figure 3. Electronic PDOS of 15 Ln3GaO6 obtained by the GGA+U/w.f method. Only Ln 4f (red) and 5d (yellow), Ga 4s (blue), O 2p (black) levels are drawn for simplicity. Energy is shifted by the computational Fermi level. Occupied and unoccupied levels are drawn as solid and dashed lines, respectively. Positive and negative values of PDOS denote the up-spin and down-spin states of electrons, respectively. For easier viewing, the unoccupied La 5d, Ga 4s, and O 2p levels are 2, 30, and 2 times magnified, respectively, whereas the Ln 4f-levels are 0.15 times decreased.
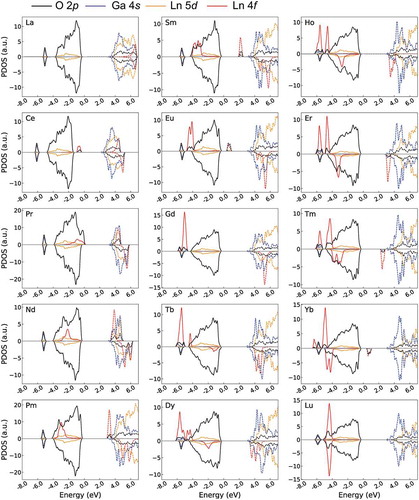
For La3GaO6, the unoccupied and occupied f-levels are generated far from the O 2p-HOMO and Ga 4s-LUMO, respectively, and spin polarizations are almost compensated. For Ce3GaO6, the occupied f-levels at the up-spin state are clearly located over the O 2p and form the HOMO decreasing the Eg value. Then, from Pr3GaO6 to Gd3GaO6, the occupied and unoccupied f-levels at the up-spin states move downward together with increasing atomic number of Ln. Gd3GaO6 has a clear Eg(O 2p–Ga 4s) with the occupied f-levels at the up-spin state and unoccupied f-levels at the down-spin state far from the O 2p-HOMO and Ga 4s-LUMO, respectively. For Tb3GaO36, the occupied f-level at the down-spin state is generated just below the O 2p-HOMO. Then, from Tb3GaO6 to Lu3GaO6, the occupied and unoccupied f-levels at the down-spin state move downward again with increasing atomic number of Ln. Finally, Lu3GaO6 has all occupied f-levels under O 2p-LUMO with compensated spin polarizations.
In addition, we compared the Eg values obtained by the GGA+U/w.f and GGA/w.o.f methods. shows the Eg values of the GGA+U/w.f and GGA/w.o.f methods. The Eg(O 2p–Ga 4s) obtained by the GGA/w.o.f method are similar for all Ln3GaO6 with values of 3.47–3.83 eV. On the other hand, the Eg values obtained by the GGA+U/w.f method significantly change depending on the types of Ln because of the location of f-levels. As suggested by Lal and Gaur [Citation47], we can classify Ln3GaO6 into four groups according to the types of orbitals that form the LUMO and HOMO. We also consider the numerical difference of Eg between the GGA+U/w.f and GGA/w.o.f methods (|ΔEg|).
Figure 4. Eg values of 15 Ln3GaO6 obtained by the GGA+U/w.f and GGA/w.o.f methods. The Eg values of eight Ln3GaO6 (Ln = La, Nd, Gd, Tb, Ho, Dy, Er, or Lu) are not significantly different from each other because occupied or unoccupied f-levels are not formed deeply inside Eg(O 2p–Ga 4s).
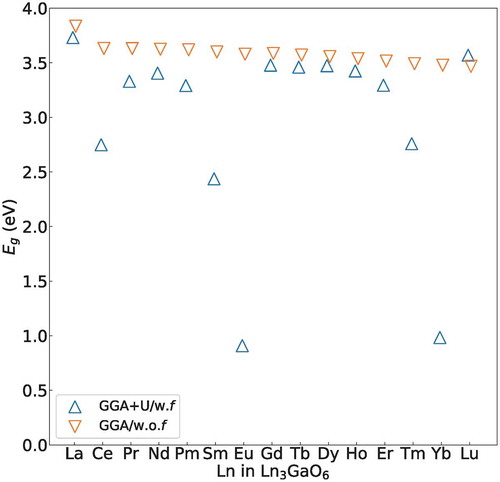
We summarize the classification of Ln3GaO6 in . For the first group [)], Ln3GaO6 (Ln = La, Nd, Gd, Tb, Dy, Ho, Er, or Lu) have Eg(O 2p–Ga 4s), which are less affected by the location of the f-levels (|ΔEg| < 0.3 eV). For the second group [)], Ce3GaO6 and Pr3GaO6 have smaller Eg(Ln 4f–Ga 4s) obtained by the GGA+U/w.f method than those obtained by the GGA/w.o.f method owing to the occupied f-levels over the O 2p-LUMO. For the third group [)], Ln3GaO6 (Ln = Pm, Sm, Eu, Tm, or Yb) also have smaller Eg(O 2p–Ln 4f) obtained by the GGA+U/w.f method than those obtained by the GGA/w.o.f method because of the unoccupied f-levels below the Ga 4s-LUMO inside Eg. These computational results suggest that the f-electrons should be considered as valence electrons for the second and third groups of Ln3GaO6. For the last group [)], we do not find any Ln3GaO6, which has both occupied and unoccupied f-levels inside Eg(O 2p–Ga 4s). The dependence of the location of f-levels for Ln3GaO6 on the type of Ln is generally consistent with that for Ln2O3, which is confirmed by GW-level calculations [Citation19,Citation20] or experiments [Citation46].
Figure 5. Schematic for the classification of Ln3GaO6 according to the location of occupied (red solid line) and unoccupied (red dashed line) f-level of Ln inside Eg(O 2p–Ga 4s). Black solid and blue dashed curves denote the HOMO (O 2p) and LUMO (Ga 4s), respectively. (a) The first group of Ln3GaO6 has Eg(O 2p–Ga 4s) less affected by the location of f-levels of Ln. (b) The second group of Ln3GaO6 has Eg(Ln 4f–Ga 4s). (c) The third group of Ln3GaO6 has Eg(O 2p–Ln 4f). (d) The last group of Ln3GaO6 has Eg(Ln 4f – Ln 4f), but they are not found.
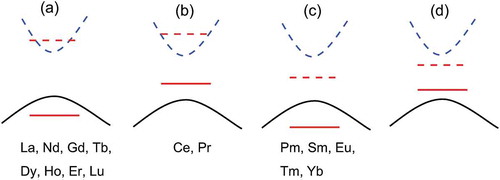
Different features of f-levels depending on the type of Ln of Ln3GaO6 suggest different types of applications. The deep unoccupied f-levels of the third group of Ln3GaO6 (Ln = Pm, Sm, Eu, Tm, or Yb) may have a smaller excitation energy between the HOMO and the unoccupied f-level than other Ln3GaO6. For example, (Gd1−xEux)3GaO6 compounds can be used as phosphors [Citation48]. On the other hand, the first group of Ln3GaO6 (Ln = La, Nd, Gd, Tb, Dy, Ho, Er, or Lu) may have common properties of wide-gap compounds, whose optical absorption, transport properties, and magnetic properties are not affected by the f-levels of Ln. Henceforth, we focus on the first group of eight Ln3GaO6 (Ln = La, Nd, Gd, Tb, Dy, Ho, Er, or Lu) using only the GGA/w.o.f calculations, which are much faster than the GGA+U/w.f calculations because the latter often suffers from slow convergence due to the localized f-levels and spin polarizations.
3.3. Energetic and dynamical stability
shows the energies of Ln3GaO6 (Ln = La, Nd, Gd, Tb, Dy, Ho, Er, or Lu) compared with those of two competing reference states. For the competing reference states, first, the coexisting state of binary sesquioxides of Ln2O3 and Ga2O3 (space group C2/m) is employed. Second, the coexisting state of Ln4Ga2O9 (space group P21/c) and Ln2O3 is employed. According to phase diagrams in experimental studies [Citation49–Citation51], the coexisting state of La4Ga2O9 (space group P21/c) and La2O3 can be formed at the composition of La3GaO6.
Figure 6. Energy differences (eV/atom) of eight Ln3GaO6 (Ln = La, Nd, Gd, Tb, Ho, Dy, Er, or Lu) with respect to their competing reference states, namely, the coexisting states of ¾(Ln2O3) + ¼(Ga2O3) and ¾(Ln4Ga2O9) + ¼(Ln2O3).
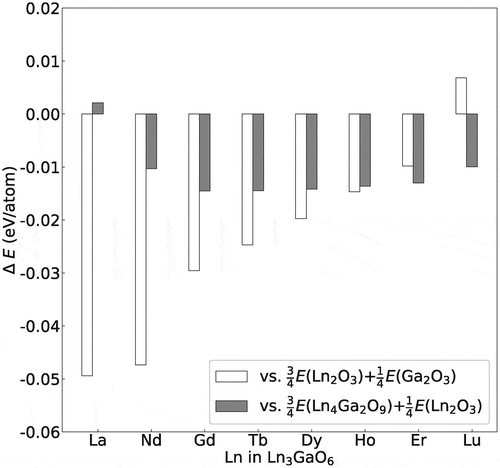
In the result, seven Ln3GaO6 except for Lu3GaO6 are energetically more stable than their competing reference states of Ln2O3 and Ga2O3. The absolute energy differences tend to decrease with increasing atomic number of Ln. Lu3GaO6 is energetically slightly less stable than their corresponding coexisting states of Ln2O3 and Ga2O3.
Compared with the coexisting state of Ln4Ga2O9 and La2O3, the seven Ln3GaO6 series, except for La3GaO6, are energetically more stable. The energy of La3GaO6 is slightly higher (0.002 eV/atom) than that of the coexisting state of La4Ga2O9 and La2O3. This small energy difference implies a possibility of synthesis of La3GaO6 as a single phase depending on the synthesis process, such as extrinsic doping and changing of thermodynamic variables.
To summarize, the six Ln3GaO6 (Ln = Nd, Gd, Tb, Dy, Ho, or Er) are more stable than the two reference states. This computational result on the energetic stability is consistent with the experimental reports. These six oxides on top of Sm3GaO6 and Eu3GaO6 were synthesized as single phases by sintering binary sesquioxide powders at 1400 °C [Citation15] or by crystallization of reactive high temperature hydroxide melt [Citation17].
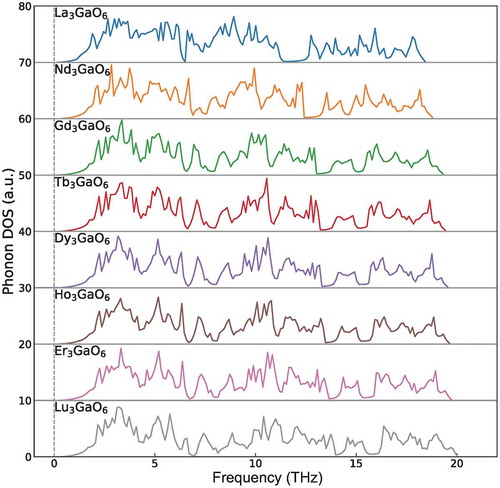
We also investigate the dynamical stability of the eight Ln3GaO6 (Ln = La, Nd, Gd, Tb, Dy, Ho, Er, or Lu) by confirming whether imaginary phonon frequencies on the phonon DOS exist or not. As shows, no imaginary phonon frequencies are found for all the eight Ln3GaO6, although we confirmed that two of them (La3GaO6 and Lu3GaO6) are not energetically in the ground-state. The dynamical stabilities of these oxides suggest that they can also exist as metastable states if they can be once synthesized.
Figure 7. Phonon DOS of eight Ln3GaO6 (Ln = La, Nd, Gd, Tb, Ho, Dy, Er, or Lu). The vertical dashed line denotes zero phonon frequency. No imaginary phonon frequencies are found, which indicates that these eight oxides are dynamically stable.
To investigate the stability of these Ln3GaO6, we consider Pauling’s radius ratio rule [Citation52]. This rule suggests that favorable CNs of cations in the crystal structure depend on the ionic radius ratio (rLn3+/rO2−) of cations (Ln in this study) and anions (O in this study, 1.4 Å [Citation53]). According to this rule, the conditions of 0.41 ≤ rLn3+/rO2− < 0.59 and 0.59 ≤ rLn3+/rO2− < 0.73 correspond to favorable CNs of Ln of six and seven, respectively [Citation54]. As shown in ), in general, rLn3+ decreases with increasing atomic number of Ln with values of 0.86 (Lu)–1.03 (La) Å. These values can be converted to rLn3+/rO2− of 0.61 (Lu)–0.74 (La). This suggests that as rLn3+ is larger (the atomic number of Ln is smaller), it prefers to form the CN of cation of seven rather than of six. The CNs of Ln of Ln3GaO6 and Ln2O3 are seven and six, respectively. Therefore, as rLn3+/rO2− value is larger (the atomic number of Ln is smaller), Ln3GaO6 is preferred to be formed rather than binary oxides, which can be confirmed by the energy differences between Ln3GaO6 and binary oxides as shown in . Lu3GaO6 becomes less stable than the binary oxide because its rLn3+/rO2− (0.61) is decreased to near the limit of 0.59.
3.4. Formation energies of VO
Experimental reports [Citation13,Citation14] on Nd3GaO6 and Gd3GaO6 doped with acceptor dopants (aliovalent cations with lower valences) such as Sr and Ca (for example, Nd3−xSrxGaO6−2/x) imply that Ln3GaO6 have the diffusion mechanism of O based on VO2+. Therefore, it is worthwhile to investigate the possibility of generating VO2+ assuming such type of doping condition with acceptor dopants in Ln3GaO6. When the negatively charged defects generated by substitution of acceptor dopants for Ln3+ or Ga3+ are introduced, holes can be increased with shifting the Fermi level from the center of band gap to the HOMO and positively charged defects such as VO2+ (for semiconductors, these defects are sometimes called ‘hole killers’ [Citation55]) can be generated to compensate for the charge imbalance. In this study, we mainly focus on the case where the Fermi level is shifted to HOMO because a few fractions of extrinsic dopants are commonly substituted (high concentration of approximately 1020–1022/cm3) for constituent cations in oxygen-ion conductors [Citation2,Citation13,Citation14].
The Ev values for the eight Ln3GaO6 (Ln = La, Nd, Gd, Tb, Dy, Ho, Er, or Lu) are summarized in . We employed μO at the pressure and temperature of 1 atm and 1500 K, respectively, based on the sintering conditions for syntheses of Ln3GaO6 (1250–1450 °C) [Citation13–Citation15]. The μO value at a certain temperature (T) and pressure (p) can be obtained as the half energy of O2 gas molecule minus 1.75 eV by the following equation:
Table 1. Ev of eight Ln3GaO6 (Ln = La, Nd, Gd, Tb, Ho, Dy, Er, or Lu). The computational results in this table are obtained using the GGA/w.o.f method. The Fermi level is located at the HOMO (VBM). The values are in eV.
where μO(T, p°) can be taken from thermodynamic tables (see the values in other temperatures in Supplementary Table S3) at the standard pressure of 1 atm [Citation56,Citation57]. In addition, the dielectric constants of these eight La3GaO6, which are used for the image charge correction [Citation34,Citation35], range from 14.6 to 19.4 as summarized in Supplementary Table S4.
First, we analyze Ev as a function of the Fermi level of La3GaO6 as shown in . The three types of Ev(VO0) for the O(I), O(III), and O(IV) sites, which have both O–Ln and O–Ga bonds, are all similar at 2.68–2.89 eV, whereas the Ev(VO0) from the O(II) site, which has only O–Ln bonds, is much larger at 4.92 eV. When the Fermi level is at the center of Eg or shifted into the LUMO, the Ev(VO0) values for the O(I), O(III), and O(IV) sites are much lower than those of Ev(VO+) and Ev(VO2+). In contrast, when the Fermi level is shifted into the HOMO (assuming that acceptor dopants are introduced to substitute for cations, so that positive charges try to compensate for the charge imbalance), the Ev(VO2+) value for the O(II) site is lower than those of the other sites by 0.06–1.04 eV at the same Fermi level, although the other sites also have lower Ev(VO2+) than Ev(VO+) and Ev(VO0) at this region. When the Fermi level is near the HOMO, the Ev(VO2+) values for the three types of O sites except for O(IV) site become even negative values, which imply a spontaneous generation of VO2+.
Figure 8. Ev as a function of Fermi level of La3GaO6. μO is set to be ½E(O2) − 1.75 eV to describe the pressure and temperature at 1 atm and 1500 K, respectively. The other Ln3GaO6 (Ln = Nd, Gd, Tb, Dy, Ho, Er, or Lu) series showed a similar trend (see Supplementary Figures S3). The gradient of the lines denotes the charge of the defect.
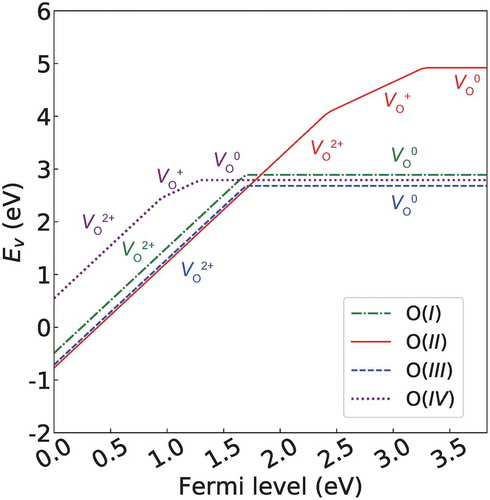
The thermodynamic transition points, which the charge of VO changes, ε(2+/1+), ε(1+/0), and ε(2+/0) are all deeply formed. The highest thermodynamic transition point, which is ε(1+/0) for the O(II) site, forms a deep level of ~0.6 eV below the LUMO.
We compare the Ev values among the eight Ln3GaO6. The Ev values as a function of the Fermi level for the eight Ln3GaO6 are also shown in Supplementary Figure S3. The trends in the change of stable charge of VO according to the Fermi level are similar to that of La3GaO6 as abovementioned. When the Fermi level is located at the center of Eg, the most stable is VO0 at the O(III) site with Ev values of 2.68–2.86 eV, which are similar to each other for Ln3GaO6. When the Fermi level is close to the LUMO and HOMO, VO0 and VO2+ are energetically favorable, respectively. The most energetically stable VO2+ is preferred for the O(II) site, which has only O–Ln bonds. As shown in Supplementary Figure S4, the top of the HOMO is mainly formed by the O(II) site. Therefore, the lower Ev value for the O(II) site than those of the other O site is reasonable because the Ev value indicates the energy required for breaking the O–cation bonds and removing O out of the oxide. When the Fermi level is located at the center of Eg, the Ev values of VO2+ at the O(II) sites range from 3.06 to 3.19 eV, which are also similar to each other for Ln3GaO6. When the Fermi level is located at the HOMO, the Ev value of VO2+ at the O(II) site of La3GaO6 ranges from 0.33 to 0.38 eV. This is lower than those of the other seven Ln3GaO6 because the Eg value of La3GaO6 is ~0.2 eV larger so that the decrease in the Ev value with the gradient of −2 is additional in the range of larger Eg. The Ev(VO2+) values for the O(I), O(II), and O(III) sites of Ln3GaO6 are negative or close to zero, which implies a spontaneous generation of VO2+. This suggests that Ln3GaO6 can easily generate VO2+ when acceptor dopants substitute for Ln3+ or Ga3+. In addition, when the pressure of O becomes lower, the Ev value for VO further decreases as indicated by EquationEquations (1(1)
(1) ) and (Equation5
(5)
(5) ). Positive charges such as holes and VO2+ compete with each other to compensate for the limited concentration of negative charged defects. Therefore, the generation of VO2+ can be increased by decreasing the pressure of the oxygen source.
3.5. Migration barrier energy (Em) of VO
There are various migration paths of VO2+ in Ln3GaO6. Instead of investigating all types of paths for all types of Ln3GaO6, we chose La3GaO6 as a representative sample and obtained Em for all possible migration paths considering the nearest-neighboring O sites. presents the Em values for possible migration paths of La3GaO6. We named the path after the type of VO2+ site in the initial state for the CI-NEB in the order of O–O distances. The O(II) site is energetically the most stable for VO2+, so that this site is considered as a reference. When we consider the Em value on the migration paths between two O sites other than the O(II) site, we added the energy difference (ΔEref) between the more stable O site (between initial and final states) on the migration path and the O(II) site.
Table 2. Em for various paths of eight La3GaO6. The computational results in this table are obtained using the GGA/w.o.f method. IS, TS, and FS denote the initial, transition, and final states for CI-NEB, respectively.
We identify five migration paths with the lowest Em value in La3GaO6, namely, paths II-1, II-4, II-5 (I-8), III-1 (I-2), and III-2, which are between O(II)–O(II), O(II)–O(III), O(II)–O(I), O(III)–O(I), and O(III)–O(III) sites, respectively. Then, we also compute the Em values on the five migration paths for the other seven Ln3GaO6 (Ln = Nd, Gd, Tb, Dy, Ho, Er, or Lu). These five types of migration paths are displayed in Supplementary Figure S5. Because the O(IV) site has ΔEref of ~1 eV, which is higher than various Em, VO2+ may rarely reach this site.
) shows the Em values for the five migration paths of the eight Ln3GaO6. As abovementioned, we additionally considered the ΔEref for the paths III-1 and III-2 because VO2+ at the O(III) or O(I) sites are less stable than at the O(II) site. Note that those energy differences are slightly larger than those summarized in because the image charge correction is not applied for the CI-NEB method.
The lowest Em value among the five migration paths is found to be path II-1, which is between O(II)–O(II) (see Supplementary Figure S5). In addition, path II-1 is delocalized and connected to the neighboring cell; therefore, this can be the dominant migration path. In contrast, paths II-4, II-5, and III-1 with higher (Em+ΔEref) than the Em value of path II-1 are localized and not connected; therefore, complex combinations of paths for migrating VO2+ to reach the neighboring cell are required. Path III-2 is delocalized and connected to the neighboring cell; however, this path is formed between the less stable O(III) sites. To observe total ionic movements on various migration paths with time scale, other methods such as kinetic Monte Carlo [Citation58,Citation59] and molecular dynamics are necessary. We used FPMD in this study; thus, we will discuss the DO that is obtained from the total ionic movements by FPMD in the next subsection.
La3GaO6 has the lowest Em value on migration path II-1 among the eight Ln3GaO6. Then, as the atomic number of Ln increases, the Em values of the eight Ln3GaO6 also increase. The dependence of Em on the atomic number of Ln is basically not changed when larger computational cells are used (with a little reduction of less than 0.07 eV) as shown in Supplementary Figure S6. Migration path II-1 is neighbored with Ln; therefore, the space for the migration path is related to rLn3+. The Em value on migration path III-1 also increases with the increase in the atomic number of Ln. On the other hand, the Em values on the other three migration paths slightly change or slightly decrease with increasing atomic number of Ln. However, the migration of VO2+ may be dominated by the lowest Em; therefore, it can be expected that La3GaO6 might have the most active migrations of VO2+ followed by Nd3GaO6.
To the best of our knowledge, binary Ln2O3 compounds are not known to be applicable as oxygen-ion conductors. To determine the effect of the existence of Ga, we compare the distance between O sites neighbored with only Ln as shown in ). As abovementioned, path II-1 is between the O(II) sites that only have the chemical bonds with only Ln. It is noticeable that the distances between the O(II) sites in the eight Ln3GaO6 are shorter than the minimum distances between the O sites in the counterpart Ln2O3 by 0.16–0.23 Å (6–8%). In this connection, the Em values for the migration path between these O sites of the eight Ln3GaO6 are much lower than those of the counterpart Ln2O3 by 0.12–0.23 eV (17–21%). Considering the smaller volumes per atom of Ln3GaO6 than those of Ln2O3 ()), we suggest that the advantage of participation of Ga in Ln3GaO6 is to shrink the migration distance for VO and decrease Em, which may result in more active diffusion of VO.
3.6. Oxygen-ion diffusivity (DO) and conductivity (σO)
DO was calculated to investigate the total movement of O among the eight Ln3GaO6 possessing VO2+ by FPMD. The MSDs of O for the computation of DO are displayed in Supplementary Figure S7. To accelerate the O diffusion, we chose a high temperature of 1873 K. Here, 1873 K is a little lower temperature than the melting temperature reported in the La2O3–Ga2O3 phase diagram [Citation49–Citation51]. We confirm that MSDs of Ln and Ga, which are more than 1 Å2, are not found during the FPMD for the eight Ln3GaO6 (not shown).
To compare the computed σO with the experimental values at a lower temperature of 800 °C, we extrapolated σO using the DO value as follows. The temperature dependence of DO can be expressed by the Arrhenius equation:
where DO,0 is a pre-exponential factor, kB is the Boltzmann constant, and Ea is an activation energy. Here, for the Ea of Equationequation 6(6)
(6) , we employed the lowest Em value on path II-1 obtained by the CI-NEB method, which will be discussed later. The DO(T) at temperatures lower than 1873 K can be obtained by the following relationship:
The σO(T) value can be obtained from DO(T) by the Nernst–Einstein equation at the dilute level as follows [Citation60]:
where z is the valence of oxygen, e is the unit charge (1.6 × 10⁻¹⁹ C), and c is the ionic concentration of O in Ln3GaO6.
The main factors of DO,0 are the jumping frequency Г, which is approximately 10−12 Hz in oxides, and the squared distances between the sites α2 [Citation61]. We expect that the values of log DO,0 in EquationEquation (6)(6)
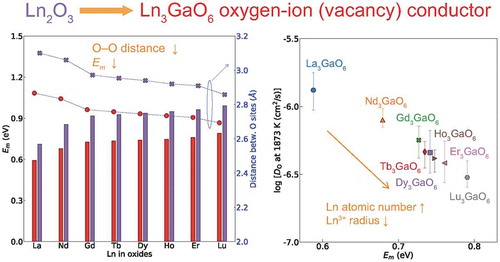
(6) for these eight Ln3GaO6 may be similar to each other considering the same crystal structure and small differences of α2 as shown in ). Then, log DO at the same temperature may depend on Ea, which is assumed to be the lowest Em. ) shows the relationship of log DO at 1873 K and the lowest Em (from ) of Ln3GaO6. A strong linear correlation between these two properties is found with Pearson’s linear correlation coefficient (rp) of −0.99 [Citation62]. It is noticeable that La3GaO6 has the highest DO at this temperature, followed by Nd3GaO6.
Figure 9. (a) Em for various migration paths of eight Ln3GaO6 (Ln = La, Nd, Gd, Tb, Ho, Dy, Er, or Lu) and (b) the lowest Em of the eight Ln3GaO6 and their counterpart Ln2O3 (left vertical axis) and the distances between O sites for the migration path in the crystal structure (right vertical axis).
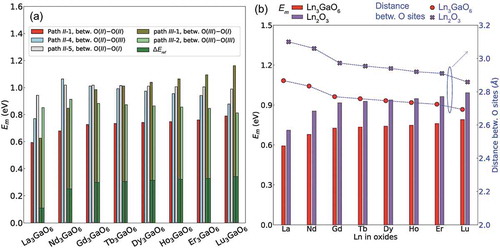
Figure 10. (a) Relationship between DO obtained by FPMD at 1873 K and the lowest Em obtained by CI-NEB, and (b) predicted σO as a function of T based on DO at 1873 K for eight Ln3GaO6 (Ln = La, Nd, Gd, Tb, Ho, Dy, Er, or Lu). Solid symbols denote computed or experimentally measured values from references. Dashed lines denote predicted values. The concentration of VO2+ of our computation is ~2.1% from the computational cell of Ln24Ga8O47. The concentration of VO2+ of Nd2.955Sr0.045GaO5.9775 [Citation13] and Gd2.9Sr0.1GaO5.95 [Citation14] are ~0.4 and ~0.8%, respectively. σO of 10−2 S/cm at 1000 K is described to show a reference level of YSZ [Citation2]. The DO values are averaged from three FPMD trials and error ranges are described between the minimum and maximum values.
![Figure 10. (a) Relationship between DO obtained by FPMD at 1873 K and the lowest Em obtained by CI-NEB, and (b) predicted σO as a function of T based on DO at 1873 K for eight Ln3GaO6 (Ln = La, Nd, Gd, Tb, Ho, Dy, Er, or Lu). Solid symbols denote computed or experimentally measured values from references. Dashed lines denote predicted values. The concentration of VO2+ of our computation is ~2.1% from the computational cell of Ln24Ga8O47. The concentration of VO2+ of Nd2.955Sr0.045GaO5.9775 [Citation13] and Gd2.9Sr0.1GaO5.95 [Citation14] are ~0.4 and ~0.8%, respectively. σO of 10−2 S/cm at 1000 K is described to show a reference level of YSZ [Citation2]. The DO values are averaged from three FPMD trials and error ranges are described between the minimum and maximum values.](/cms/asset/3058ef48-a5aa-4ed4-a6f0-025e4dab9947/tsta_a_1578183_f0010_oc.jpg)
) shows the predicted σO of Ln3GaO6 as a function of temperature obtained by the above assumption. The experimental σO (0.7 × 10⁻² S/cm and 0.3 × 10⁻² S/cm) of Nd3GaO6 and Gd3GaO6 (at dry Ar condition) are shown as the highly reported value between various dopants at 1073 K (800 °C), which are obtained at the composition of Nd2.955Sr0.045GaO5.9775 [Citation13] and Gd2.9Sr0.1GaO5.95 [Citation14], respectively. Our calculated σO values of Nd3GaO6 and Gd3GaO6 at 800 °C are slightly higher than the experimental values, but lie within the same order of magnitude (approximately 10−3–1 × 10⁻² S/cm).
It is worthwhile to discuss that the differences between our prediction and experimental results might be due to the following reasons. The type and amount of dopants affect the concentrations of VO2+ and Ea for the diffusions of oxygen atoms. We used the concentration of VO2+ of ~2.1% from the computational cell of Ln24Ga8O47, while the concentration of VO2+ of Nd2.955Sr0.045GaO5.9775 [Citation13] and Gd2.9Sr0.1GaO5.95 [Citation14] are ~0.4 and ~0.8%, respectively (assuming that the Sr doping perfectly generates VO2+). In addition, Ref. [Citation14] reported that the Ca-doped Gd3GaO6 (Gd3−xCaxGaO6) shows one order lower σO of 0.04 × 10⁻² S/cm compared with the counterpart substituted by Sr (Gd3−xSrxGaO6), which shows a σO of 0.3 × 10⁻² S/cm. This may be because Ea can be affected by the type of dopant. Previous studies on doped ceria [Citation63,Citation64] suggest that the atomic radius of the dopant is an important factor for changing Ea and finding the optimum type of dopant. We expect that optimum dopants may be different from each other for Ln3GaO6 because of different values of rLn3+.
The experimental σO also depends on the microstructure of the experimental samples (for example, densification and particle size) and the measuring environment (for example, wet or dry). Ref. [Citation14] reported that a proton conductivity of 1 × 10⁻³ S/cm was also detected for doped Gd3GaO6 when measured at a slightly lower temperature of 600 °C. When the σO of Gd2.9Sr0.1GaO5.95 was measured at wet Ar condition and 800 °C, σO reportedly increased to 0.9 × 10⁻² S/cm from 0.3 × 10⁻² S/cm measured at dry Ar condition. This implies the partial existence of proton conductivity in the total conductivity. We also confirm that protons can be stabilized depending on the environmental variables, such as the type and pressure of source gas, and temperature; therefore, the proton conductivity can be found for other Ln3GaO6 (see Supplementary Section S.2). When we introduce negatively charged defects by substituting acceptor dopants for Ln3+ or Ga3+, generation of positively charged defects (proton and VO2+), which may be more dominant than holes considering negative defect formation energies for these defects and large band-gaps of the eight Ln3GaO6 compounds, compete with each other to compensate for the charge imbalance. Takahashi et al., suggested that the stability of protons and VO2+ is under a trade-off relationship [Citation65]. Therefore, we need to suppress the incorporation of protons to prevent interruption of VO2+ generation for a suitable application of oxygen-ion conductor. As discussed in Supplementary Section S.2, the increase of generation of VO2+ (decrease of Ev) and decrease of incorporation of protons (increase of protonic defect formation energy) can be achieved by increasing temperature or by decreasing oxygen gas and water vapor pressures.
As with the trend of DO at 1873 K or the lowest Em and the atomic number of Ln, the predicted σO at 1000 K tends to decrease with increasing atomic number of Ln. La3GaO6 and Nd3GaO6 show larger σO at the same temperature than the other Ln3GaO6. The predicted σO values of the eight Ln3GaO6 at 1000 and 1073 K (800 °C) are in the range of 0.1–1.5 × 10⁻² and 0.3–2.2 × 10⁻² S/cm, respectively. This computational result suggests a possibility that these eight Ln3GaO6 can be expected to show a similar order of magnitude of σO in the experiment to a common reference value of ~1 × 10⁻² S/cm of YSZ at 1000 K [Citation2]. We expect that La3GaO6 may achieve a higher σO than the experimentally reported Nd3GaO6 and Gd3GaO6 if successfully synthesized with the same amount of VO.
As widely known, Ea is generally obtained using the gradient of EquationEquation (6)(6)
(6) with several DO’s at different temperatures. However, poor statistical data such as insufficient MSD of O are found at temperatures lower than 1873 K. Alternatively, we used the lowest Em as Ea. In this case, we need to assume that the diffusion mechanism and phase of Ln3GaO6 are not changed between the computed and target temperatures, and the diffusion of O is mainly found on the suggested migration path with the lowest Em. We confirm that these eight Ln3GaO6 are dynamically stable so that DO is exclusively obtained for the investigated crystal structures. In addition, we fixed one VO in the computational cell; therefore, the diffusion mainly occurs due to VO (in fact, an O atom migrates in the opposite direction with VO). We also confirm that the main diffusion trajectory of O is similar to migration path II-1 with the lowest Em as shown in Supplementary Figures S5 and S8.
Meanwhile, it is worth investigating how the predicted σO at 1000 K changes according to the Ea value because the diffusions of O may not always occur only on the dominant migration path with the lowest Em. Assuming that the DO at 1873 K is fixed because the FPMD already reflects the features of total movements of O, we investigate the change in predicted σO as a function of ΔEa, which denotes a deviation from the lowest Em for the Ea of EquationEquations (6(6)
(6) )–(Equation8
(8)
(8) ) as shown in Supplementary Figure S9. We confirm that even in the case where ΔEa is 0.1 eV, most of the predicted σO values at 1000 K for these Ln3GaO6 keep the same order of magnitude as 10−3 S/cm (except for Lu3GaO6 with σO of 0.8 × 10⁻³ S/cm). It is found that one order of magnitude of σO at 1000 K is decreased when a relatively large value of ΔEa of ~0.4 eV is increased. Although we exceedingly assume that the diffusions of O mainly occur on the migration path of VO2+ with the highest Em (0.94–1.06 eV) in ), ΔEa is less than 0.4 eV. In an experiment, Ref. [Citation13] reported that doped Nd3GaO6, namely, Nd2.91Ca0.09GaO5.955 and Nd2.955Sr0.045GaO5.9775 showed an Ea value of 0.97 and 1.06 eV, respectively. Ref. [Citation14] reported that doped Gd3GaO6, namely, Gd2.9Ca0.1GaO5.95 and Gd2.9Sr0.1GaO5.95 showed an Ea value of 0.98 and 0.92 eV at dry Ar condition, respectively. Although there are some variables such as different concentrations of VO2+ and existence of dopants, the differences between the lowest Em and the Ea of the more optimum reported value in the experiment of Nd3GaO6 and Gd3GaO6 are approximately less than ~0.3 eV. Therefore, we expect that the prediction error of σO at 1000 K of our model may be less than one order of magnitude.
Before concluding, we suggest another merit of the investigation of Ln3GaO6. Recently, there have been many machine learning studies on exploring good functional materials [Citation66–Citation68]. Despite the efficient search by this type of study, one shortcoming is the insufficient number of training data that exclusively have the target variable in a wide range. Although our predicted σO values of Ln3GaO6 are not the highest among all the reported values, the moderate value of functional property is also useful for an accurate prediction model in a wider search space [Citation68]. We expect that the reported properties of Ln3GaO6 in this study and other relevant future works in experiments may be able to contribute to the construction of abundant training data for the machine learning models in the search for oxygen-ion conductors.
4. Conclusion
We systematically investigated the structural and electronic structure of 15 Ln3GaO6 (space group Cmc21). In general, Ln3GaO6 have decreasing tendency of the Ln–O (or O–Ln) bond lengths and volumes with increasing the atomic number of Ln and decreasing rLn3+. Then, we distinguished eight Ln3GaO6 (Ln = La, Nd, Gd, Tb, Ho, Dy, Er, or Lu) that have Eg(O 2p–Ga 4s) from the others that have the localized f-levels inside Eg(O 2p–Ga 4s) with crosschecks on the previous studies on Ln2O3. These eight Ln3GaO6 are dynamically stable. Among them, six Ln3GaO6 (Ln = Nd, Gd, Tb, Ho, Dy, or Er) are also energetically stable than the competing reference states, which is consistent with experimental reports on successful syntheses of a single phase. La3GaO6 and Lu3GaO6 are energetically slightly less stable than their competing reference states; however, they might be stabilized within a certain process window considering dynamical stabilities and small energy differences from their competing reference states.
The properties related to VO were also analyzed. We confirmed that Ln3GaO6 may easily generate VO2+ by an extrinsic doping with acceptor dopants considering their low Ev when the Fermi level is near the HOMO region. The CI-NEB results showed that the lowest Em values of the eight Ln3GaO6 compounds among various migration paths of VO2+ ranged from 0.59 to 0.79 eV. The Em values of these Ln3GaO6 compounds are much lower than the counterpart Ln2O3, which may be ascribed to the shortened distances between O sites by the participation of Ga3+, which has smaller ionic radius. Among the Ln3GaO6 compounds, La3GaO6 has the lowest Em, followed by Nd3GaO6. The FPMD results showed a strong correlation of the lowest Em obtained by CI-NEB and the DO at 1873 K of Ln3GaO6. Finally, we predicted the σO at 1073 K (800 °C) based on the computed DO and the Em obtained by CI-NEB and confirmed that the predicted σO and the previously reported experimental values have a similar order of magnitude. In particular, La3GaO6 shows a higher predicted σO of 2.2 × 10⁻² S/cm at 1073 K (800 °C) than those of previously reported Nd3GaO6 and Gd3GaO6. In addition, these eight Ln3GaO6 compounds are expected to have a similar σO value as that of the common reference value of 1 × 10⁻² S/cm of YSZ at 1000 K. Considering that the optimum conditions for YSZ, such as the concentration of dopant, and the processing condition have been developed for decades, we expect that these oxides also have potential as suitable oxygen-ion conductors.
The findings of this study can provide insights into the investigation on Ln3GaO6-based oxygen-ion conductors. The σO values of these oxides can be further improved by additional cation doping and mixing. In addition, Ln3GaO6 compounds have lower melting temperatures than YSZ (~1700 °C [Citation49–Citation51,Citation69] vs. >2700 °C [Citation70]), which can provide an advantage of processing at lower temperatures.
Supplemental Material
Download PDF (3.8 MB)Acknowledgments
The authors thank Drs. Shin Tajima, Seiji Kajita, and Hiroshi Ohno in Toyota Central R&D Lab. for fruitful discussions.
Disclosure statement
No potential conflict of interest was reported by the authors.
Supplementary material
Supplemental data for this article can be accessed here.
Related Research Data
References
- Knauth P, Tuller HL. Solid-state ionics: roots, status, and future prospects. J Am Ceram Soc. 2002;85:1654–1680.
- Skinner SJ, Kilner JA. Oxygen ion conductors. Mater Today. 2003;6:30–37.
- Gellings PJ, Bouwmeester H. Handbook of solid state electrochemistry. CRC press; 1997. ISBN: 9780849389566
- Mogensen M, Sammes NM, Tompsett GA. Physical, chemical and electrochemical properties of pure and doped ceria. Solid State Ion. 2000;129:63–94.
- Sammes N, Tompsett G, Näfe H, et al. Bismuth based oxide electrolytes—structure and ionic conductivity. J Eur Ceram Soc. 1999;19:1801–1826.
- Shitara K, Moriasa T, Sumitani A, et al. First-principles selection of solute elements for Er-stabilized Bi2O3 oxide-ion conductor with improved long-term stability at moderate temperatures. Chem Mater. 2017;29:3763–3768.
- Ishihara T, Matsuda H, Takita Y. Doped LaGaO3 perovskite type oxide as a new oxide ionic conductor. J Am Chem Soc. 1994;116:3801–3803.
- Drennan J, Zelizko V, Hay D, et al. Characterisation, conductivity and mechanical properties of the oxygen-ion conductor La0.9Sr0.1Ga0.8Mg0.2O3-x. J Mater Chem. 1997;7:79–83.
- Huang K, Goodenough JB. A solid oxide fuel cell based on Sr- and Mg-doped LaGaO3 electrolyte: the role of a rare-earth oxide buffer. J Alloys Compd. 2000;303:454–464.
- Ishihara T, Shibayama T, Honda M, et al. Intermediate temperature solid oxide fuel cells using LaGaO3 electrolyte II. Improvement of oxide ion conductivity and power density by doping Fe for Ga site of LaGaO3. J Electrochem Soc. 2000;147:1332–1337.
- Gao Z, Miller EC, Barnett SA. A high power density intermediate-temperature solid oxide fuel cell with thin (La0.9Sr0.1)0.98(Ga0.8Mg0.2)O3‐δ electrolyte and nano-scale anode. Adv Func Mater. 2014;24:5703–5709.
- Brett DJ, Atkinson A, Brandon NP, et al. Intermediate temperature solid oxide fuel cells. Chem Soc Rev. 2008;37:1568–1578.
- Purohit RD, Chesnaud A, Lachgar A, et al. Development of new oxygen ion conductors based on Nd4GeO8 and Nd3GaO6. Chem Mater. 2005;17:4479–4485.
- Iakovleva A, Chesnaud A, Animitsa I, et al. Insight into the synthesis and electrical properties of alkali-earth-substituted Gd3GaO6 oxide-ion and proton conductors. Int J Hydrogen Energy. 2016;41:14941–14951.
- Liu F, Liu Q, Liang J, et al. A systematic study on crystal structure and magnetic properties of Ln3GaO6 (Ln= Nd, Sm, Eu, Gd, Tb, Dy, Ho and Er). J Solid State Chem. 2004;177:1796–1802.
- Yamane H, Sakamoto T, Kubota S-I, et al. Gd3GaO6 by X-ray powder diffraction. Acta Crystallogr C. 1999;55:479–481.
- Zeier WG, Roof IP, Smith MD, et al. Crystal growth of Ln3GaO6 (Ln= Nd, Sm, Eu and Gd): structural and optical properties. Solid State Sci. 2009;11:1965–1970.
- Petit L, Svane A, Szotek Z, et al. First-principles study of rare-earth oxides. Phys Rev B. 2005;72:205118.
- Jiang H, Gomez-Abal RI, Rinke P, et al. Localized and itinerant states in lanthanide oxides united by GW@ LDA+U. Phys Rev Lett. 2009;102:126403.
- Jiang H, Rinke P, Scheffler M. Electronic properties of lanthanide oxides from the GW perspective. Phys Rev B. 2012;86:125115.
- Gillen R, Clark SJ, Robertson J. Nature of the electronic band gap in lanthanide oxides. Phys Rev B. 2013;87:125116.
- Blöchl PE. Projector augmented-wave method. Phys Rev B. 1994;50:17953–17979.
- Kresse G, Joubert D. From ultrasoft pseudopotentials to the projector augmented-wave method. Phys Rev B. 1999;59:1758–1775.
- Kresse G, Furthmüller J. Efficiency of ab-initio total energy calculations for metals and semiconductors using a plane-wave basis set. Comput Mater Sci. 1996;6:15–50.
- Kresse G, Furthmüller J. Efficient iterative schemes for ab initio total-energy calculations using a plane-wave basis set. Phys Rev B. 1996;54:11169–11186.
- Perdew JP, Burke K, Ernzerhof M. Generalized gradient approximation made simple. Phys Rev Lett. 1996;77:3865–3868.
- Dudarev SL, Botton GA, Savrasov SY, et al. Electron-energy-loss spectra and the structural stability of nickel oxide: an LSDA+U study. Phys Rev B. 1998;57:1505–1509.
- Fabris S, de Gironcoli S, Baroni S, et al. Taming multiple valency with density functionals: a case study of defective ceria. Phys Rev B. 2005;71:041102.
- Fabris S, de Gironcoli S, Baroni S, et al. Reply to “Comment on ‘Taming multiple valency with density functionals: A case study of defective ceria’. Phys Rev B. 2005;72:237102.
- Castleton C, Kullgren J, Hermansson K. Tuning LDA+U for electron localization and structure at oxygen vacancies in ceria. J Chem Phys. 2007;127:244704.
- Singhal SC, Kendall K. High-temperature solid oxide fuel cells: fundamentals, design and applications. Elsevier Science; 2003.ISBN: 1856173879
- Lee J, Ohba N, Asahi R. Discovery of zirconium dioxides for the design of better oxygen-ion conductors using efficient algorithms beyond data mining. RSC Adv. 2018;8:25534–25545.
- Van de Walle CG, Neugebauer J. First-principles calculations for defects and impurities: applications to III-nitrides. J Appl Phys. 2004;95:3851–3879.
- Lany S, Zunger A. Assessment of correction methods for the band-gap problem and for finite-size effects in supercell defect calculations: case studies for ZnO and GaAs. Phys Rev B. 2008;78:235104.
- Lany S, Zunger A. Accurate prediction of defect properties in density functional supercell calculations. Modell Simul Mater Sci Eng. 2009;17:084002.
- Togo A, Oba F, Tanaka I. First-principles calculations of the ferroelastic transition between rutile-type and CaCl2-type SiO2 at high pressures. Phys Rev B. 2008;78:134106.
- Togo A, Chaput L, Tanaka I, et al. First-principles phonon calculations of thermal expansion in Ti3SiC2, Ti3AlC2, and Ti3GeC2. Phys Rev B. 2010;81:174301.
- Baroni S, Giannozzi P, Testa A. Green’s-function approach to linear response in solids. Phys Rev Lett. 1987;58:1861–1864.
- Henkelman G, Uberuaga BP, Jónsson H. A climbing image nudged elastic band method for finding saddle points and minimum energy paths. J Chem Phys. 2000;113:9901–9904.
- Henkelman G, Jónsson H. Improved tangent estimate in the nudged elastic band method for finding minimum energy paths and saddle points. J Chem Phys. 2000;113:9978–9985.
- Oka M, Kamisaka H, Fukumura T, et al. DFT-based ab initio MD simulation of the ionic conduction in doped ZrO2 systems under epitaxial strain. Phys Chem Chem Phys. 2015;17:29057–29063.
- Bai X-M, Zhang Y, Tonks MR. Strain effects on oxygen transport in tetragonal zirconium dioxide. Phys Chem Chem Phys. 2013;15:19438–19449.
- Nosé S. A unified formulation of the constant temperature molecular dynamics methods. J Chem Phys. 1984;81:511–519.
- Shuichi N. Constant temperature molecular dynamics methods. Prog Theor Phys Supp. 1991;103:1–46.
- Greenwood NN, Earnshaw A. Chemistry of the elements. Butterworth-Heinemann; 1997. ISBN: 0750633654
- Altman AB, Pacold JI, Wang J, et al. Evidence for 5d-σ and 5d-π covalency in lanthanide sesquioxides from oxygen K-edge X-ray absorption spectroscopy. Dalton Trans. 2016;45:9948–9961.
- Lal H, Gaur K. Electrical conduction in non-metallic rare-earth solids. J Mater Sci. 1988;23:919–923.
- Choi S, Kim K, Nahm S, et al. Controlled synthesis and improved luminescent properties of (Gd1−x, Eux)3GaO6 phosphors fabricated via spray pyrolysis. Opt Mater. 2009;31:1684–1687.
- Zinkevich M, Geupel S, Aldinger F, et al. Phase diagram and thermodynamics of the La2O3–Ga2O3 system revisited. J Phys Chem Solids. 2006;67:1901–1907.
- Zheng F, Bordia RK, Pederson LR. Phase constitution in Sr and Mg doped LaGaO3 system. Mater Res Bull. 2004;39:141–155.
- Yoshimoto K, Masuno A, Ueda M, et al. Low phonon energies and wideband optical windows of La2O3-Ga2O3 glasses prepared using an aerodynamic levitation technique. Sci Rep. 2017;7:45600.
- Pauling L. The principles determining the structure of complex ionic crystals. J Am Chem Soc. 1929;51:1010–1026.
- Shannon RD. Revised effective ionic radii and systematic studies of interatomic distances in halides and chalcogenides. Acta Crystallogr A. 1976;32:751–767.
- Xiao Z, Yan Y. Progress in theoretical study of metal halide perovskite solar cell materials. Adv Energy Mater. 2017;7:1701136.
- Zunger A. Practical doping principles. Appl Phys Lett. 2003;83:57–59.
- Stull DR, Prophet H. JANAF thermochemical tables. National Standard Reference Data System; 1971.
- Reuter K, Scheffler M. Composition, structure, and stability of RuO2 (110) as a function of oxygen pressure. Phys Rev B. 2001;65:035406.
- Pornprasertsuk R, Cheng J, Huang H, et al. Electrochemical impedance analysis of solid oxide fuel cell electrolyte using kinetic Monte Carlo technique. Solid State Ion. 2007;178:195–205.
- Jeon SH, Son W-J, Park BH, et al. Multiscale simulation on electromigration of the oxygen vacancies in metal oxides. Appl Phys A. 2011;102:909–914.
- Seko A, Koyama Y, Matsumoto A, et al. First-principles molecular dynamics study for average structure and oxygen diffusivity at high temperature in cubic Bi2O3. J Phys Condens Matter. 2012;24:475402.
- He X, Zhu Y, Epstein A, et al. Statistical variances of diffusional properties from ab initio molecular dynamics simulations. npj Comput Mater. 2018;4:18.
- Evans JD. Straightforward statistics for the behavioral sciences. Brooks/Cole; 1995.ISBN: 0534231004.
- Andersson DA, Simak SI, Skorodumova NV, et al. Optimization of ionic conductivity in doped ceria. Proc Natl Acad Sci USA. 2006;103:3518–3521.
- Nakayama M, Martin M. First-principles study on defect chemistry and migration of oxide ions in ceria doped with rare-earth cations. Phys Chem Chem Phys. 2009;11:3241–3249.
- Takahashi H, Yashima I, Amezawa K, et al. First-principles calculations for the energetics of the hydration reaction of acceptor-doped BaZrO3. Chem Mater. 2017;29:1518–1526.
- Seko A, Togo A, Hayashi H, et al. Prediction of low-thermal-conductivity compounds with first-principles anharmonic lattice-dynamics calculations and bayesian optimization. Phys Rev Lett. 2015;115:205901.
- Lee J, Seko A, Shitara K, et al. Prediction model of band gap for inorganic compounds by combination of density functional theory calculations and machine learning techniques. Phys Rev B. 2016;93:115104.
- Sendek AD, Yang Q, Cubuk ED, et al. Holistic computational structure screening of more than 12000 candidates for solid lithium-ion conductor materials. Energy Environ Sci. 2017;10:306–320.
- Nicolas J, Coutures J, Coutures JP, et al. Sm2O3 Ga2O3 and Gd2O3 Ga2O3 phase diagrams. J Solid State Chem. 1984;52:101–113.
- Ren X, Pan W. Mechanical properties of high-temperature-degraded yttria-stabilized zirconia. Acta Mater. 2014;69:397–406.