
 ?Mathematical formulae have been encoded as MathML and are displayed in this HTML version using MathJax in order to improve their display. Uncheck the box to turn MathJax off. This feature requires Javascript. Click on a formula to zoom.
ABSTRACT
Besides conventional applications for porous monoliths such as filtration, open porosity enables capillary transport. For this application, porous polymer-derived ceramic monoliths (SiOC) with different pore morphology and porosity were obtained by solution-based freeze casting. Methylpolysiloxane and (3-aminopropyl)triethoxysilane were used as a precursor and cross-linking agent, respectively. Tert-butyl alcohol and cyclohexane acted as solvents and created prismatic and dendritic pore morphology. Additionally, differences in solid loading and the addition of preceramic filler particles changed the open porosity from 62% to 79%, the mean pore window diameter from 11 µm to 21 µm and the isotropy. The lateral surface of the monoliths is mainly closed due to the use of a Si-coated film as an intermediate layer which prevents nucleation. Within the parameters characterizing the pore structure, open porosity and pore window diameter were found to be most influencing on wicking tested by the Washburn-Sorption method. The permeability was obtained by constant head experiments and from the viscous-dominated part of the wicking curve. Furthermore, predictions of wicking using the Lucas–Washburn equation with gravity effect which bases on the assumption of capillary bundles were conducted. Wicking experiments showed that describing a real porous structure by macroscopic parameters may not be sufficient for structures deviating strongly from the assumption of capillary bundles. The combination of prediction with the knowledge of main influencing factors allows for tailoring the pore structure of SiOC monoliths prepared by solution-based freeze casting for capillary transport applications.
GRAPHICAL ABSTRACT

1. Introduction
Porous monolithic materials are required in a wide range of industries including energy and manufacturing. In order to enable mass transport, high permeability is a prerequisite for applications, such as catalysis, gas adsorption, water filtration, energy storage/conversion or even tissue engineering [Citation1–Citation7].
Besides these applications, the aerospace industry uses porous materials in propellant management devices or liquid acquisition devices for phase separation to ensure gas-free liquid delivery to the engines [Citation8,Citation9]. The liquid is transported by the capillary pressure in the pores of the porous material to rewet parts of the screen that dry out. A saturated porous medium prevents the penetration of gas, as long as the bubble point pressure is not exceeded. Imbibition is commonly defined as the displacement of a non-wetting fluid by a wetting fluid in a porous medium. Wicking is used to make a statement about the capillary-driven transport ability in porous materials.
Nowadays, metallic screens are used as porous materials in propellant management devices with a structured porous structure. But non-metallic inorganic materials for transport processes may offer advantages compared with the metallic screens. Properties such as chemical and thermal stability, corrosion resistance, controllable surface characteristics, relatively low density and low thermal conductivity make the application of porous ceramics for capillary transport a potential alternative. Moreover, the lower thermal conductivity compared to metals reduces the risk of diminished wicking behaviour due to evaporation in non-isothermal cryogenic conditions [Citation10,Citation11]. Furthermore, it is possible to adjust the pore structure of ceramic parts, e.g. the pore size, the porosity and the pore morphology by applying different pore shaping methods like replica processes, additive manufacturing, sacrificial templating, direct foaming and phase separation [Citation12,Citation13]. Additionally, even the production of parts in final shape is possible, which can reduce the production and maintenance costs.
Some research was already done on the wicking of porous non-metallic inorganic material. Einset [Citation14] investigated the capillary rise in carbonaceous porous media of similar pore structure using various liquids. The height over time was measured by an optical method and was used to determine the infiltration of the porous material. Capillary rise of organic liquids into 3D-stitched fibrous carbon preforms with the same pore structure was investigated by Kumar et al. [Citation15] using the optical measurement to obtain the increasing liquid front in the porous ceramic. They measured the flow rate of water through the porous material and calculated the permeability of it. In a second paper, Kumar et al. [Citation16] investigated the capillary infiltration rates of silicone into 3D-stitched fibrous carbon preforms. Okada et al. investigated the capillary rise properties of porous mullite ceramics [Citation17] and geopolymers [Citation18] prepared by an extrusion method using water as the test liquid. The investigated mullite ceramics showed a fair alignment of cylindrical pores running parallel to the extrusion direction. The liquid rise within the sample was recorded with an optical measurement. Popa et al. [Citation19] also investigated the capillary rise properties of porous mullite ceramics prepared by an extrusion method. The capillary rise height was measured by optical observation, using water as the test liquid.
Compared to conventional ceramics such as Al2O3, TiO2 and mullite polymer-derived ceramics offer some advantages. Significantly reduced thermal conductivity ensures benefits in capillary transport at cryogenic conditions and lower pyrolysis/sintering temperatures provide advantages in terms of environment and costs [Citation20]. Furthermore, incomplete decomposition of the organic groups at low pyrolysis temperatures results in the creation of micropores and allows for the adjustment of the surface characteristic, e.g. hydrophilicity. The unique adjustment of micropores and hydrophilicity by pyrolysis temperature enables additional possibilities to adapt the material to specific capillary transport applications. In contrast to conventional powder-based fabrication methods, preceramic polymers offer a great versatility in shaping techniques. Also, shaping methods assigned to polymers such as solution-based freeze-casting can be used [Citation21].
The process of freeze casting, which is a templating method, allows to vary the properties of porous structures in a wide range. Hence, it has attracted considerable interest in recent years [Citation22–Citation25]. Though most research is carried out on dispersed particles (suspension-based freeze casting), solution-based freeze casting of preceramic polymers shows great potential in creating promising pore structures. Rather than rejection and entrapment of particles, thermally induced phase separation is the segregation mechanism in solution-based freeze casting [Citation26]. Generally, pores are created by phase separation of a two-component system during freezing and the subsequent sublimation of the solvent crystals. At the beginning of solution-based freeze casting, a soluble phase (e.g. preceramic polymer) is dissolved in a liquid phase. Freezing of the solution results in crystallization of the liquid phase and depletion of liquid phase around growing crystals. Consequently, the volume between the solvent crystals depletes completely in the liquid phase and enriches in the solid phase. After completely frozen, sublimation removes the solidified liquid phase and thereby creates the porous structure which reflects the shape of the crystals. To a great extent, the liquid phase defines the pore morphology, ranging from cellular to lamellar, dendritic or prismatic [Citation25,Citation27–Citation29].
Very little is known about wicking in porous polymer-derived SiOC ceramics. Grebenyuk et al. [Citation30] investigated the influence of pore size on the wicking of SiOC ceramics prepared by suspension-based freeze casting using water as dispersing medium. The sample weight was monitored to record the penetrated liquid into the porous structure. Increasing permeability for increasing pore size was observed. Additionally, a good agreement with theoretical predictions according to Lucas–Washburn equation was found for all samples.
The impact of important parameters characterizing the pore structure on the wicking behaviour was investigated for porous materials which can be described by the fractal theory [Citation31,Citation32]. Pore morphology, anisotropy and open porosity are properties which are supposed to have a great influence on wicking.
In this study, the investigation of the influence of different pore structures on isothermal wicking of porous SiOC monoliths prepared by solution-based freeze casting was conducted. Solution-based freeze casting of preceramic polymers enables to adjust important pore structure-related parameters independently in a wide range and hence allows to study the impact of parameter variations. Furthermore, the effect of different lateral surface conditions on wicking can be investigated by using solution-based freeze casting. The intention of the closed lateral surface is preventing dry out of the structure in capillary transport applications.
2. Experimental section
2.1. Materials
Porous ceramic monoliths were prepared by freeze casting. All filler-free samples were prepared by solution-based freeze casting, whereas a modified solution-based freeze-casting process was used for the samples containing preceramic filler particles. Details to this process can be found elsewhere [Citation33]. A commercial methyl polysiloxane (Silres® MK, Wacker Chemie AG, Germany) was used together with (3-aminopropyl)triethoxysilane (APTES, abcr GmbH, Germany) as a cross-linking agent. Cyclohexane (CH, >99%, Sigma Aldrich Chemie GmbH, Germany) and tert-butyl alcohol (TBA, >99%, Thermo Fisher GmbH, Germany) acted as solvents. All raw materials were used without further treatment or purification. The preceramic filler particles were prepared using the same composition as the matrix. After homogenization and drying, the fillers were cross-linked and ball milled to a mean particle size of d50 = (2.63–3.34) µm. A detailed description of the filler preparation can be found elsewhere [Citation33].
2.2. Freeze casting
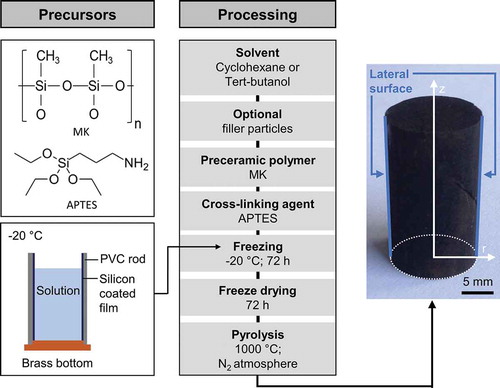
The preparation of monolithic samples by solution-based freeze casting is depicted in . In case of filler containing samples, filler particles were added first to the solvent under vigorous stirring. To ensure the liquid state of the solvent, TBA (Tm = 23°C – 26°C) was heated to 50°C in an oil bath. Whereas, CH (Tm = 6.5°C) was used at room temperature without any external heating. After the addition of MK and homogenization for 30 min under stirring, APTES was added as a cross-linking agent at an amount of 1 mol%. Stirring was continued for 3 min to ensure a good distribution of APTES. Subsequent degassing at 300 mbar for 30 s removed gas bubbles created during stirring. The solution was poured into a mold, which consists of a brass bottom and a PVC rod with an inner diameter of 20 mm and a height of 60 mm. A silicon-coated PET film (Hostaphan RN 30 2SLK, Mitsubishi Polyester Film GmbH, Germany) was used as a separation layer between solution and rod. After casting, the mold was transferred to a freezer at −20°C. The mold remained at the freezer for 72 h to enable easy demolding without changing the geometry of the sample. Cross-linking is slowed down due to the low temperature and hence longer times are necessary for sufficient cross-linking. After demolding, the solvent was sublimated in a freeze dryer for 72 h at −20°C shelf temperature and a pressure of 1000 µbar. Finally, the monoliths were pyrolyzed at 1000°C under the flow of nitrogen with a heating rate of 2 K/min and a dwelling time of 4 h. For wicking experiments, the both ends in z-direction were removed to ensure an open and flat cross-section as inlet available. After complete characterization of the as prepared specimens, the outside layer of the lateral surface was removed by a file. Subsequently, cleaning using compressed air and an ultrasonic bath removes grinding remainings. Due to the very low thickness of the dense outside layer, the sample radii before and after removing the dense outside layer were considered to be equal.
Figure 1. Process scheme of monolith preparation by solution-based freeze casting of polymeric solutions.
The labeling ‘EC’ (experimental closed) and ‘EO’ (experimental open) refers to the condition of the sample and depicts the as prepared lateral surface and the lateral surface after removal of the outside layer, respectively. Furthermore, ‘N’ indicates results obtained by numerical calculations. The samples were given the nomenclature: [solvent] [solid loading in wt%]/[preceramic filler content in vol% of solid] _ [condition of sample]. Whereby, the polymeric precursor, the cross-linking agent and the filler particles counted as a solid fraction. gives an overview of all samples and their compositions.
Table 1. Labeling and composition of studied samples.
2.3. Characterization
The pore structure was investigated using a scanning electron microscope (SEM, field-emission SEM SUPRA 40, Zeiss, Germany) operated at 10 kV with specimens mounted on carbon tape. Samples were sputtered with gold (K550, Emitech, Judges Scientific Plc., UK) prior to the measurement. Pore window diameter distribution and effective open porosity ϕ were obtained by mercury intrusion porosimetry (Pascal 140/440, POROTEC GmbH, Germany). To ensure comparability, the specimens were taken from the position r = 0 mm and z = 10 mm referring to the coordinate system depicted in . Three specimens of each sample were tested. For the evaluation of the wicking results, the static radius Rs was considered to be equal to the average pore window diameter Rmerc = Rs.
The Washburn sorption method was used to study the wicking process in porous media. The whole cylindrical samples were used for this characterization. To ensure a homogeneous and well accessible pore structure at the top and bottom, 2 mm were cut from the top and bottom. While the top and bottom are open for fluid flow, the outer side was closed or open. During the measurement, the temporal mass increase was recorded. shows the experimental setup for the wicking experiment. The weight of the porous samples was measured using a high precision balance (LA310S, Sartorius AG, Germany) with a precision of ±0.0001 g. The balance was mounted on a height-adjustable platform. This platform could be moved in the vertical direction with two stepper motors (VRDM566/50, Berger Lahr/Schneider Electric). The porous sample was attached to a sample holder, which is attached to the balance from beneath over a metallic wire. The porous sample was placed inside a container with a diameter of 9.5 cm. The lid of the container has a small hole allowing for a frictionless movement of the sample. The container was partially filled with a hydrofluoroether (HFE-7500, 3M Deutschland GmbH, Germany). The liquid properties of HFE-7500 are summarized in . It shows perfect wetting characteristic with different materials. Therefore, a zero contact angle was assumed with the used material, giving cos θ = 1 [Citation10]. The vertically oriented sample was brought into contact with the liquid using the height-adjustable platform. The immersion process was stopped on the first contact with the liquid surface. This leads to the fact, that only the bottom of the sample was in contact with the liquid. Wicking begins immediately at the first contact between the porous sample and liquid. The liquid imbibes into the porous material, which increases the mass of the porous sample. This increasing mass was recorded by the balance cell with a sample rate of 20 Hz. This process continues until an equilibrium state was reached or the porous sample appears to be completely saturated. A constant weight signals complete saturation of the porous structure . Subsequently, the porous sample was driven approx. 5 mm out of the liquid to lose contact with the liquid. All experiments were carried out under room temperature and ambient pressure.
Table 2. Liquid properties of HFE-7500 and water at 298.15 K and 101,325 Pa. Source: Product data sheet of supplier 3M.
Figure 2. Schematic representation of the experimental wicking device.
Based on the weight measurement, some corrections are needed to make a statement about the pure mass increase during the wicking experiment. These corrections include the decreasing liquid level in the container during the experiment as well as the buoyancy and the Wilhelmy effect. The liquid level decrease due to the imbibition of the liquid into the sample could be eliminated by using the geometry of the sample and the experimental container. Furthermore, the buoyancy force and the Wilhelmy effect have to be considered. In order to account for these effects, a correction of the weight measurement was used, which has already been used by Grebenyuk et al. [Citation30,Citation34]. For this purpose, the weight of the completely saturated sample, but a partially submerged sample is subtracted from the weight of the completely saturated sample.
Permeability
Permeability K is the ability of a porous material to allow fluids to pass through it. It is a property of the porous material and is commonly defined by the Darcy law [Citation35]. Both methods which are used in this work to determine the permeability base on the Darcy law, which is given by
To facilitate an overview, all symbols used in equations are listed in Table S1. Different methods are proposed to determine the permeability of a porous structure in literature. Thus, the permeability can be determined, for example by constant head permeability measurements
or as a fitting parameter of the viscous dominated part of the wicking experiment [Citation10,Citation30,Citation36].
This equation is also called Lucas–Washburn equation for porous media. A detailed derivation of EquationEquation (3)(3)
(3) can be found in the supplementary data. With knowledge of the parameters of the porous structure and liquid parameters, the permeability can be determined using this equation. For this, the knowledge of m2/t is required, which can be determined from the wicking experiment. Both methods base on the Darcy law.
Permeability measurements
Both approaches used to flow through the porous medium in the z-direction in order to determine the permeability.
The permeability according to constant head measurements KDarcy was evaluated on cylindrical samples with a radius RDarcy of 5 mm and a height HDarcy of (5–6) mm. Freeze cast monoliths were cut to obtain suitable cylindrical samples. Samples from the lateral surface with an axial orientation in r-direction were prepared as well as samples from the center of the freeze cast monolith with an axial orientation in the z-direction. The orientations are depicted in . Both, samples from the lateral surface as well as samples from the bulk were taken at the axial position of z = 10 mm. Compressible silicon sample holders were used to minimize bypass flow. The mass of the permeated water mw, Darcy at a pressure difference ΔpDarcy of 15 kPa and a time tDarcy of 300 s was recorded. To characterize the lateral surface, samples in r-direction were only tested for water flux through the lateral surface per time and cross-section. With the dynamic viscosity of water at 20°C μw = 1.00 mPas and the density of water at 20°C ρw= 998 kg/m3, the permeability KDarcy can be calculated according to EquationEquation (2)(2)
(2) . To reduce deviations due to intake losses, the specimens were soaked with water prior to measurement. Additionally, an initialization time of 120 s was waited to reach steady-state flow conditions before starting the measurement. Each sample was tested three times and the average permeated mass of water was used for further calculations. After testing the samples from the lateral surface with the as prepared closed lateral surface (‘EC’), the outside layer of the surface was removed and the samples were tested again three times (‘EO’).
The method, proposed by Fries et al. [Citation10], was used to calculate the permeability from the viscous-dominated part of the wicking experiment using EquationEquation (3)(3)
(3) . This Lucas–Washburn equation is only valid for short times. With increasing time, gravity has to be taken into account. According to Fries and Dreyer [Citation37], the Lucas–Washburn equation can be used in the vertical wicking setup up to 10% of the maximum achievable wicking height, in order to neglect the influence of gravity. The height can be recalculated into mass (see supplementary data equation (10)). The values of the equilibrium mass are given in . In this study, values from the wicking experiment up to a mass of 1% of the maximum achievable wicking mass were used to obtain squared mass over time, after the corrections were applied described in section 2. The resulting error is <1% and can, therefore, be neglected. The plot of the squared mass over time shows a constant slope which can be approximated by linear regression. Using this fit, the macroscopic parameters given in section 3, and the physical parameters of the fluid in , the permeability K could be calculated using EquationEquation (3)
(3)
(3) .
Table 3. Geometrical characteristics and macroscopic parameters of the investigated samples.
The results of the permeability by constant head experiments and by fitting the wicking curves are summarized in in section 3.3
3. Results
3.1. Pore structure
(–) depicts SEM images of the characteristic resulting internal pore structure obtained by solution-based freeze casting. The insets represent a schematic representation of the pore structures. The pore structure depends closely on the solvent, the composition and the freezing process. Two pore morphologies can be distinguished, depending on the solvent. Dendritic pores are created in case of using cyclohexane in samples CH20/0, CH40/0 and CH40/50 and prismatic pores when using tert-butyl alcohol in sample TBA40/0. This is in accordance with the literature, describing the observed pore structures as characteristic for the corresponding solvents [Citation26,Citation38]. Furthermore, the internal pore walls are smooth for the samples without filler addition. In pure solution-based compositions, the solvent crystals grow according to the segregation process of thermally induced phase separation [Citation39,Citation40]. This enables a crystal shape which is close to the energetically most favourable shape and hence to very smooth pore wall surfaces. In contrast, the addition of 50 vol% filler particles results in a very rough pore wall surface, as it can be seen in the inset of (). The particles are not completely embedded in the pore walls and hence creating roughness. Since the chemical composition and therefore the decomposition during processing is equal for matrix and filler particles, no detachment or debonding is expected. This expectation is confirmed by the absence of any cracks around filler particles. Furthermore, also the pore morphology is affected by the addition of filler particles as it becomes more isotropic. () shows a dendritic anisotropic pore structure obtained by particle-free freeze casting. In contrast, particle content of 50 vol% being the only difference the pore structure depicted in () is more isotropic. In case of increased isotropy, the differentiation between primary and secondary dendrites becomes more difficult, leading to a structure which looks less arranged and hardly shows any elongated primary dendrites (see insets of (,)). It is assumed that suspended particles are disrupting the regular solidification structure by inducing noise ahead of the freezing front [Citation39]. The solidification microstructure can be influenced by a sufficient amount of noise ahead of the freezing front which disrupts the growth of crystal tips [Citation41]. Hence, fractal patterns are formed instead of regular ones. Fluctuations in the thermal or solute field ahead of the solid–liquid interface can be considered as noise. But also particles located at crystal tips can act as noise by creating small temperature fluctuations and direct contact. Since porosity and pore morphology are only dependent on solid loading and solvent, both properties can be considered as constant throughout one sample. The pore size is influenced by the freezing velocity. The freezing occurs mainly in the radial direction, and as the freezing length in the radial direction is relatively short, no significant changes in pore size can be assumed. Additionally, radial freezing leads to the valid assumption of constant pore size in the axial direction. The observed pore structures are in accordance with reported structures in literature for all investigated compositions [Citation26,Citation39].
Figure 3. Characteristic cross-sectional SEM images of the pore structure of pyrolyzed monoliths and simplified schemes of the pore structure for (a) CH20/0, (b) CH40/0, (c) TBA40/0 and (d) CH40/50; SEM images of the lateral surface of sample CH40/0 (e) as prepared (to a great extend closed) and (f) after removing the dense layer (open lateral surface).
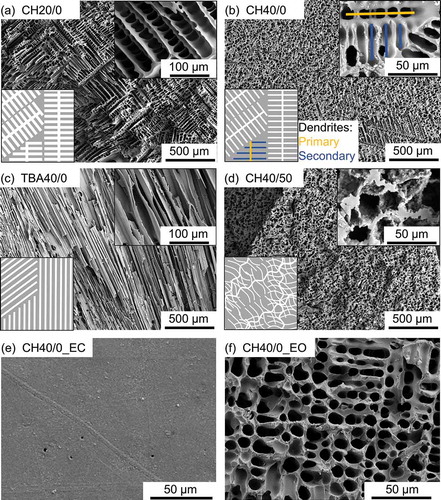
In contrast to (–) do not depict the internal pore structure but the top view of the lateral surface of sample CH40/0. The as prepared state of the lateral surface is shown in () with hardly any pores visible on the surface indicating an almost completely closed lateral surface. The thickness of the layer is (1–5) µm. Very similar observations can be found for all other samples. However, the as prepared lateral surface becomes slightly more open in the order of CH40/0 – TBA40/0 – CH40/50 – CH20/0. This reveals, that anisotropy of the pore structure and decreasing porosity are beneficial for the formation of closed lateral surfaces. Details on the mechanism of the formation of the closed lateral surface can be found in the supplementary data. () shows the lateral surface of sample CH40/0 after the outside layer was removed. No major differences can be observed when comparing with the internal pore structure of sample CH40/0 depicted in (). This observation applies to all investigated samples. In addition, no grinding remainings, such as abraded particles were found in the structure, indicating a successful complete cleaning of the sample. The absence of abraded particles ensures permeability and wicking experiments without the influence of abraded particles hindering flow by blocking pore channels.
The mathematical description of the capillary driven liquid transport in a volume averaged porous medium requires the knowledge of macroscopic parameters. These are the open porosity ϕ, the static radius Rs and the permeability K. depicts open porosity ϕ and mean pore window diameter 2Rmerc for all investigated samples measured by mercury porosimetry. The detailed pore window diameter distribution can be found in the supplementary data. As it can already be assumed assessing the SEM images in (–), CH20/0 shows the highest open porosity ϕ as well as the highest mean pore window diameters 2Rmerc with values of (21.2 ± 1.1) µm and (79.3 ± 0.3) %, respectively. In contrast, CH40/0, TBA40/0 and CH40/50 exhibit almost constant open porosity ϕ with values of (60.8 ± 2.3) %, (63.5 ± 0.3) % and (63.1 ± 0.2) %, respectively. Moreover, also the mean pore window diameter 2Rmerc of (13.9 ± 1.1) µm, (10.9 ± 0.3) µm and (11.1 ± 0.4) µm shows no significant deviation. Monomodal pore window diameter distributions were observed for all investigated samples covering a range of 15 µm to 50 µm (CH20/0) and 6.5 µm to 35 µm (CH40/0, TBA40/0, CH40/50). When further analysing the SEM images of the pore structure in (–) with regards to the difference of pore size and pore window diameter it becomes obvious that pore size equals pore window diameter for TBA40/0 due to its prismatic pore morphology. On the contrary, CH20/0 and CH40/0 exhibit dendritic pore morphology with distinct primary and secondary dendrites and different corresponding pore window sizes. Ratios of around 2 were found for both samples with pore window diameters of primary dendrites being the larger ones. Comparison with mercury porosimetry results clearly reveals that the smaller pore windows of the secondary dendrites are dominant in the mercury porosimetry measurement. Thus, more volume is accessible through pore windows of the secondary dendrites compared with primary dendrites for CH20/0 and CH40/0 [Citation26]. Yet, this is only valid for anisotropic dendritic pore structure since there are no distinct primary and secondary dendrites for increased isotropy caused by particle addition.
Figure 4. Open porosity ϕ and mean pore window diameter 2Rmerc for all studied samples obtained by mercury intrusion.
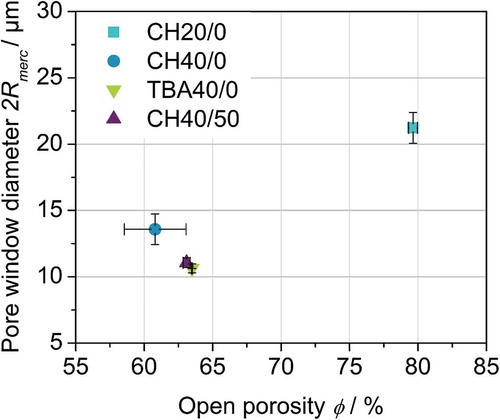
It can be stated, that in this study only the solid loading influences the open porosity ϕ and mean pore window diameter 2Rmerc. While in suspension-based freeze casting the solid loading is reported to have only influence on the open porosity ϕ, it is known that in solution-based freeze casting solid loading also affects the mean pore window diameter [Citation24,Citation26,Citation42]. For the compositions and freezing conditions which were investigated in this study other parameters such as solvent and particle addition do not alter the open porosity ϕ and the mean pore window diameter 2Rmerc. As a result, the pore structure can be changed in terms of pore morphology, anisotropy and pore wall roughness without changing influential properties for capillary transport such as open porosity and mean pore window diameter.
3.2. Water flux through lateral surface
To characterize the water flux through the lateral surface, constant head permeability tests were conducted. shows the water flux j of the lateral surface in dependence of the condition of the lateral surface, where ‘EC’ indicates the as prepared state and ‘EO’ describes the state after removal of the outside layer. In the results are summarized. In accordance with the SEM images in (, ) it can be clearly seen, that the water flux j for the open lateral surface is significantly higher than for closed lateral surface for all samples. Ratios of 2.3 to 5.9 are found, being CH40/50 the sample with the lowest and CH20/0 the one with the highest ratio. The lowest water flux j with a value of 3.32 × 10⁻⁵ k g s−1 m−2 is observed for the closed lateral surface of CH40/0. In contrast, CH20/0 exhibits with 3.88 × 10⁻⁴ k g s−1 m−2 the highest water flux j for closed lateral surface conditions. TBA40/0 and CH40/50 show very similar values of 1.29 × 10⁻⁵ k g s−1 m−2 and 1.47 × 10⁻⁵ k g s−1 m−2, respectively. The significant different water flux j indicates an influence of the composition on the condition of the as prepared lateral surface. When comparing the results for the closed lateral surface, lower water flux j, meaning a larger degree of closed lateral surface, can be achieved by using a high solid loading, cyclohexane as solvent and a filler particle-free composition. Further, it can be stated, that the solid loading has the greatest impact on the condition of the lateral surface.
Figure 5. Water flux through the lateral surface j obtained by constant head permeability measurements for all studied samples as prepared and after removing the dense outside layer.
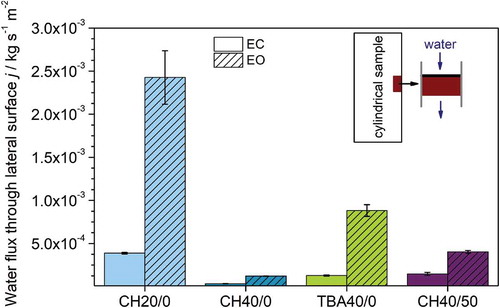
Analyzing the samples with open lateral surface, the water flux j is not limited anymore by the denser outside layer. As a result, the water flux j of the samples with open lateral surface is influenced mainly by the internal pore structure. As for the closed lateral surface, solid loading with its strong influence on open porosity ϕ and pore window diameter 2Rmerc has the largest influence. Hence, the sample with the lowest solid loading (CH20/0) shows the highest water flux j of 2.43 × 10⁻³ k g s−1 m−2. TBA40/0 and CH40/50 with altered pore morphology and anisotropy exhibit intermediate water flux j with values of 8.82 × 10⁻⁴ k g s−1 m−2 and 4.02 × 10⁻⁴ k g s−1 m−2, respectively. On the other hand, the dendritic most anisotropic pore structure of CH40/0 leads to the smallest water flux j of 1.22 × 10⁻⁴ k g s−1 m−2. The same dependences between pore structure and permeability are observed in permeability measurements of samples from the bulk in z-direction. Previous investigations of samples with the same conditions as presented here confirm especially the difference in permeability of CH40/0 and CH40/50 though pore size and porosity are similar. This indicates that also the pore morphology strongly influences the permeability.
3.3. Wicking experiments and theoretical prediction using macroscopic parameters
Besides the knowledge of the open porosity ϕ and the static radius Rs, the permeability K needs to be evaluated in order to calculate the capillary driven liquid transport in a porous medium, described in section 3.1. The values are given in . An additional macroscopic parameter which has to be known to solve the differential equation describing wicking is the static radius Rs. It describes an equivalent capillary pore radius. It can be calculated from the equilibrium between capillary pressure and hydrostatic pressure, as long as the equilibrium condition is known. The equation is given as
This approach was used by Lucas [Citation43] and is known as Jurin’s height. Due to the limited sample height of our investigated samples, the equilibrium could not be reached experimentally and the static radius Rs could not be determined. The estimated wicking height and mass were calculated using EquationEquation (4)(4)
(4) . Additionally, equation (10) which is given in the supplementary data, is necessary. Wicking height and mass are summarized in . Therefore, the mean pore radii Rmerc from the mercury porosimetry measurement were used as the characteristic pore sizes for further calculations. The corresponding mean pore radii Rmerc are given in .
The last macroscopic parameter, which has to be known is the permeability. The method, proposed by Fries et al. [Citation10], was used to calculate the permeability from the viscous-dominated part of the wicking experiment using EquationEquation (3)(3)
(3) .
shows the squared mass over time for the investigated samples. Different wicking rates can be seen for the investigated samples.
Figure 6. The squared height over time for the investigated samples. EquationEquation (3)(3)
(3) was fitted to the experimental line.
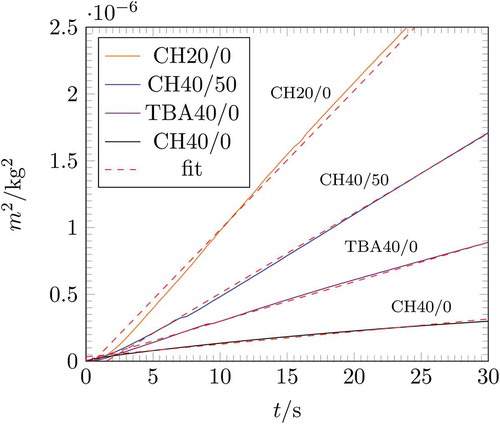
Permeability is a structure parameter and should be similar despite different approaches. Nevertheless, the permeability calculated from the wicking experiment shows a 3 to 39 times higher permeability compared to the permeability obtained from the constant head measurement. A possible explanation for this could be inlet losses, which, due to the low height of (5–6) mm, have an influence on the resulting pressure drop. An increased pressure loss results in a low permeability. Such an inlet pressure drop was not considered in the calculation of the permeability.
The sample CH20/0 shows the highest permeability value of 48.4 × 10⁻¹⁴ m2 for the wicking experiment and 6.43 × 10⁻¹⁴ m2 for the constant head permeability approach of all investigated samples. It can be related to the highest characteristic pore radius of 10.5 μm. It also shows the highest porosity with a value of 79.3%. All other samples show a porosity of about 60%. Among them, CH40/0 shows the lowest permeability value of 3.9 × 10⁻¹⁴ m2 or 0.1 × 10⁻¹⁴ m2, respectively. TBA40/0 and CH40/50 show a similar porosity and characteristic pore radius. However, the permeability varies between them. This can only be attributed to the different pore morphologies. As mentioned, TBA40/0 shows a prismatic pore structure, whereas CH40/50 exhibits a dendritic pore morphology.
The capillary model was used for the theoretical prediction of the wicking behaviour, which reduces the complex porous structure to a simple bundle of aligned capillary tubes of the same radii. The equation for the capillary model is derived from the momentum conservation equation on a single capillary. The driving force for the wicking process is the capillary pressure, which is the result of the curvature of the free surface. The capillary pressure is balanced with viscous forces and hydrostatic pressure [Citation30,Citation44–Citation46]:
This equation is also called the Lucas–Washburn equation with gravity effects. Furthermore, the relative influence of gravity and viscous friction on the wicking can be described using the simplified form of the wicking process, using the following parameters
and
The same parameters were used by [Citation10,Citation30,Citation34,Citation37]. This results in
The parameter b is the relative influence of the viscous friction on the wicking, while c is the relative influence of the gravity on the wicking process. The prerequisite for the application of EquationEquation (5)(5)
(5) is the knowledge of the macroscopic parameters. They were determined in the previous sections and are summarized in . Using the macroscopic parameters and the thermophysical liquid properties of HFE-7500 from , a prediction for each sample type was compiled.
The permeability obtained by the Darcy approach was used for prediction, which is given in the graphs of as solid red line. The fitting permeability, obtained from the experiment was used for the prediction given as a solid blue line. The imbibed mass is scaled by the saturated mass, which was obtained from the completely saturated porous material with the lateral closed surface.
Figure 7. Wicking results of the samples with a lateral open and lateral closed surface compared with the calculated wicking results of EquationEquation (5)(5)
(5) ; The grey areas represent the deviation of the calculation caused by the measurement error of the macroscopic parameters.
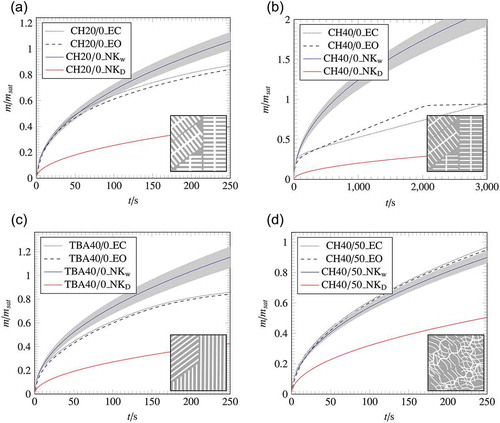
The results of the prediction using the theoretical model are plotted in . The theoretical prediction using the macroscopic parameters with permeability, obtained by the Darcy experiment KDarcy, underestimates the wicking experiment. Thus, it can be concluded that, despite independently determined macroscopic parameters, the wicking equation does not predict the imbibition rate correctly.
As seen in , the prediction using Kwicking for TBA40/0, CH20/0 and CH40/50 shows a good accordance with the experimental data. This can be attributed to the fact, that the permeability is a fitting parameter determined from the first mass increase of the imbibed mass of the wicking experiment. Thus, a match in the first wicking area can be ensured. Furthermore, the wicking equation assumes a porous material to be a bundle of straight capillaries of the same radii. It can be seen that the assumption holds for TBA40/0, CH20/0 and CH40/50 in the investigated time frame. The sample CH40/0 behaves differently compared to the prediction. The experimental curve does not show the typical Lucas–Washburn behaviour. After a first mass increase within the sample, further progression is characterized by a linear mass increase. The deviation in the CH40 sample is due to the fact, that Kwicking was determined from the first mass increase of the experiment. This results in a large Kwicking and thus to a large deviation between prediction and experiment in the further course.
In order to investigate the influence of different pore structures on capillary transport, wicking experiments were performed. The imbibed mass was extracted from the wicking data introduced in section 2. The comparison between the wicking behaviour with a laterally closed and laterally open surface is shown in . The dotted line indicates the experiment with the lateral closed surface, whereas the open lateral surface is shown as dashed line.
The samples TBA40/0, CH20/0 and CH40/50 have no deviations between the laterally closed and open surface, which leads to the conclusion that there is no influence of a closed surface on the wicking behaviour. Furthermore, the samples follow the typical Lucas–Washburn curve. Only the sample CH40/0 shows unexpected wicking behaviour. After the first mass increase, the slope of the imbibed mass changes. In the further course, the imbibed mass increases linearly with time until the sample is completely saturated. Previous wicking tests on samples with the same composition as CH40/0 confirm the peculiar wicking behaviour. Furthermore, CH40/0 shows a 20% higher imbibition rate after removing the closed lateral surface. The lateral open surface favours the imbibition of the liquid into the porous sample [Citation30,Citation44–Citation46].
4. Discussion
4.1. Influence of lateral surface on wicking
The influence of the lateral surface on the wicking behaviour was investigated by comparing wicking experiments with closed (‘EC’) and open (‘EO’) lateral surface. As shown in , the samples TBA40/0, CH20/0 and CH40/50 show a similar mass increase after the removing of the closed lateral surface. This result was expected, but a different wicking behaviour was found for CH40/0. The change in the slope of the wicking curve, the linear wicking behaviour and the increasing the imbibition rate after removing the lateral closed surface leads to the assumption that an additional force within the sample reduces the wicking behaviour of the sample. Removing the outer closed surface, the force is reduced, which enables the liquid to rise faster, but still linearly inside the sample.
The linear wicking behaviour does not match the classic Lucas–Washburn curve. A linear wicking curve could be observed in Grebenyuk and Dreyer [Citation34]. They investigated the wicking behaviour of liquid nitrogen with a superheated porous structure. The linear course was explained by an additional pressure created by the evaporating liquid, which could not escape fast enough from the sample. However, in the case studied in this work, there is no evaporation, creating an additional pressure. Therefore, the behaviour may be explained by the pore structure. At higher magnifications of SEM images in , it can be observed, that some pores of CH40/0 seem to be closed. In contrast, the samples TBA40/0, CH20/0 and CH40/50 show an unstructured, but connected pore structure. Thus, only a reduced number of transport routes for the liquid are available in the CH40/0. A smaller amount of remaining connected pores act like a throttle for the liquid, which causes the linear behaviour. The higher mass increase after removing the outer surface and the reason for the linear course for CH40/0 could not be conclusively clarified in this work.
As a result, the lateral surface can be designed to be closed without significantly changing the wicking behaviour for most of the samples. This opens up different possibilities: Structures with capillary transport functionality can be lateral encapsulated to prevent interactions with the environment such as contamination of the environment or the structure. In addition, dry out of capillary active structures and thus interruption in capillary transport can be prevented. So far, an additional coating process is necessary to provide encapsulation. In the case of CH40/0, an encapsulated structure offers an additional option to adjust the wicking behaviour to a certain application. Furthermore, a less porous lateral surface facilitates the subsequent deposition of a dense or functional coating [Citation47,Citation48]. However, when the wicking conditions change from isothermal at room temperature to non-isothermal at cryogenic temperature, a pronounced difference in wicking behaviour in dependence on the porosity of the lateral surface is expected.
4.2. Influence of pore structure on wicking
shows the comparison of the investigated samples in terms of increasing height over time for the samples with a lateral open surface. As depicted in , the wicking behaviour depends on the pore structure. The first time steps are mostly influenced by the viscous force, whereas for longer times the influence of the gravity becomes more significant [Citation37]. The fastest wicking can be seen in the sample CH20/0, which is due to the highest permeability K. It can be also explained in terms of the parameters in EquationEquations (6)(6)
(6) and (Equation7
(7)
(7) ). The value of b, which describes the relative influence of the viscous force is smaller for CH20/0 compare to the other samples. It means that the resistance is smaller and it is easier for the liquid to flow through the structure. The wicking permeability was used to calculate the parameter b. After a first rapid increase, the curve of CH20/0 shows the biggest change in the slope among the investigated samples. For longer times, the gravity term becomes more dominant. The parameter c of EquationEquation (7)
(7)
(7) describes the relative influence of gravity on wicking.
Figure 8. Wicking curves for all investigated pore morphologies of samples with open lateral surface.
It can be seen in that CH20/0 has the highest value for c, which indicates the highest influence of gravity among the investigated sample. It results in the biggest change in the slope of CH20/0. In contrast to CH20/0, CH40/0 shows a shallow liquid rise inside the sample, indicating a smaller permeability K or a higher value for the relative influence of the viscous force. TBA40/0 and CH40/50 show the same values for the relative influence of gravity, which is due to the fact that the parameter c only requires the characteristic pore size of the porous medium. However, the relative influence of the viscous force differs among the two samples, which is due to the different permeability of the samples, because the characteristic pore size and the porosity are similar for both samples. Comparing both wicking curves in , CH40/50 shows a higher wicking rate compared with TBA40/0. Despite the similar porosity and pore size, the permeability of CH40/50 is over 30% higher compared to TBA40/0. This implies that the dendritic pore morphology has a higher ability of liquid flow through a porous structure than the prismatic pore morphology.
Table 4. Scaled parameters of EquationEquation (8)(8)
(8) describing wicking.
Generally, it turns out that the sample with the highest viscous resistance has the slowest imbibition rate, while the smallest viscous resistance results in a high imbibition rate. In addition, the samples with the highest influence of gravitation have the biggest change in the slope during wicking (CH20/0). It turns out that the characteristic pore radius has the greatest influence on the wicking behaviour among the investigated parameters.
Furthermore, it can be seen in , that the reduction of a complex porous structure to the three macroscopic parameters is not sufficient to describe the wicking behaviour for all investigated samples. The wicking equation uses the open porosity ϕ, static radius Rs and permeability K to simplify the porous structure to a bundle of straight capillaries [Citation49]. As in depicted, the wicking behaviour can be predicted for the samples TBA40/0, CH20/0 and CH40/50, but it does not apply to CH40/0. The prediction curve, using Kwicking overestimates the wicking behaviour for CH40/0. Possible reasons for the difference between the experimental results and the prediction of the Lucas–Washburn equation with gravity effect for CH40/0 are the lack of connections between the pores in the porous material and slow filling of secondary dendrites. Further studies to enlighten the reason for the peculiar wicking behaviour of CH40/0 are ongoing. The used model, does not take into account the interconnectivity of the pores within a real porous structure and the presence of secondary dendrites. It bases, as mentioned before, on a bundle of straight, not connected capillaries. Therefore, it is not able to predict threedimensional wicking flow.
5. Conclusions
In this study, we investigated the influence of four different pore structures on the isothermal wicking behaviour. Porous polymer-derived ceramic monoliths (SiOC) were prepared by solution-based freeze casting. This process enables to adjust important pore structure-related parameters independently in a wide range and hence allows to study the impact of parameter variations. Furthermore, the effect of different lateral surface conditions on wicking was investigated.
Methylpolysiloxane and (3-aminopropyl)triethoxysilane were used as a precursor and cross-linking agent, respectively. Tert-butyl alcohol or cyclohexane was used as solvents to obtain a prismatic or dendritic pore morphology. Differences in solid loading and the addition of preceramic filler particles change the porosity from 60% to 79% and the mean pore window diameter from 11 μm to 21 μm. A silicon-coated film prevents nucleation on the lateral surface, resulting in a dense lateral surface. The samples with such a dense layer showed 2.3 to 5.9 times lower water flux of the lateral surface compared with an open surface.
To characterize the capillary transport within the samples, vertical wicking experiments were performed using the Washburn-Sorption method. The weight measurement technique was used to obtain the imbibed mass. The permeability was determined by two different approaches: on the one hand from the constant head permeability and on the other hand as a fit from the viscous-dominated part of the wicking experiment. The permeability from the wicking experiment showed a 3 to 39 times higher permeability compared to the permeability obtained by the constant head approach. One potential explanation for this behavior is the presence of inlet losses which are not considered in the permeability determined by wicking. Further, it turns out that the capillary transport in porous media depends on the macroscopic parameters as well as on the pore morphology. The prismatic pore morphology shows a higher imbibition rate compare to a dendritic pore morphology.
In order to predict the wicking experiments, the Lucas–Washburn equation with gravity effect was used. A good agreement between the experimental curves could be found for most of the investigated samples using the permeability obtained from the wicking experiment. Only the CH40/0 sample shows a deviation of the typical Lucas-Washburn behaviour, which can not be predicted by the wicking equation. The reason for such a behaviour could not be clarified ultimately in this work. Reduced connectivity between aligned pore areas and slow filling of secondary dendrites are potential explanations and will be investigated in upcoming studies. Furthermore, CH40/0 also showed an over 20% higher mass increase after removing the closed lateral surface. The encapsulation provides an additional way to change the wicking behaviour in CH40/0 sample, while the removing of the closed lateral surface has no influence for the other samples. It allows to encapsulate these structures without influencing the wicking. Besides avoiding contamination of the structure or the environment the accessibility of the structure can be tailored.
The wicking equation is a simple tool to predict the wicking behaviour in porous structures as long as the porous structure can be assumed as a bundle of straight capillaries. However, it could be shown that the simplification of a real three dimensional porous structure to the macroscopic parameter is not sufficient to accurately describe the wicking behaviour for all investigated samples.
Supplemental Material
Download PDF (377.1 KB)Disclosure statement
No potential conflict of interest was reported by the authors.
Supplementary material
The supplemental data for this article can be accessed here.
Additional information
Funding
References
- Fukasawa T, Ando M, Ohji T. Filtering properties of porous ceramics with unidirectionally aligned pores. J Ceram Soc Jpn. 2002;110(7):627–631.
- Haberman BA, Young JB. Three-dimensional simulation of chemically reacting gas flows in the porous support structure of an integrated-planar solid oxide fuel cell. Int J Heat Mass Tran. 2004;47(17–18):3617–3629.
- Kenarsari SD, Yang D, Jiang G, et al. Review of recent advances in carbon dioxide separation and capture. RSC Adv. 2013;3(45):22739–22773.
- MacDowell N, Florin N, Buchard A, et al. An overview of CO2 capture technologies. Energy Environ Sci. 2010;3(11):1645–1669.
- Woodard JR, Hilldore AJ, Lan SK, et al. The mechanical properties and osteoconductivity of hydroxyapatite bone scaffolds with multi-scale porosity. Biomaterials. 2007;28(1):45–54.
- Xue F, Zhou K, Wu N, et al. Porous SiC ceramics with dendritic pore structures by freeze casting from chemical cross-linked polycarbosilane. Ceram Int. 2018;44(6):6293–6299.
- Heidenreich S. Hot gas filtration – A review. Fuel. 2013;104:83–94.
- Eberhardt RN, Cunnington GR, Johns WA. Conceptual design and analysis of orbital cryogenic liquid storage and supply systems. Denver (CO): Martin Marietta Cooperation Denver Aerospace; 1981.
- Hartwig J. Liquid acquisition devices for advanced in-space cryogenic propulsion systems. Amsterdam (Netherlands): Elsevier Inc.; 2016.
- Fries N, Odic K, Conrath M, et al. The effect of evaporation on the wicking of liquids into a metallic weave. J Colloid Interface Sci. 2008;321(1):118–129.
- Symons EP. Wicking of liquids in screens. Cleveland, USA: NASA Lewis Research Center; 1974.
- Colombo P, Vakifahmetoglu C, Costacurta S. Fabrication of ceramic components with hierarchical porosity. J Mater Sci. 2010;45(20):5425–5455.
- Studart AR, Gonzenbach UT, Tervoort E, et al. Processing routes to macroporous ceramics: a review. J Am Ceram Soc. 2006;89(6):1771–1789.
- Einset EO. Capillary infiltration rates into porous media with applications to silcomp processing. J Am Ceram Soc. 1996;79(2):333–338.
- Kumar S, Kumar A, Shukla A, et al. Capillary infiltration studies of liquids into 3D-stitched C–C preforms. Part A: internal pore characterization by solvent infiltration, mercury porosimetry, and permeability studies. J Eur Ceram Soc. 2009;29(12):2643–2650.
- Kumar S, Kumar A, Devi R, et al. Capillary infiltration studies of liquids into 3D-stitched C–C preforms. Part B: kinetics of silicon infiltration. J Eur Ceram Soc. 2009;29(12):2651–2657.
- Okada K, Uchiyama S, Isobe T, et al. Capillary rise properties of porous mullite ceramics prepared by an extrusion method using organic fibers as the pore former. J Eur Ceram Soc. 2009;29(12):2491–2497.
- Okada K, Imase A, Isobe T, et al. Capillary rise properties of porous geopolymers prepared by an extrusion method using polylactic acid (PLA) fibers as the pore formers. J Eur Ceram Soc. 2011;31(4):461–467.
- Popa C, Okayasu Y, Katsumata K-I, et al. Capillary rise properties of porous mullite ceramics prepared by an extrusion method with various diameters of fiber pore formers. J Mater Sci. 2013 January;48(2):941–947.
- Zhang H, Fidelis CL, Wilhelm M, et al. Macro/mesoporous SiOC ceramics of anisotropic structure for cryogenic engineering. Mater Des. 2017;134:207–217.
- Colombo P, Mera G, Riedel R, et al. Polymer-derived ceramics: 40 years of research and innovation in advanced ceramics. J Am Ceram Soc. 2010;93(7):1805–1837.
- Araki K, Halloran JW. Porous ceramic bodies with interconnected pore channels by a novel freeze casting technique. J Am Ceram Soc. 2005;88(5):1108–1114.
- Deville S. Freeze-casting of porous ceramics: a review of current achievements and issues. Adv Eng Mater. 2008;10(3):155–169.
- Liu R, Xu T, Wang C. A review of fabrication strategies and applications of porous ceramics prepared by freeze-casting method. Ceram Int. 2016;42(2):2907–2925.
- Scotti KL, Dunand DC. Freeze casting - a review of processing, microstructure and properties via the open data repository FreezeCasting.net. Prog Mater Sci. 2018;94:243–305.
- Naviroj M, Miller SM, Colombo P, et al. Directionally aligned macroporous SiOC via freeze casting of preceramic polymers. J Eur Ceram Soc. 2015;35(8):2225–2232.
- Chen R, Wang C-A, Huang Y, et al. Ceramics with special porous structures fabricated by freeze-gelcasting: using tert-butyl alcohol as a template. J Am Ceram Soc. 2007;90(11):3478–3484.
- Chu Y, Lu Z, Li J, et al. Preparation of poly (L-lactic acid) with aligned structures by unidirectional freezing. Polym Adv Technol. 2015;26(6):606–612.
- Yue J, Dong B, Wang H, et al. Porous Si3N4 fabricated by phase separation method using benzoic acid as pore-forming agent. J Am Ceram Soc. 2011;94(7):1989–1991.
- Grebenyuk Y, Zhang HX, Wilhelm M, et al. Wicking into porous polymer-derived ceramic monoliths fabricated by freeze-casting. J Eur Ceram Soc. 2017;37(5):1993–2000.
- Cai J, Yu B. A discussion of the effect of tortuosity on the capillary imbibition in porous media. Transport Porous Med. 2011;89(2):251–263.
- Cai J, Yu B, Zou M. et al. Fractal characterization of spontaneous co-current imbibition in porous media. Energy Fuel. 2010;24(3):1860–1867.
- Schumacher D, Wilhelm M, Rezwan K. Modified solution based freeze casting process of polysiloxanes to adjust pore morphology and surface functions of SiOC monoliths. Mater Des. 2018;160:1295–1304.
- Grebenyuk Y, Dreyer ME. Wicking of liquid nitrogen into superheated porous structures. Cryogenics. 2016;78:27–39.
- Darcy H. Les Fontaines Publiques de la ville de Dijon. Paris (France): Dalmont; 1856.
- Siau JF. Transport processes in wood. Berlin: Springer; 1984.
- Fries N, Dreyer M. An analytic solution of capillary rise restrained by gravity. J Colloid Interf Sci. 2008;320:259–263.
- Deville S, Meille S, Seuba J. A meta-analysis of the mechanical properties of ice-templated ceramics and metals. Sci Technol Adv Mater. 2015;16(4):43501–43516.
- Naviroj M, Voorhees PW, Faber KT. Suspension- and solution-based freeze casting for porous ceramics. J Mater Res. 2017;32(17):3372–3382.
- Yoon B-H, Lee E-J, Kim H-E, et al. Highly aligned porous silicon carbide ceramics by freezing polycarbosilane/camphene solution. J Am Ceram Soc. 2007;90(6):1753–1759.
- Brener E, Muller Krumbhaar H, Temkin D. Structure formation and the morphology diagram of possible structures in two-dimensional diffusional growth. Phys Rev E. 1996;54(3):2714–2722.
- Deville S. Freeze-casting of porous biomaterials: structure, properties and opportunities. Materials. 2010;3(3):1913–1927.
- Lucas R. Ueber das Zeitgesetz des kapillaren Aufstiegs von Fluessigkeiten. Kolloid Z. 1918;23:15–22.
- Washburn EW. The dynamics of capillary flow. Phys Rev. 1921;17(3):273–283.
- Masoodi R, Pillai KM, Varanasi PP. Darcy’s law-based models for liquid absorption in polymer wicks. AlChE J. 2007;53(11):2769–2782.
- Masoodi R, Pillai KM, Varanasi PP, editors. Role of hydraulic and capillary radii in improving the effectiveness of capillary model in wicking. Proceedings of FEDSM2008 2008 ASME Fluids Engineering Conference; 2008; Jacksonville, FL.
- Seuba J, Leloup J, Richaud S, et al. Fabrication of ice-templated tubes by rotational freezing: microstructure, strength, and permeability. J Eur Ceram Soc. 2017;37(6):2423–2429.
- Moon J-W, Hwang H-J, Awano M, et al. Preparation of NiO–YSZ tubular support with radially aligned pore channels. Mater Lett. 2003;57:1428–1434.
- Masoodi R, Pillai KM. Wicking in porous materials. Boca Raton (FL): CRC Press; 2013.