
ABSTRACT
Solid electrolytes with high Mg-ion conductivity are required to develop solid-state Mg-ion batteries. The migration energies of the Mg2+ ions of 5,576 Mg compounds tabulated from the inorganic crystal structure database (ICSD) were evaluated via high-throughput calculations. Among the computational results, we focused on the Mg2+ ion diffusion in Mg0.6Al1.2 Si1.8O6, as this material showed a relatively low migration energy for Mg2+ and was composed solely of ubiquitous elements. Furthermore, first-principles molecular dynamics calculations confirmed a single-phase Mg2+ ion conductor. The bulk material with a single Mg0.6Al1.2Si1.8O6 phase was successfully prepared using the sol-gel method. The relative density of the sample was 81%. AC impedance measurements indicated an electrical conductivity of 1.6 × 10⁻⁶ Scm−1 at 500°C. The activation energy was 1.32 eV, which is comparable to that of monoclinic-type Mg0.5Zr2(PO4)3.
GRAPHICAL ABSTRACT

1. Introduction
Li-ion batteries are widely used in portable electronic devices, such as mobile phones and laptop computers. Recently, electric vehicles have become more widely used, as part of efforts to address environmental and energy issues [Citation1,Citation2]. Therefore, Li-ion batteries are attracting attention as second batteries for these electric vehicles. However, there are two major drawbacks associated with these batteries [Citation3]: (1) their short driving range owing to their low energy density and (2) the risk of ignition owing to the use of flammable electrolytes
The use of Mg-ion batteries is one way of solving the first drawback, because of their large capacity [Citation4]. Mg is divalent and it can carry two electrons, and would thus be expected to double the energy density of Li-ion batteries [Citation5,Citation6]. The second drawback can be overcome by developing all-solid-state batteries using nonflammable solid electrolytes. Solid electrolytes with high Mg-ion conductivities are thus required to develop all solid-state Mg-ion batteries. Several Mg-containing materials have been proposed as candidates for inorganic solid electrolytes [Citation5,Citation7–Citation18]. In addition to the above, a stable supply of elemental resources is needed; Mg is more abundant than Li, and can meet the increasing need for large-scale batteries. Nevertheless, the rather slow diffusivity of Mg2+ ions in oxides significantly lowers their charge–discharge rate performance at room temperature. Spinel-type selenides and sulfides have exhibited sufficiently fast ionic conductivity with Mg2+ [Citation5]. Nevertheless, the use of stable oxides for solid electrolytes would be attractive in terms of abundance and phase stability [Citation19,Citation20], as sulfides are unstable in air [Citation21]. Therefore, it is necessary to find new oxides with fast Mg2+ ion conductivity. In this respect, we recently performed a high-throughput exhaustive search for fast ion conductors via automated material simulations, using the force field technique and percolation theory [Citation22]. We demonstrated the effectiveness of novel high-rate electrodes comprising Na2V3O7 as cathodes for Na-ion batteries [Citation23].
Similarly, in this study, we performed the high-throughput calculations mentioned above for ~ 6,903 Mg-O-containing compounds listed in the inorganic crystal structure database (ICSD) [Citation24] and selected μ-cordierite Mg0.6Al1.2Si1.8O6 [Citation25] as the candidate oxide compound for solid electrolytes. The conductivity of Mg2+ was evaluated through both accurate first-principles molecular dynamics (FPMD) calculations, and experimental alternating current (AC) impedance measurements.
2. Molecular dynamics computations
Migration energies were roughly evaluated for 5,576 samples (blue symbols in ) using the bond valence-based force field (BVFF) [Citation26] potential calculation and percolation algorithm [Citation22]. In detail, the real space voxel division (0.016 Å3) for the lattice was made, and the potential energies of Mg2+ ions at each voxel were computed using the BVFF. The migration energy was determined when the lower-potential voxel had percolated throughout the lattice. Details of the method are described further in the literature [Citation26]. Density-functional-theory-based (DFT) FPMD simulations were performed to investigate diffusion of Mg2+ in Mg0.6Al1.2Si1.8O6 systems. The Vienna ab initio simulation package (VASP) [Citation27–Citation30] was used with the projector augmented-wave (PAW) method [Citation31,Citation32] and a plane-wave basis set. We used a generalized gradient approximation (GGA)-type exchange-correlation function developed by Perdew, Burke, and Ernzernhof, and modified it for solid materials (PBEsol) [Citation33]. The cutoff energy was set to 350 eV and a 1 × 1 × 1 k-point grid (only Γ point) was employed to reduce the computational cost. The time step was set to 1 fs, and our FPMD simulations were carried out in the NVT canonical ensemble using a Nosé thermostat [Citation34], across a temperature range of 1673 to 1973 K, for > 50 ps.
Figure 1. Panel (a) Calculated migration energies of 5,576 inorganic solid-state samples containing both Mg and O, extracted from the inorganic crystal structure dataset (ICSD) [Citation19] using bond valence based force field (BVFF) [Citation21] potential calculations and a percolation algorithm. The red open circle in panel (a) corresponds to Mg0.6Al1.2Si1.8O6 (ICSD #24,898). Panels (b)–(d) show the visualization of the isosurface with various potential energies obtained from BVFF calculations involving Mg0.6Al1.2Si1.8O6. The light-blue polyhedra and orange/white spheres represent (Si/Al)O4 tetrahedra and Mg/vacancies, respectively. Yellow-colored isosurfaces indicate the migration pathways of Mg ions in terms of their potential energy distribution. Note that the migration energy is the difference between the maximum and minimum of the potential energy in the migration pathway
![Figure 1. Panel (a) Calculated migration energies of 5,576 inorganic solid-state samples containing both Mg and O, extracted from the inorganic crystal structure dataset (ICSD) [Citation19] using bond valence based force field (BVFF) [Citation21] potential calculations and a percolation algorithm. The red open circle in panel (a) corresponds to Mg0.6Al1.2Si1.8O6 (ICSD #24,898). Panels (b)–(d) show the visualization of the isosurface with various potential energies obtained from BVFF calculations involving Mg0.6Al1.2Si1.8O6. The light-blue polyhedra and orange/white spheres represent (Si/Al)O4 tetrahedra and Mg/vacancies, respectively. Yellow-colored isosurfaces indicate the migration pathways of Mg ions in terms of their potential energy distribution. Note that the migration energy is the difference between the maximum and minimum of the potential energy in the migration pathway](/cms/asset/d78eec82-c135-4a2f-9566-aeaad39970e4/tsta_a_1730237_f0001_oc.jpg)
3. Experimental measurements
Mg0.6Al1.2Si1.8O6 was synthesized by the sol-gel method [Citation35–Citation39]. Al(NO3)3・9H2O (Wako Pure Chemical Industry), Mg(CH3COO)2・4H2O (Soekawa Chem. Co., Ltd.), and tetraethyl orthosilicate (Sigma – Aldrich Co. LLC.), were used as the starting materials. Stoichiometric amounts of Al(NO3)3・9H2O and Mg(CH3COO)2・4H2O were dissolved in ethylene glycol at room temperature. Then, the stoichiometric amount of tetraethyl orthosilicate was added and the mixture was stirred via ultrasonication. The solution gelled at 55°C. The obtained gel was dried at 100°C. The dried powder was then calcinated at 700°C for 2 h, and was subsequently pelletized under a pressure of 38 MPa. The pellet was sintered at 1000°C for 2 h. The sample size was approximately 8 mm in diameter and 0.8 mm in thickness. The relative density was evaluated from the weight and volume of the sample.
The crystal phase of the sample was characterized via x-ray diffraction (XRD) using a MiniFlex 600 diffractometer (Rigaku, Japan) with Cu-Kα radiation. The micromorphology of the sample was examined using a scanning electron microscope (SEM, JCM-6360LVS, JEOL, Japan). The thermal stability was investigated using thermogravimetric and differential thermal analysis (TG-DTA, EXSTAR 6000; Seiko Instruments Inc, Japan), in a temperature range from room temperature to 1000°C. The ionic conductivity of the bulk sample was measured through AC impedance spectroscopy. Impedance spectroscopy was performed using the sintered pellets. Both faces were polished with 1200-grit abrasive papers and sputtered with gold, so that they could be used as electrodes. The complex impedance was measured using an impedance analyzer (Logic VMP 300; Biologic, France) in the temperature range from 450 to 600°C, at frequencies ranging from 0.1 Hz to 0.5 MHz and a voltage of 1 V, in flowing argon (Ar). To determine the exact ionic conductivity in the AC impedance measurements, DC measurements were also performed.
4. Results and discussion
4.1. Computational results
presents the migration energies of 5,576 samples (blue symbols) determined through BVFF potential calculations and the percolation algorithm [Citation22,Citation26]. Note that ~ 20% of the oxides registered in the database (6,903 samples) were discarded, mainly due to i) the unavailability of force field (FF) parameter sets; and ii) the existence of too short bonds in the lattice, which made the valence state assignment difficult via the bond valence (BV) approach. The experimentally determined crystal structures often contained partially occupied defect sites or splitting sites, resulting in their bonds being too short. Among the 5,576 calculated samples, ~ 24% consisted of only group 2–5 atoms; lanthanides; or Zn, Al, Ga, In, Si, Ge, Sn, P, or S elements, in addition to Mg and O (periods of 7 and later were discarded). These compounds do not contain open-shell transition metal ions, so pure ionic conductivity would be expected. The open red circle in corresponds to the μ-cordierite Mg0.6Al1.2Si1.8O6 compound. This material was chosen as the candidate solid electrolyte for Mg-ion batteries owing to its significantly low migration energy (~ 0.4 eV). Moreover, this compound consists of abundant s- or p-block metallic elements, thus preventing electronic conduction. Panels (b) through (d) display the crystal structure of Mg0.6Al1.2Si1.8O6, and show visualizations of the isosurface with various potential energies obtained from BVFF calculations. As determined earlier [Citation25], this material belongs to the space group P6222. O ions occupy 6 j sites, and Si or Al ions are located at tetrahedral 3 c sites. The SiO4 or AlO4 tetrahedra share their vertices, forming a one-dimensional tunnel along the c axis (Panel (c)). Mg ions occupy 3b sites at the center of the tunnel. However, the migration path indicated in the potential isosurface is a three-dimensional path with a spiral-like network along the c axis. The Mg ions avoided positions at the center of the tunnel along the c axis when the lowest-energy migration path is considered (panels (c) and (d)). However, the energy difference between the site at the center of the tunnel and the lowest-energy migration path was less than 0.5 eV, according to BVFF calculations.
summarizes the FPMD simulation results for the Mg0.6Al1.2Si1.8O6 compound. Panels (a) and (b) display the Mg ion population densities during FPMD simulations at 1978 K. The Mg ions were mainly distributed around the tunnel sites along the c axis, and the intertunnel jump was also visible, as indicated in the BVFF calculations (), Therefore, a three-dimensional diffusion pathway for Mg ions was formed in Mg0.6Al1.2Si1.8O6. Panel (c) displays the mean square displacement (MSD) of all of the elements as a function of the simulation time at 1873 K. The MSD profile of Mg ions shows a linear increase with the simulation time, indicating that the Mg ions hopped among these sites and diffused over the lattice. However, the MSD profiles of Si, Al, and O ions, were constant (< 1 Å2), indicating thermal vibration. The self-diffusion coefficient, D, for Mg was estimated from the slope of the MSD plots, and the estimated self-diffusion coefficients were summarized in the Arrhenius plot in . The activation energy for Mg-ion diffusion was 0.95 eV, which represents from a large deviation from the value obtained via BVFF calculations. The possible reasons for this deviation are (i) ignoring Mg–Mg interactions in the BVFF + percolation approach [Citation22,Citation26], (ii) choosing inappropriate FF parameters, and (iii) temperature differences between the BVFF + percolation approach (0 K) and FPMD calculations (> 1673 K).
Figure 2. Panels (a) and (b) present population density of Mg ions in Mg0.6Al1.2Si1.8O6, derived from 50 ps FPMD calculations. Light- and dark-blue tetrahedra represent SiO4 and AlO4 units, respectively. Yellow-colored isosurface represents population density of Mg ions. Panel (c) shows MSD plots of Mg, Al, Si, and O trajectories in Mg0.6Al1.2Si1.8O6 at 1723 K. Panel (d) presents the temperature-dependent Mg-ion diffusion coefficient in the Arrhenius plot. The calculated activation energy (migration energy) was 0.95 eV
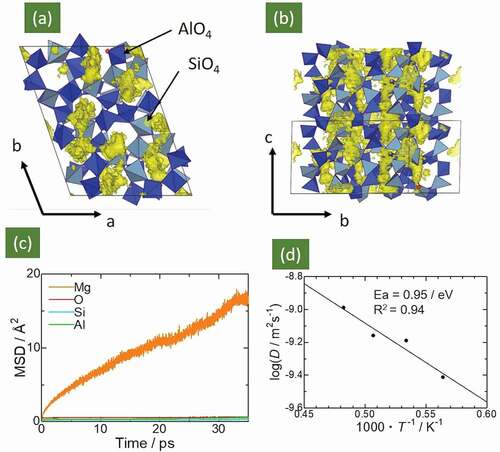
The extrapolated Mg-ion conductivity estimated using the Nernst–Einstein relationship [Citation40] at 500°C was ~ 6 × 10⁻⁵ S cm−1; this value is comparable to the conductivity of Mg0.5Zr2(PO4)3, one of the representative fast Mg-ion conductors (See ).
Table 1. Ionic conductivities of Mg2+ at 500°C in different compounds
4.2.. Crystal phase, microstructure, and thermal stability of the sample
The XRD pattern of the sample calcinated at 700°C for 2 h and subsequently sintered at 1000°C for 2 h is shown in ). The formation of μ-cordierite Mg0.6Al1.2Si1.8O6 [Citation25] (ICSD #24898) was confirmed, alongside a very small amount of the impurity phase of Al4.8Si1.2O9.6 (ICSD #254253). The relative density, i.e. the ratio of the apparent density of the sintered pellet to the density derived from the crystal structure (the true density), was 81%. Though we tried to improve the relative density by increasing the sintering temperature, another phase of cristobalite [ICDD: 01-080-3767] appeared after sintering at 1050°C (50°C above the synthesis temperature).
Figure 3. (a) XRD patterns of the Mg0.6Al1.2Si1.8O6 compound synthesized in this study and patterns obtained from ICSD datasets for comparison. The weak peaks indicated by open circles are ascribed to Al4.8Si1.2O9.6. (b) SEM image of sintered Mg0.6Al1.2Si1.8O6 sample. (c) TG-DTA curves of Mg0.6Al1.2Si1.8O6 compound
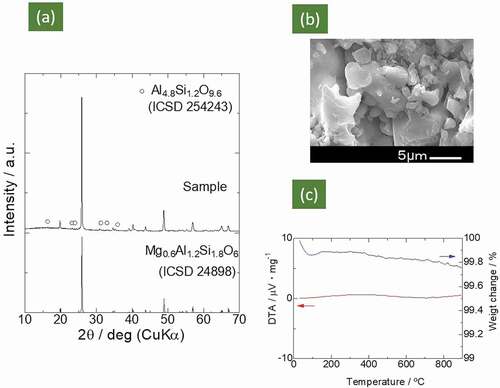
) displays an SEM image of the fractured surface of the Mg0.6Al1.2Si1.8O6 sample sintered at 1000°C. Although there were pores of various sizes in the Mg0.6Al1.2Si1.8O6 sample, most of the particles were tightly connected. Hence, the pellet sintered at 1000°C (81% relative density) was used for the conductivity measurements discussed below. ) displays the TG-DTA curve; no marked change was observed in either weight or heat flow from 100°C to 1000°C (a small decrease in sample weight (~ 0.15% loss) below 100°C could be ascribed to the dehydration of adsorbed water.) Thus, proton contamination or oxygen vacancy formation in the solid state is unlikely, indicating that there would have been no proton or oxide ion conduction.
4.3. AC impedance measurements
The complex AC impedance plot of the Mg0.6Al1.2Si1.8O6 sample tested at 450–600°C is shown in . The electrical resistance was calculated from the intercept on the Z’ axis. Plots in the form of single semicircles were obtained under all measurement conditions from 450 to 600°C, as shown in ). Therefore, we inferred that both the bulk and grain boundary resistances were merged in the semicircle, as the capacitance values determined from these semicircles were ~ 10−10 F, which lies in between both of these resistances. The impedance at the electrolyte | electrode interface was not observed; this may be identified in a lower frequency region than that used in this study. At 600°C, the electrical resistivity and conductivity calculated from the resistance values were 3.6 × 10⁴ Ωcm and 2.8 × 10⁻⁵ Scm−1, respectively. The corresponding DC conductivity was 5.9 × 10⁻⁹ Scm−1 at 600°C, four orders of magnitude lower than the AC conductivity. This indicated that the mobile carriers were ions and not electrons.
Figure 4. (a) Complex AC impedance spectra of Mg0.6Al1.2Si1.8O6 at various temperatures. (b) Arrhenius plots of ionic conductivity
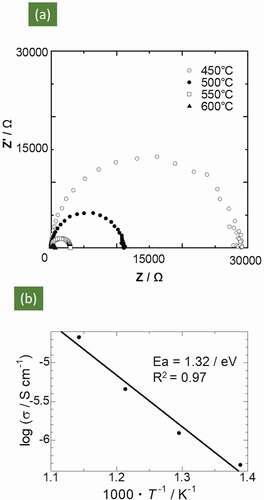
The Arrhenius plot of the ionic conductivity obtained using the AC impedance measurements for the Mg0.6Al1.2Si1.8O6 sample is shown in . A linear relationship is visible, and the evaluated activation energy was 1.32 eV. This result deviates from that obtained via FPMD calculations (0.95 eV). This deviation could be attributed to the contribution of the grain boundary resistance arising from the low relative density, as mentioned above.
4.4. Discussion
summarizes the ionic conductivities of Mg2+ at 500°C in the present Mg0.6Al1.2Si1.8O6 compound (experimental and computational), alongside the representative compounds MgZr4(PO4)6 and Mg0.7 (Zr0.85Nb0.15)4 (PO4)6 for comparison. As mentioned earlier, the experimentally measured resistivity of Mg0.6Al1.2Si1.8O6 likely includes grain boundary resistance, and the ionic conductivity of this material can be increased by improving the sintering density. In addition, the ionic conductivity of Mg0.6Al1.2Si1.8O6 at 500°C was comparable to that of MgZr(PO4)6, which is a known fast Mg-ion conductor. The compositional optimization of Mg0.6Al1.2Si1.8O6, for example by doping or controlling the Mg:Al:Si molar ratio, may significantly improve the conductivity of Mg2+, as observed when Zr was partially replaced with Nb in MgZr4(PO4)6 (see ). Note that the ionic conductivity of Mg0.7 (Zr0.85Nb0.15)4 (PO4)6 was two orders of magnitude higher than that of MgZr4(PO4)6.
Therefore, the high-throughput computational exploration partly succeeded in screening the Mg2+ conductive oxides, though the evaluated migration energies obtained by BVFF calculations deviated significantly from those obtained by DFT-MD studies and experimental observations for Mg0.6Al1.2Si1.8O6. We infer that the present BVFF calculations may systematically overestimate the migration energy, as our previous study for Li ion conductors confirmed systematic overestimation compared to DFT-derived migration energies [Citation23]. The trend of conduction values may be captured even for Mg-O systems, and quantitative improvement is required for the present high-throughput scheme.
Materials knowledge is also useful when searching for Mg ionic conductors, as well as performing a high-throughput exhaustive search. To date, various materials design guidelines have been suggested for developing ion conductors. For example, the selection of anions with high polarizability [Citation5] and/or anion packing structures [Citation41,Citation42] has been discussed. Other factors are related to the migration pathways in terms of changes in local coordination environments [Citation18] or energy landscapes for traveling ions [Citation43]. This well-considered physicochemical knowledge is indeed useful, though some of these guidelines are difficult to apply when screening thousands of compounds. It may be that combining this knowledge with present high-throughput computations, which suffer from deviations from DFT or experimentally observed ion conduction performances, could result in a more robust and rigorous scheme for finding new compounds.
5. Conclusions
High-throughput computational searches for Mg-ion conductors were performed, and their effectiveness was confirmed via FPMD calculations and experimental AC impedance measurements, to discover novel Mg2+ conductors. Mg0.6Al1.2Si1.8O6 with a μ-cordierite structure composed only of abundant elements, was identified as a fast Mg-ion conductor. However, the migration energies determined from the FPMD calculations and AC impedance measurements showed considerable deviation; this could be because of errors in setting the FF parameters or improper assumptions made in the high-throughput algorithm. Nevertheless, the experimentally measured ionic conductivity of Mg was comparable to that of MgZr4(PO4)6, a known fast Mg-ion conductor. Thus, the μ-cordierite Mg0.6Al1.2Si1.8O6 compound may show significant Mg-ion conductivity, after improving its sintering density and/or through composition optimization. This also implies that improving the robustness of the screening algorithm would accelerate the discovery of novel materials with fast ionic conductivity, compared to traditional trial-and-error or intuitive search methods.
Acknowledgments
The present work was partially supported by Advanced Low Carbon Technology Research and Development Program, Specially Promoted Research for Innovative Next Generation Batteries (ALCA-SPRING, No. JPMJAL1301) from Japan Science and Technology Agency (JST), the Grant-in-Aid for Scientific Research (No. 18K19129, No. 18H01707, 19H05815) from the Ministry of Education Culture, Sports, Science and Technology, Japan (MEXT), “Elements Strategy Initiative to Form Core Research Center” from MEXT (No. JPMXP0112101003), and M. N. acknowledges support from the “Materials Research by Information Integration” Initiative (MI2I) project of the “Support Program for Starting Up Innovation Hub” from JST. We also thank the Information Technology Center of Nagoya University for providing computing resources (CX400). English language editing services were provided by Editage (www.editage.com). The crystals structures were drawn using VESTA.
Disclosure Statement
No potential conflict of interest was reported by the authors.
References
- Van Noorden R. The rechargeable revolution: A better battery. Nature. 2014;507(7490):26–28.
- Muldoon J, Bucur CB, Oliver AG, et al. Electrolyte roadblocks to a magnesium rechargeable battery. Energy Environ Sci. 2012;5:5941–5950.
- Srour H, Chancelier L, Bolimowska E, et al. Ionic liquid-based electrolytes for lithium-ion batteries: review of performances of various electrode systems. J Appl Electrochem. 2016;46(2):149–155.
- Novák P, Imhof R, Haas O. Magnesium insertion electrodes for rechargeable nonaqueous batteries— a competitive alternative to lithium? Electrochim Acta. 1999;45(1–2):351–367.
- Canepa P, Bo S-H, Gautam GS, et al. High magnesium mobility in ternary spinel chalcogenides. Nat Commun. 2017;8:1759.
- Nakano K, Noda Y, Tanibata N, et al. Computational investigation of the Mg-ion conductivity and phase stability of MgZr4 (PO4)6. RSC Adv. 2019;9:12590–12595.
- Higashi S, Miwa K, Aoki M, et al. A novel inorganic solid state ion conductor for rechargeable Mg batteries. Chem Commun. 2014;50:1320–1322.
- Tamura S, Yamane M, Hoshino Y, et al. Highly conducting divalent Mg2+ cation solid electrolytes with well-ordered three-dimensional network structure. J Solid State Chem. 2016;235:7–11.
- Imanaka N, Okazaki Y, Adachi G. Optimization of divalent magnesium ion conduction in phosphate based polycrystalline solid electrolytes. Ionics. 2001;7(4–6):440–446.
- Nomura K, Ikeda S, Ito K, et al. Framework structure, phase transition, and transport properties in M II Zr 4 (PO 4) 6 compounds (M II = Mg, Ca, Sr, Ba, Mn, Co, Ni, Zn, Cd, and Pb). Bull Chem Soc Jpn. 1992;65(12):3221–3227.
- Imanaka N, Okazaki Y, Adachi G. Divalent magnesium ionic conduction in Mg 1-2x(Zr 1-xNb x) 4P 6O 24 (x = 0-0.4) solid solutions. Electrochem Solid-State Lett. 2000;3(7):327–329.
- Ikeda S, Takahashi M, Ishikawa J, et al. Solid electrolytes with multivalent cation conduction. 1. Conducting species in MgZrPO4 system. Solid State Ion. 1987;23(1–2):125–129.
- Imanaka N, Okazaki Y, Adachi GY. Divalent magnesium ion conducting characteristics in phosphate based solid electrolyte composites. J Mater Chem. 2000;10:1431–1435.
- Kajihara K, Nagano H, Tsujita T, et al. High-temperature conductivity measurements of magnesium-ion-conducting solid oxide Mg0.5-x(Zr1-xNbx)2(PO4)3 (x = 0.15) using Mg metal electrodes. J Electrochem Soc. 2017;164(9):A2183–A2185.
- Omote A, Yotsuhashi S, Zenitani Y, et al. High ion conductivity in MgHf(WO4)3 solids with ordered structure: 1-D alignments of Mg2+ and Hf4+ ions. J Am Ceram Soc. 2011;94(8):2285–2288.
- Anuar NK, Adnan SBRS, Mohamed NS. Characterization of Mg0.5 Zr2(PO4)3 for potential use as electrolyte in solid state magnesium batteries. Ceram Int. 2014;40(8): 13719–1372.
- Takahashi H, Takamura H. Preparation and ionic conductivity of Al-doped Mg0.5 Ti2 (PO4)3. Mater Trans. 2012;53(5):932–935.
- Rong Z, Malik R, Canepa P, et al. Materials design rules for multivalent ion mobility in intercalation structures. Chem Mater. 2015;27:6016–6021.
- Hosono H, Hayashi K, Kamiya T, et al. New functionalities in abundant element oxides: ubiquitous element strategy. Sci Technol Adv Mater. 2011;12:034303.
- Hans Wedepohl K. The composition of the continental crust Geochim. Cosmochim Acta. 1995;59:1217–1232.
- Muramatsu H, Hayashi A, Ohtomo T, et al. Structural change of Li2S-P2S5 sulfide solid electrolytes in the atmosphere. Solid State Ion. 2011;182:116–119.
- Nakayama M, Kimura M, Jalem R, et al. Efficient automatic screening for Li ion conductive inorganic oxides with bond valence pathway models and percolation algorithm. Jpn J Appl Phys. 2016;55(1S):01AH05.
- Tanibata N, Kondo Y, Yamada S, et al. Nanotube-structured Na2V3O7 as a cathode material for sodium-ion batteries with high-rate and stable cycle performances. Sci Rep. 2018;8:17199.
- ICSD. [ cited 2019 Oct 23]. Available from: https://icsd.fiz-karlsruhe.de/index.xhtml;jsessionid=79DFDEC6992BDEBD008E0187605997D6
- Schilz H, Hoffmann W, Muchow GM. The average structure of Mg[Al2Si3O10], a stuffed derivative of the high-quartz structure. Z Kristallogr Cryst Mater. 1971;134(8):1–27.
- Adams S, Rao RP. High power lithium ion battery materials by computational design. Phys Status Solidi Appl Mater Sci. 2011;208(8):1746–1753.
- Kresse G, Hafner J. Ab initio molecular dynamics for liquid metals. Phys Rev B. 1993;47(1):558–561.
- Kresse G, Furthmüller J. Efficient iterative schemes for ab initio total-energy calculations using a plane-wave basis set. Phys Rev B - Condens Matter Mater Phys. 1996;54(16):11169–11186.
- Kresse G, Hafner J. Ab initio molecular-dynamics simulation of the liquid-metalamorphous- semiconductor transition in germanium. Phys Rev B. 1994;49(20):14251–14269.
- Kresse G, Furthmüller J. Efficiency of ab-initio total energy calculations for metals and semiconductors using a plane-wave basis set. Comput Mater Sci. 1996;6(1):15–50.
- Joubert D. From ultrasoft pseudopotentials to the projector augmented-wave method. Phys Rev B - Condens Matter Mater Phys. 1999;59(3):1758–1775.
- Blöchl PE. Projector augmented-wave method. Phys Rev B. 1994;50(24):17953–17979.
- Perdew JP, Ruszsinszky A, Csonka GI, et al. Generalized gradient approximation for solids and their surfaces. Phys Rev Lett. 2007;100:136406.
- Nosé S. A unified formulation of the constant temperature molecular dynamics methods. J Chem Phys. 1984;81(1):511–519.
- Tkalcec E, Popovic J, Grzeta B et al. Crystallization studies of cordierite originated from sol-gel precursors. Proceedings of the 10th International Conference of the European Ceramic Society; 2007. p. 275–279.
- Kikuchi N, Sei T, Tsuchiya T, et al. Preparation of cordierite ceramics by the sol-gel process and their properties. J Ceram Soc Jpn. 1993;101(1175):802–807.
- Yuan Q, Zhang PX, Gao L, et al. MgO-Al2O3-SiO2 glass-ceramic prepared by sol-gel method. Adv Mat Res. 2010;92:131–137.
- Petrović R, Janaćković D, Zec S, et al. Crystallization behavior of alkoxy-derived cordierite gels. J Sol-Gel Sci Technol. 2003;28(1):111–118.
- Shi ZM, Liang KM, Zhang Q, et al. Effect of cerium addition on phase transformation and microstructure of cordierite ceramics prepared by sol-gel method. J Mater Sci. 2001;36(21):5227–5230.
- Jalem R, Yamamoto Y, Shiiba H, et al. Concerted migration mechanism in the Li ion dynamics of garnet-type Li7La3Zr2O12. Chem Mater. 2013;25(3):425–430.
- Wang Y, Richards WD, Ong SP, et al. Design principles for solid-state lithium superionic conductors. Nat Mater. 2015;14:1026–1031.
- Chen T, Sai Gautam G, Canepa P. Ionic transport in potential coating materials for Mg batteries. Chem Mater. 2019;31:8087–8099.
- He X, Zhu Y, Mo Y. Origin of fast ion diffusion in super-ionic conductors. Nat Commun. 2017;8:15893.