
 ?Mathematical formulae have been encoded as MathML and are displayed in this HTML version using MathJax in order to improve their display. Uncheck the box to turn MathJax off. This feature requires Javascript. Click on a formula to zoom.
ABSTRACT
We propose a new theoretical kinetic model of strength recovery by oxidation-induced self-healing of surface cracks in composites containing a healing agent (HA). The kinetics is a key parameter in the design of structural components that can self-heal the damage done in service. Based on three-dimensional (3D) observations of crack-gap filling, two crack-gap filling models, i.e., a bridging model and a tip-to-mouth filling model, are incorporated in the proposed kinetic model. These crack-gap filling models account for the microstructural features of the fracture surfaces, crack geometry, and oxidation kinetics of the healing-agent. Hence, the minimum and maximum remaining flaw sizes in the healed crack gaps are estimated for various healing temperatures, times, and oxygen partial pressure conditions. Further, the nonlinear elastic fracture mechanics suitable for small-sized remaining flaws, together with a statistical analysis of the original Weibull-type strength distribution, enables the prediction of upper and lower strength limits of the healed composites. Three sintered alumina matrix composites containing silicon carbide (SiC)-type HAs with various volume fractions and shapes, together with monolithic SiC ceramics, are considered. The strength of the healed-composite predicted by our model agrees well with the experimental values. This theoretical approach can be applied to HAs other than SiC and enables the design of self-healing ceramic components for various applications.
Graphical Abstract

1. Introduction
To employ structural ceramics in high-temperature components with high-level safety requirements, e.g., turbine blades in aircraft engines, the self-healing of surface cracks through the oxidation of a pre-incorporated healing agent (HA) is essential [Citation1–Citation3]. Such advanced functionality fully exploits the advantages of structural ceramics (i.e., low weight and high resistance to heat and oxidation) [Citation4–Citation8], thus yielding significant improvements in the fuel efficiency and CO2 emissions of aircraft engines [Citation1].
Recently, many researchers have attempted to mimic bone healing in structural materials [Citation1–Citation3,Citation9-Citation32] such as polymers [Citation11,Citation12], concrete [Citation13], and ceramics [Citation1–Citation3,Citation14-Citation34]. In high-temperature structural ceramics, self-healing is often achieved through high-temperature oxidation reactions or oxidation reactions that exploit the application environment. Thus, a non-oxide ceramic with high strength and high oxidizability in the application environment (i.e., a HA), is compounded into the oxide ceramic matrix. The non-oxide HA is protected from oxidation by the oxide ceramic matrix until damage occurs; this damage exposes the HA to high temperatures or the ambient atmosphere, thus triggering an oxidation reaction that fills and bonds the damaged surface to yield complete, autonomous recovery. This strategy has been implemented using miniaturized silicon carbide (SiC) [Citation1–Citation3,Citation14-Citation23], titanium carbide (TiC) [Citation24,Citation25], intermetallic compounds (TiSi2 and MoSi2) [Citation26,Citation27], more recently, compounded MAX phases [Citation28–Citation32], and metals [Citation33,Citation34]. If cracks on the component surface (e.g., from catastrophic foreign-object damage (FOD) [Citation35]) can be completely healed within a short time, the self-healing function becomes key to securing reliable next-generation ceramic turbine blades and vanes [Citation1].
Use of this outstanding function necessitates a dramatic revision of the strategy for conventional material development, which is based on initial performance optimization. To design a self-healing function, it is essential to optimize the kinetics of strength recovery due to fracture gap-filling by the oxide newly formed from the HA. This design concept is based on the damage management paradigm in service, rather than damage prevention through initial performance optimization [Citation9], thereby generating new difficulties for material design.
The main approach for developing conventional engineering materials is the optimization of initial compositions and microstructures as well as the resulting initial performance (e.g., stiffness, yield strength, tensile strength), along with constructing databases of subsequent degradation properties (fatigue and creep). Even the most recent high-temperature materials were originally introduced in the 1940s, such as Ni-based superalloys [Citation36–Citation39] for turbine applications but these have since been gradually improved for new applications through a trial-and-error strategy. Recent advances in computing techniques will help predict or optimize initial performance in future research. However, even predicting and optimizing the yield strength [Citation40–Citation42] of advanced alloys incorporating complicated microstructures remains challenging [Citation43]. Thus, a method for predicting the initial performance and performance recovery kinetics under complicated service conditions is necessary for the development, optimization, and safe use of self-healing materials. In particular, strength recovery kinetics that include the effect of healing conditions (e.g., temperature, time, and oxygen partial pressure), which vary dramatically with the application environment, e.g., flight schedule, will shorten the optimization period for new products and help determine allowable operation conditions for self-healing components.
This study proposes a theoretical kinetic model to describe autonomous strength recovery induced by a self-healing reaction, which results from crack-gap filling in a ceramic matrix composite containing various amounts and types of HA. Two crack-gap filling models are proposed: the bridging model and tip-to-mouth filling model. The microstructural features on the fracture surface, crack geometry, and healing-agent oxidation kinetics are incorporated in the kinetic model. The filling models are based on three-dimensional (3D) crack-gap filling observations, primarily of an alumina matrix composite containing 30-vol.% SiC HA [Citation1]. Further, data reported for alumina/15-vol.% SiC particles [Citation19,Citation20] and alumina/30-vol.% SiC whiskers with a higher aspect ratio of length and diameter [Citation21] are reanalyzed.
2. Modeling self-healing kinetics
2.1 Crack-gap filling model
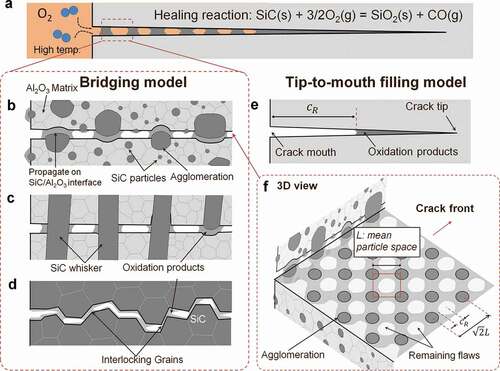
The strength of cracked ceramics is recovered through the oxidation-induced self-healing of these cracks, wherein the crack gap is filled by oxidation products formed from a non-oxide HA (). Modeling the shrinkage behavior of the largest crack is particularly important because brittle-ceramic strength is mainly determined by the largest existing flaw and follows the weakest-link model.
Figure 1. Schematic illustrations for oxidation-induced crack-gap filling models in self-healing composites. (a) Macroscopic crack-gap filling behavior for self-healing ceramics, (b-c) bridging model: microscopic filling behavior near the crack mouth with large crack opening displacement, (b) for SiC particles composite, (c) SiC whiskers composite, and (d) monolithic SiC ceramics. (e) Tip-to-mouth filling model. (f) 3D structure of remaining cracks in the bridging model. The actual fracture will be described by the mixed models shown above. Thus, the bridging model and tip-to-mouth filling model correspond to the upper and lower limit strengths of the healed ceramics, respectively.
To date, many types of HA-oxidation-induced healing reactions have been proposed for oxidation-induced self-healing ceramics. A few empirical and theoretical crack-gap filling models have been proposed for SiC [Citation19], Nb2AlC [Citation32], and Ti [Citation33] agents. Here, we consider SiC-containing self-healing ceramics as an example. The strength is recovered through a volume gain Vh through the passive oxidation of SiC [Citation2,Citation19]:
The general HA reaction is formalized as
where HP means the healing product; ,
, and ni are the mole numbers of oxygen, CO gas, and the employed HPs, respectively; and i is the HP number. The proposed HAs can mainly be categorized as carbide (SiC [Citation14–Citation23], TiC [Citation24,Citation25], and MAX phase [Citation24,Citation28]) or intermetallic (TiSi2 [Citation26] and MoSi2 [Citation27]). For a carbide-type HA only, the above reaction forms CO gas.
Gap filling follows the Vh induced by the above reaction. The filling ratio Rf is defined as
where Vg is the crack-gap volume and depends on the crack initiation and growth mechanism under the service conditions. Considerable experimental research has been conducted on self-healing of cracks introduced via the Vickers indentation method, which mimics actual crack initiation. The Vg values for Vickers indentation crack are discussed in Section 4.3.
2.2 Volume-gain kinetics on fracture surfaces
We attempt to model the general Vh kinetics for various types of HP using the oxidation properties of monolithic HA. The general form of the isothermal weight gain is
where kp is a rate constant, is the oxidation time (holding time), and n indicates the rate-controlling oxidation mechanism (n = 1, 2 for reaction-, diffusion-controlled weight gain, respectively). For SiC oxidation, n = 2 has been reported [Citation44–Citation46], following Wagner’s parabolic weight gain model:
. Here, we assume that
from the oxidation of the fracture surfaces of SiC () also follows Wagner’s model. Furthermore, the temperature dependence of kp follows an Arrhenius-type equation:
where is the holding temperature;
and Qox are the frequency factor and activation energy for HA oxidation, respectively, and R is the gas constant (8.314 J mol–1 K–1). For our calculations, we used
= 7.85 × 10⁻⁷ kg2 m−4 s−4 and Qox = 161 kJ mol–1 (reported for a small amount of alumina containing sintered SiC [Citation46]) because additives significantly activate a healing reaction and increase the
rate [Citation1].
Further, the influence of the oxygen partial pressure on kp to model the self-healing kinetics in a combustion gas atmosphere must be considered [Citation19]. The influence of
on the kp value for SiC ceramics can be expressed as follows [Citation44,Citation45]:
where is the standard oxygen partial pressure, and m is a temperature-independent constant. Goto et al. have reported m = 0.08–0.13 and 0.37–0.53 for O2–Ar and CO2–Ar atmospheres, respectively [Citation44,Citation45]. Further, we have reported m = 0.835 for self-healing in N2–O2 mixed gas [Citation19]; the latter value was used in our calculations.
During the self-healing reaction, only the free surface of the unreacted HA on the fracture surfaces expands in volume (). The actual HA reactive area varies depending on the HA volume fraction fv and the crack path. Assuming that the area fraction of reactive HA on the fracture surface is equal to fv, the reactive area fraction Ā is given by
where A is the area of one side of the fracture surface, and fe is the effective reactive area ratio for fracture-path modeling ()), varying within 0.5–1.0. In detail, fe can be estimated from the dome-like and splitting crack modes [Citation47]. In our model, for simplification, fe is 1.0 when the crack propagates within the HA particle. This value is also used for monolithic ceramics exclusively composed of HA, such as SiC ceramics (fv = 1). Furthermore, fe is roughly determined to be 0.5 when the crack propagates along the HA–matrix interface, because the particles are located on one side of the fracture surface ()). Further, the crack propagation path mainly depends on the differences in stiffness, strength, and toughness between the HA and matrix and can also be calculated using finite element analysis (FEA) [Citation48]. In this study, fe was determined based on microstructural observations, as described in section 4.2. We used fe = 0.5 for composites of SiC particles and whiskers, and 1.0 for monolithic SiC.
The weight gain per unit volume gain ∆ρ varies with the HA. For SiC oxidation (EquationEquation 1(1)
(1) ),
where and
are the molar masses and
and
are the densities of SiO2 and SiC, respectively. For our calculations, we used
= 60.09 g mol–1,
= 40.1 g mol–1, and
= 3210 kg m–2. The value of
depends on the HP structure (crystalline or amorphous). Here,
= 2320 kg m–2 for ∆-cristobalite was used, based on experimental observations [Citation1]. The general formula for
is
where and
are the molar mass and density of the ith HP, respectively, and
and
are the molar mass and density of the HA, respectively.
Using EquationEquations (4)(4)
(4) and (Equation6
(6)
(6) –Equation8
(8)
(8) ), the Vh during isothermal oxidation is given by
Thus, we can estimate Vh from the service conditions (TH, , and tH) for various types of self-healing ceramic composites (i.e., with different fV, ∆ρ, kpo, and Qox) for a given crack geometry (A).
Considering the application of self-healing to actual components, e.g., aircraft-engine turbine blades, T and are expected to vary dramatically depending on the flight schedule and air-fuel combustion conditions [Citation49,Citation50]. Thus, Vh must be determined for various complex heating and cooling schedules.
Kinetic models are typically presented as systems of differential equations. Thus, we convert EquationEquation (10)(10)
(10) to the following differential equation:
where and kP are the volume gain rate and rate constant at the temperature at a given time, respectively. The initial volume gain
is given by
where ∆t is a time interval. Using EquationEquations (11(11)
(11) ) and (Equation12
(12)
(12) ), the total Vh under both isothermal and non-isothermal oxidations can be estimated, as implemented in our calculations. EquationEquation (11)
(11)
(11) will be useful in future computational simulations for describing damage and healing behaviors, e.g., using the finite element method [Citation51–Citation54].
2.3 Strength recovery kinetics
To model strength recovery, it is important to describe fracture from the flaws remaining in an inadequately healed crack gap (), along with the transition of the fracture initiation site. Brittle ceramics generally fracture from the most severe flaw in hierarchically distributed flaws, such as surface cracks, embedded flaws, grain boundaries, and point defects, in accordance with the weakest-link model. Meanwhile, the filling ratio Rf (see EquationEquation 3)(3)
(3) is an important parameter for categorizing the most severe flaws in healed ceramics. When Rf ≥ 1 (the crack gap is fully filled by HPs), the strength is fully recovered. Hence, the most severe flaws (acting as fracture initiation sites) revert to the original pre-existing flaws rather than surface cracks. However, when Rf < 1 (the crack gap is not fully filled by HPs), the fracture model can be further categorized into two mechanisms because of the wide distribution of the original strength. When the remaining flaw size is smaller than the largest pre-existing flaw, even with Rf < 1, the strength should recover to the original strength distribution range. However, when the remaining flaw size is larger than the largest pre-existing flaw and Rf < 1, the strength recovery is expected to be inadequate. In that case, fractures initiate from the remaining flaw.
2.3.1 Nonlinear elastic fracture mechanics
Brittle ceramics fractures generally follow nonlinear elastic fracture mechanics (NLEFM). Fractures from the small remaining flaws in an inadequately healed crack gap (Rf < 1; )) usually do not satisfy the small-scale requirement allowing application of classical linear elastic fracture mechanics (LEFM). That is, , where KIC is the fracture toughness, σf is the cracked-specimen strength, and ae is the equivalent flaw size. For a commonly applicable technique, a two-parameter fracture model for describing nonlinear fracture behavior as two different linear mechanisms has been proposed [Citation55], in which the fracture is governed by the strength σo or fracture toughness KIC when the flaw is small (large-scale yielding) or large (small-scale yielding), respectively. In this study, we used the NLEFM for cracked ceramics can be well described using the criteria of the critical-process-zone size Dc proposed by Ando et al. [Citation17,Citation56]. Assuming that the Dc values for small- and large-scale yielding are equal at the fracture point,
where σo is the strength of the flawless specimen. Here, ae can be converted from the crack half-length c, using ae = F2 c, where F is a dimensionless shape parameter. The nonlinear behavior of the cracked-ceramic strength can be estimated as a function of flaw size using two parameters (σo and KIC), such that
Thus, to model the strength recovery, the healing time and temperature dependence of c and F of small remaining flaws must be estimated. We used σo corresponding to 99.9% failure probability in the Weibull plot as the upper strength limit σoU. We assumed that those values corresponded to the strength of a specimen with no surface cracks or embedded flaws such as pores.
2.3.2 Shrinkage kinetics of remaining flaw size
It would be very difficult to determine the exact values of the size and shape parameters from the complex filling behavior of the 3D crack gap ()) or to estimate the strength. For simplicity, we propose two crack-gap filling models: the bridging model () and the tip-to-mouth filling model ()). Using the former and latter models, the remaining flaw size can be estimated as the minimum and maximum sizes yielding the upper σfU and lower σfL bending strength limits of the healed ceramics, respectively. Upper and lower strength limits will be useful for design for self-healing ceramics and their components, although the experimental strength will be described by mixed model of two crack-gap filling models.
Regarding the bridging model, oxidation products can partially bond crack surfaces (). The half-length of the remaining flaws cR depends on the particle spacing between the SiC ()). The mean particle spacing can be estimated from Ref [Citation38] to be
where d is the average diameter of SiC powder. However, the bridging across crack gap will result from the relatively large SiC agglomeration (will be discussed in section 4.2). Thus, the size evolution of cR can be estimated as follows:
where M is the agglomeration magnitude factor. Thus, the ‘’ term on the right-hand side indicates the diagonal line length ()), where L is the distance between agglomerated SiC particles. We used M = 10 and 1, and d = 0.27 and 1.0 μm, for composites containing SiC particles [Citation1] and composites containing SiC whiskers [Citation2], respectively.
The bridging model is also useful for estimating cR in monolithic SiC ceramics. In SiC ceramics, partial bonding mainly occurs at the bridging parts of interlocking grains ()). However, we did not estimate cR for SiC in this study, because the interlocking grain separation distance is unknown. Furthermore, multiple remaining flaws are distributed two-dimensionally on the healed crack ()). To estimate F, we assumed that the maximum stress intensity factor for the distributed remaining flaws follows the proposed model for periodical collinear multiple cracks in an infinite plate [Citation57]. Thus, for the bridging model, .
For the tip-to-mouth filling model, we assumed that oxidation products fill the crack from the crack tip ()). Assuming that the crack opening displacement linearly increases from tip to mouth, the size evolution of cR can be estimated from c as follows:
Generally, F does not vary significantly with Rf based on this model, as the crack shape does not change during the self-healing. For a semi-elliptical surface crack, F = 0.72 can be calculated using the Newman–Raju equation [Citation58]. The F values for other types of cracks and loading conditions can be found in the Stress Intensity Factor Handbook [Citation59]. The F values for Vickers indentation crack are also discussed in section 4.4.
2.3.3 Minimum healing time for full strength recovery
The σfU and σfL of healed ceramics can be predicted from EquationEquation (14)(14)
(14) by substituting the cR and F values from the bridging and tip-to-mouth filling models, respectively. When Rf ≥ 1 and cR = 0, both σfU and σfL reach σoU. Thus, the upper limit of the minimum healing time for full strength recovery tHMin can be estimated as the time when Rf = 1, corresponding to Vh = Vg. The upper value of tHMin is one of the most important capability indicators for self-healing ceramics. For isothermal oxidation,
tHMin is a function of Vh and Vg, indicating that the upper value of tHMin may be independent of the temperature dependence of σoU and KIC.
When Rf < 1, the fracture model can be further categorized into two mechanisms because of the wide original strength distribution. For simplicity, we define the strength corresponding to 5% failure probability in the Weibull plot as the lowest original strength σoL (later discussed in detail in section 4.1). When the estimated σfL ≥ σoL, even when Rf < 1, the strength should recover to the original strength distribution range. In other words, when Rf < 1 and σfL = σoL, the healed specimens are expected to fracture from sites other than the surface cracks with a probability of >5%. Thus, tHMin varies between times satisfying Rf = 1 and Rf < 1 with σfL = σoL, termed the upper and lower tHMin, respectively, in this study. This also means that the lower tHMin depends on σoL.
3. Experimental
Alumina matrix composites containing 15-vol% SiC particles (AS15P) [Citation2,Citation19,Citation20], 30-vol.% SiC particles (AS30P) [Citation1], 30-vol% SiC whiskers (AS30 W) [Citation2,Citation21], and commercial monolithic SiC (SC-211; Kyocera Co. Ltd [Citation60].) were used. The preparation of composites and damage-healed tests is described in detail in Refs. [Citation1,Citation2,Citation19–Citation21]. The raw powders used were Al2O3 powder (average diameter 0.5 μm, 99.99% pure, AKP-50; Sumitomo Chemicals, Japan), SiC powder (average diameter 0.27 μm, Ultrafine; Ibiden, Ogaki, Japan), and SiC whiskers (length 30–100 μm, diameter 0.8–1.0 μm, Tateho Chemical Industry, Ako, Japan). Sintering conditions and relative density of sintered plates are summarized in [Citation1,Citation2,Citation20,Citation21]. Sintered plates were cut into 3 mm × 4 mm × 22 mm rectangular bar specimens, which were polished to a mirror finish. A semi-elliptical surface pre-crack with a length of 50–600 μm and an aspect ratio of 0.9 was introduced at the center of each specimen surface through Vickers indentation. The pre-crack was healed at 973–1573 K for 1 min to 1000 h in air. Healed specimens were analyzed by performing three-point bending tests at room temperature over a span length of 16 mm.
Table 1. Sintering conditions and relative density of self-healing ceramics containing various SiC healing agents.
To characterize 3D crack-gap filling, the 3D structure of a healed crack in AS30P was analyzed using an orthogonally arranged focused ion beam-scanning electron microscopy system (FIB-SEM, Hitachi High-Tech Science Corp., Japan; SMF-1000). Briefly, healed surfaces near the indentation tip were ion-milled with 10-nm slice step size using a Ga+ beam at an acceleration voltage of 30 kV. At each cross-section, 1,000 images with dimensions of 10 μm × 10 μm were collected using an electron beam at an acceleration voltage of 10 kV. Subsequently, these images were used to reconstruct a 3D volume using ImgToVol (Cybernet Systems Co., Ltd), MicroAVS 19.0 (Cybernet Systems Co., Ltd), and ImageJ (NIH, Bethesda, MD, USA).
4. Results
4.1 Damage and strength recovery behavior
AS30P can completely heal a surface crack with an ~110-μm surface length introduced by Vickers indentation at tHMin values of 10 min, 5 h, 100 h, and 1000 h at 1573, 1473, 1373, and 1273 K, respectively ()), thus fully recovering the original strength from the damaged strength. Further, the fracture initiation site shifts from the surface crack back to the pre-existing embedded flaw (i.e., in the original specimens), which provides clear evidence of complete crack-healing. However, tHMin at 1273 K of 1000 h is impractical for healing in service.
Figure 2. Experimental damage and healing behavior. Recovery behavior of three-point bending strength for (a) AS30P and (b) monolithic SiC. (c) Weibull plots for complete crack-healed specimens for AS30P and monolithic SiC together with AS15P [Citation20] and AS30 W [Citation21]. Red, blue, green, black, and orange circles indicate specimens self-healed at 1573, 1473, 1373, 1273, and 1073 K, respectively, for various healing times longer than tHMin. In addition, red squares indicate the original strength.
![Figure 2. Experimental damage and healing behavior. Recovery behavior of three-point bending strength for (a) AS30P and (b) monolithic SiC. (c) Weibull plots for complete crack-healed specimens for AS30P and monolithic SiC together with AS15P [Citation20] and AS30 W [Citation21]. Red, blue, green, black, and orange circles indicate specimens self-healed at 1573, 1473, 1373, 1273, and 1073 K, respectively, for various healing times longer than tHMin. In addition, red squares indicate the original strength.](/cms/asset/c5f6228e-0a44-4431-99d3-13db1657df69/tsta_a_1796468_f0002_oc.jpg)
Monolithic SiC can fully heal a surface crack with a length of ~100 μm ()), although long-term high-temperature heating induces severe surface oxidation and degrades the original strength. Even at temperatures below 1273 K, sufficient strength recovery can be achieved, faster than that for AS30P. This implies that the SiC HA volume fraction is a major factor determining the strength recovery rate. Further, the strength can be completely recovered above TH = 1073 and 1273 K for 10 and 1 h, respectively. In most healed specimens, fractures form at sites other than pre-cracks above these temperatures. Hence, tHMin for SiC is <1 and <10 h at 1073 and 1273 K, respectively.
To determine which pre-existing flaws and healed cracks correspond to the most severe flaw, a statistical failure analysis is required, as mentioned in Section 2.3. Here, all specimens completely healed to their original strengths at various temperatures and times, and the original strengths for all specimens exhibited good agreement with the two-parameter Weibull distribution ()) because all specimens fractured from the largest pre-existing embedded flaw. Therefore, all specimens fractured in the same manner independent of TH. Further, from a statistical perspective, the cracked specimens returned to the original specimen forms without surface flaws. The obtained Weibull modulus α and scale parameter ∆ values for AS30P [Citation1,Citation21], AS30 W [Citation21], and AS15P [Citation20] are listed along with reported values in . Further, the σoU and σoL values for specimens without surface flaws were defined for use in our calculations and are listed in . These values can be estimated using recent FEA based on the distributions of the pore size and grain size under various stress conditions [Citation52].
Table 2. Weibull parameters, scale parameters, and estimated upper and lower limits of strength for self-healing ceramics containing various SiC healing agents.
4.2 3D crack-gap filling
In order to validate our proposed filling model (), we analyzed the initial microstructure and the 3D structure of the damaged site close to the crack mouth for AS30P (). In the initial microstructure, both the small SiC particles and large agglomerate SiC were found (see )). The average size of the distributed SiC particles was 1.02 μm (see )). Further, a Vickers crack mainly propagated along the interface between the alumina and agglomerated SiC. In the early stage of healing at 1473 K for 1 h, corresponding to 50% strength recovery, many large flaws remained. Meanwhile, the agglomerated SiC had been partially bonded or bridged the crack surfaces ()), although the amount of healing oxide was insufficient (Rf < 1). In accordance with EquationEquation (15)(15)
(15) , the diagonal line length between agglomerated SiC could be calculated to be 2.52 μm by inputting M = 10 and d = 0.27. Meanwhile, the length between all SiC particles could be calculated to be 0.95 μm by inputting M = 3.77 obtained from 1.02 μm in ). From the 3D structure of the remaining flaw size ()), it can be seen that distance of bridging parts is more close to diagonal line length between agglomerated SiC than that of all SiC particles.
Figure 3. Initial microstructure (a and b) and three-dimensional behaviors of HP filling in the crack gaps in self-healed AS30P (c-f). 3D image reconstructed from 500 images from orthogonally arranged FIB-SEM images and top-view images of a healed crack close to the indenting tip in AS30P healed at 1473 K (c) and (e) for 1 h and (d) and (f) for 50 h, respectively.
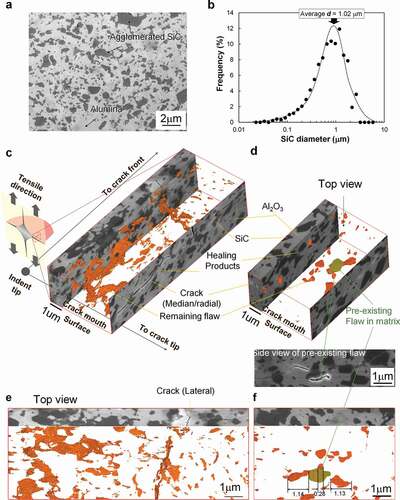
Further, the flaw became smaller towards the tip of the indentation crack. The spacing between the remaining flaws also became smaller from the tip to the mouth ()). Thus, the F values estimated for the collinear multiple cracks at the crack mouth may be significantly large [Citation57], although estimating accurate F values for complex geometries is difficult. In this case, we expect that the bridging parts easily were broken during loading, and the final fracture strength and remaining flaw size were mainly determined by the tip-to-mouth filling model. It is important to note that, even in this case, the experimental strength should be determined by a mixed mode of two filling models. However, experimental strength is expected to be very close or above of value estimated from tip-to-mouth filling model (see section 5.2).
For a specimen healed at the same temperature of 1473 K for 50 h, corresponding to complete strength recovery, sufficient HP filled the gap volume (), yielding very small, isolated flaws. Clearly, the isolated remaining flaws were smaller than the pre-existing flaw (highlighted in green), which was fortunately located in the observation region.
Measurements from the top-view images ()) revealed an average L = 1.18 μm and 2 cR = 0.85 μm of three large remaining flaws. Thus, in accordance with the bridging model, F = 1.376 could be calculated using the collinear multiple cracks model [Citation57]. Then, the equivalent flaw size could be calculated from the measured flaw size, i.e., ae = 0.81 μm. This equivalent flaw size is smaller than the pre-existing flaw, indicating full strength recovery and fracturing from sites other than the healed pre-crack (see section 4.3).
4.3 Crack-gap volume for Vickers crack
To model the crack-gap filling behavior, the crack geometry, notably, Vg (EquationEquation 3(3)
(3) ) and the area of one side of the fracture surface A (EquationEquation 7
(7)
(7) ), must be evaluated. In general, both values are estimated using FEA based on the material properties and various damage conditions [Citation51–Citation54]. Many studies have experimentally evaluated the self-healing behavior of a Vickers crack [Citation17,Citation56]. For the case of a median/radial crack introduced by Vickers indentation, the influence of the tensile residual stress on δmax is non-negligible [Citation61–Citation63].
Here, we discuss the influence of annealing on typical crack geometries and residual stress for Vickers indentation crack in AS15P and AS30P ()). Assuming that the aspect ratio a/c = 1, Vg and A can be determined from the 3D geometry as follows:
where δmax, c, and a, are the maximum crack mouth opening displacement, crack half-length, and indent half-length, respectively ()).
Figure 4. Nonlinear fracture mechanics and Vickers crack geometry. (a) Schematic illustration of Vickers crack. (b) Non-linear fracture behavior of as-cracked AS30P and AS15P and estimated equivalent size of the remaining flaw in the crack gap healed at 1473 K for 1 h. (c) Numerical model of the temperature dependence of maximum crack mouth opening displacement and residual stress intensity factor Kres. (d) Effect of crack length on the Vickers crack geometries.
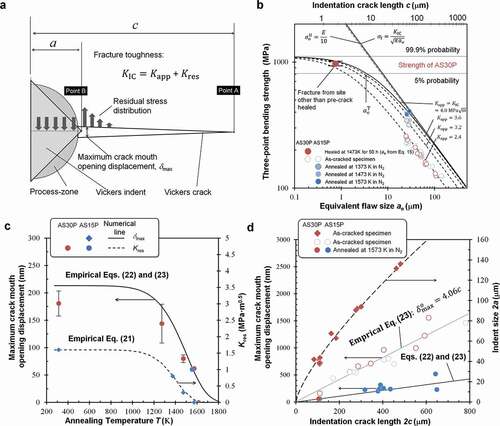
For the case of a median/radial crack generated via Vickers indentation, the influence of the tensile residual stress on δmax is non-negligible [Citation17,Citation56,Citation61–Citation63] (). For a Vickers crack, the fracture toughness is given by
where Kapp and Kres are the stress intensity factor at the crack-tip caused by the external applied stress and the internal tensile residual stress near the indent, respectively. Marchell et al. [Citation62] reported that Kres = 0.45 KIC, while Ando et al. [Citation17,Citation56] reported that Kres = 0.40 KIC for Al2O3/SiC composite ceramics.
) shows the nonlinear fracture behavior for AS30P and AS15P annealed at 1,273–1,573 K for 1 h in a reducing atmosphere (N2 gas). The value of ae along the x-axis was estimated from the relation ae = F2 c, where F was calculated using the Newman–Raju Equation [Citation58] for a semi-elliptical Vickers crack. The strength of the as-cracked specimen for both AS30P and AS15P is in good agreement with the values estimated using EquationEquation (14)(14)
(14) by inputting Kapp = 0.6KIC in EquationEquation (20)
(20)
(20) . Further, the bending strength increases in accordance with decreasing Kres as the annealing temperature increases. The strength was estimated using Kres = 0.8, 0.3, and 0 MPa·am0.5 for as-cracked AS15P annealed at 1373, 1473, and 1573 K, respectively, for 1 h.
In ), we also present the relationship between the experimental strength and ae (0.81 μm) estimated from 3D images of specimens healed at 1473 K for 1 and 50 h (see section 4.2). The original strengths of the AS30P corresponding to 99.9% and 5% failure probability are also represented. The crossing point of the strength for the 5% failure probability and the strength of an as-cracked specimen estimated using EquationEquation (15)(15)
(15) (by inputting Kapp = KIC) is defined as the transition flaw size aeT, which was determined to be aeT = 4 μm. Thus, for the specimen healed at 1473 K for 50 h, the estimated ae (0.81 μm) is lower than aeT, indicating a complete strength recovery.
In accordance with the internal residual stress relaxation, both Kres and the measured δmax decrease as functions of the annealing temperature T ()). The δmax and Kres values measured at the Vickers crack (initial crack length 2 c = 110 μm) appear almost constant with increasing T and decrease significantly above ~1200 K. Therefore, the stress relaxation induced by creep deformation becomes significant above this T. In this study, we derived the following empirical relations:
where δmaxo is the initial maximum crack mouth opening displacement, and Tc and p are the empirical fitting parameters for estimating Kres. Further, Tc’ and q are fitting parameters for estimating δmax. From the experimental results, we determined Tc = 1423 K, p = 11, Tc’ = 1523 K, and q = 9 for our calculations. The measured δmaxo for both AS30 and AS15P exhibited a linear relation with 2 c ()). The empirical relation between the measured δmaxo before annealing and c is expressed as
Within the tested 2 c ranges, δmax decreased significantly after annealing at 1573 K for 1 h in a reducing atmosphere. By substituting EquationEquation (23)(23)
(23) into EquationEquation (22)
(22)
(22) , we can estimate the high-temperature δmax from 2 c. The δmax values estimated for 1573 K agree well with the experimental data ()). Thus, we can empirically determine the Rf (EquationEquation 3
(3)
(3) ) of Vickers crack from EquationEquations (18)
(18)
(18) -(Equation23
(23)
(23) ).
4.4 Remaining crack size for Vickers crack
The typical fracture mechanism of the healed indentation crack is also important to discuss because of the presence of microcracks in the process zone ()). Here, we assumed that micro-cracks in the process zone under the indent can be healed significantly faster than a Vickers crack with a large opening displacement. The tip-to-mouth filling model (EquationEquation 16(16)
(16) ) can be simply modified for a typical Vickers crack as follows:
At early-stage healing with small filling ratio Rf (EquationEquation 3(3)
(3) ), the ratio
is large, where
is the half-length of the remaining flaw in the healed crack gap. In this case, the strength of the healed specimen is determined by the stress intensity factor at the outer crack tip (point A in )). It has been reported that the F value at point A [Citation64] is similar to that calculated using the Newman–Raju equation [Citation58]. For the case of small
, when Rf is large, the strength of the healed specimen is determined by the stress intensity factor of the inner crack tip close to the indenting tip (point B, )). The F value at point B of the ring-shaped crack can be estimated using the Fett equation [Citation64] as follows:
By substituting cR to EquationEquation (25)(25)
(25) and the F values estimated from the Newman–Raju and Fett equations into EquationEquation (14)
(14)
(14) , the strength of a healed specimen
that fractured from point A to point B can be determined. In our calculation, the higher strength was selected as the lower strength limit of the healed specimen.
5. Discussion
Here, we demonstrate the validity of our proposed model using experimental data for SiC-containing ceramic composites healed under various conditions by predicting the minimum healing times and strengths of the healed ceramics. We also illustrate an application of the model as a tool for designing a self-healing ceramic.
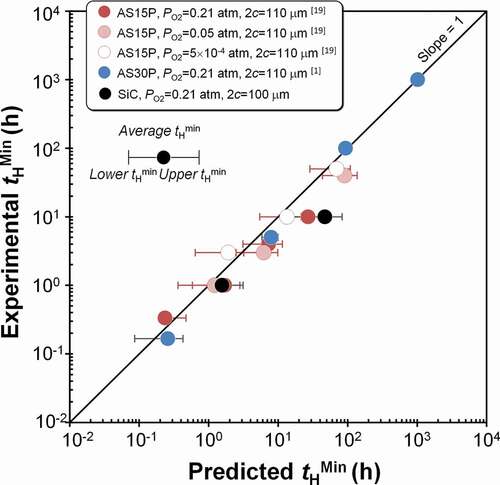
5.1 Minimum healing time for complete strength recovery
shows the average tHMin predictions for composites with various SiC volume fractions, i.e., AS15P, AS30P, and monolithic SiC, healed at TH of 1073–1673 K under of 5 × 10⁻⁴ to 0.21 atm. The initial crack length was 100–110 μm. The results agree well with the experimental tHMin values for all conditions. Further, most predicted average tHMin values are between the experimental tHMin value and 10 times those values, and the lower-limit tHMin exhibits better agreement than the upper-limit tHMin. These findings confirm that the experimental transition of the fracture initiation site can be successfully captured by the imposed criteria; i.e. the healed specimen begins to fracture from sites other than the pre-crack when the healing time satisfies σfL = σoL, even when Rf < 1.
Figure 5. Comparison of predicted and experimental minimum healing time for full strength recovery tHMin in self-healing ceramics including SiC healing agent. The tHMin values were estimated at various healing temperatures TH and oxygen partial pressures .
Further, the model accurately describes the healing kinetics for various SiC-containing composites, even if the reported isothermal oxidation kinetics properties, e.g., and Qox, in monolithic SiC are used for calculation [Citation46] (EquationEquation 5
(5)
(5) ). The model also effectively determines tHMin for AS15P at various
values. In our previous study [Citation19], we proposed an empirical kinetics equation,
, where AH and QH are empirical constants corresponding to the apparent frequency factor and apparent activation energy for self-healing, respectively. Comparing these values, that AH should clearly be defined as
for the case of isothermal oxidation. Thus, the reported empirical AH depends on the initial crack geometrical parameters (A and Vg), along with fe, fv, ∆ρ, and the standard oxygen partial pressure
. Further, the reported empirical QH (389 kJ mol–1) is higher than Qox (161 kJ mol–1) obtained for SiC isothermal oxidation. This discrepancy is mainly due to a decrease in δmax with increasing temperature, followed by the increment in Vh during healing and cooling as the temperature increases.
5.2 Strength recovery through self-healing
shows the strengths of ceramics containing various SiC volume fractions and variously shaped HAs healed at TH of 973–1673 K for various tH values in air. The dotted and solid lines represent the predicted σfU and σfL, respectively. The figures clearly show that the model is in good agreement with the experimental strength values. Further, most experimental strength values are distributed between the σfU and σfL lines.
Figure 6. Comparison between experimental and predicted σFU and lower σBL strength for self-healing ceramics including various SiC healing agents. (a) AS30P [Citation1] healed at 1573 K, 1473 K, and 1373 K in air and (b) monolithic SiC healed for 1 h and 10 h in air. (c) Effect of crack length on strength for AS30P [Citation2] healed at 1573 K for 1 h in air and (d) effect of crack length on strength AS30 W [Citation2] at 1,573 K for 1 h and 10 h in air.
![Figure 6. Comparison between experimental and predicted σFU and lower σBL strength for self-healing ceramics including various SiC healing agents. (a) AS30P [Citation1] healed at 1573 K, 1473 K, and 1373 K in air and (b) monolithic SiC healed for 1 h and 10 h in air. (c) Effect of crack length on strength for AS30P [Citation2] healed at 1573 K for 1 h in air and (d) effect of crack length on strength AS30 W [Citation2] at 1,573 K for 1 h and 10 h in air.](/cms/asset/f08ad41d-8f99-45e2-987c-8220309982cf/tsta_a_1796468_f0006_oc.jpg)
) shows the strength prediction for AS30P as a function of tH. The strength estimated at ~1 min increases significantly with TH. Thus, the Vh during heating and cooling increases with temperature and is non-negligible in the high-temperature region. Further, the experimental strength during early-stage healing is closer to σfL than to σfU. Thus, the strength is governed mainly by the tip-to-mouth filling model in the early stage, because many large flaws remain when Rf has a significantly low value (). With increasing healing time, the experimental strength becomes above σfL and is plotted between σfL and σfU. This implied that F values of tip-to-mouth filling model are affected by bonding of bridging parts, and slightly decreased.
) shows the predicted strength for monolithic SiC as a function of tH. The results for only σfL are shown because the distance between the interlocking grains for the bridging model is unknown. The model predictions generally agree well with the experimental results, although the σfL predicted for 1 h of healing is greater than the experimental data below 1273 K. This is due to the fact that residual stress relaxation rate is overestimated for monolithic SiC in our model, since we empirically estimated the decreases in (EquationEquation 21
(21)
(21) ) and
(EquationEquation 22
(22)
(22) ) from parameters of alumina-SiC composite with higher creep rate than monolithic SiC. show the predicted strengths for AS30P and AS30 W as functions of 2 c, respectively. The model results agree well with the experimental data. Further, the experimental strength of AS30P is closer to σfU below 2 c ~ 300 μm, even for inadequate filling (Rf < 1), and it is closer to σfL than σfU above 2 c ~ 300 μm ()). This implies that the strength is governed by the bridging and tip-to-mouth models when Rf has significantly large and small values, respectively. This mechanism is the same as that for early-stage healing shown in ). Notably, this critical length of 2 c ~ 300 μm corresponds to δmax ~ 200 nm ()). Thus, this finding also implies that for particle-type HA, it becomes difficult for oxides from SiC particles with average sizes of 270 nm to partially bond fractured surfaces with δmax > 200 nm [Citation2].
In SiC-whisker-reinforced materials, no abrupt decrease in experimental strength such as that for AS30P was observed within the tested 2 c values ()). The experimental strength of AS30 W decreases slightly as 2 c increases. The gradual decrease in strength is successfully demonstrated by the bridging and tip-to-mouth filling models, clearly indicating that the initial strong bridging between fractured surfaces generated by the SiC whiskers subsequently generates rapid strength recovery based on the bridging model (as illustrated in )). Furthermore, the lower-limit σfU predicted for 1 h of healing at 1573 K exhibits constant values for 2 c = ~300 μm; i.e. it is insensitive to flaws within this crack length. Therefore, the cR estimated by the tip-to-mouth filling model becomes less than the crack length corresponding to the transition flaw size aeT (as shown in )). The toughening is particularly important for an increase in aeT. In this example, aeT = 40 μm for AS30 W (KIC = 7.0 MPa·am0.5, σoL = 663 MPa), which is approximately 10 times larger than that for AS30P (aeT = 4.2 μm; KIC = 4.0 MPa·am0.5, σoL = 860 MPa). Thus, our model clearly suggests that toughening, together with increased self-healing capability, is important for designing next-generation self-healing materials and for safely using brittle ceramics.
5.3 Self-healing function by design
Our kinetic model can provide the optimal structural combination yielding suitable self-healing functionality for actual high-temperature applications. We believe that SiC-containing ceramic composite is an attractive candidate material for turbine blades operating at ~1473 K in jet engines during cruising. Further, in our previous study [Citation49], we estimated the oxygen concentration and total pressure in a combustion gas atmosphere using a virtual jet engine. Thus, it is possible to assess whether the structural combination realizes complete self-healing of an introduced surface crack within a short cruising time.
Contour plots for the effects of fv and the rate constant, log ko, which are two major indexes related to healing agent capacity, are shown in , respectively, for upper tHMin and various 2 c values. The contour lines represent the conditions for iso-tHMin lines. In this calculation, we inputted TH =1473 K and = 1.25 atm, estimated at the first-stage vane in a low-pressure turbine in an uncooled CF6 virtual jet engine [Citation49], as a reference case ()). The vertical axis presents 2 c values as a damage index.
Figure 7. Towards self-healing by design: parametric analysis on two major indexes contributing to the self-healing kinetics. (a) Cross-section of a conventional CF6 jet engine, and the estimated gas temperature and partial oxygen pressure at first-stage vane in low-pressure turbine. (b) Contour plots for the effects of (b) fv and (c) the rate constant, log ko on upper tHMin for various crack lengths as a damage index.
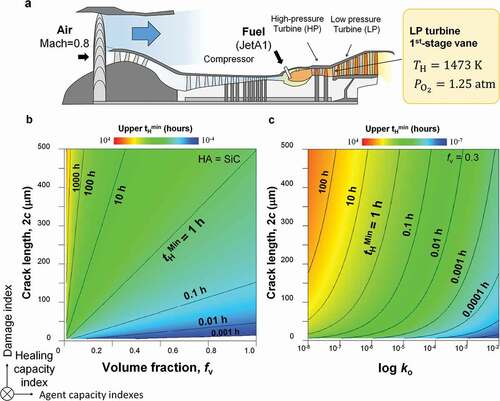
In ), all contour lines increase almost linearly with increasing fv, and the line slope decreases significantly as the target tHMin decreases. Meanwhile, the tHMin for a large crack decreases dramatically to approximately fv = 0.05–0.1, above which the decrease is marginal. This implies that more than ~10% SiC must be added to completely heal within a finite time (e.g., tHMin < 100 h). This finding also supports our earlier argument that adding more than approximately 7.5–10% SiC is required to completely heal a surface crack (2c ~ 100 μm) [Citation2,Citation19]. For higher SiC content, tHMin decreases dramatically below 50 μm. Accordingly, the figure clearly shows that our model can indicate the minimum SiC content required to completely heal various cracks at 1473 K within a short cruising time.
On the other hand, in ), all contour lines increase exponentially with , indicating increased HA oxidation capability. Notably,
significantly affects tHMin in the case of a large crack, because the contour line slope is steep. Therefore,
is more important than fv for determining the tHMin for a long crack. Indeed, many types of HA having higher oxidation capacity than SiC, such as carbides [Citation24,Citation25], intermetallic compounds [Citation26,Citation27], and MAX phase materials [Citation28,Citation31], which have recently been proposed as candidate HAs. We expect our model to be applicable to self-healing ceramics containing such new types of HA.
Collectively, these results show that the proposed kinetic model is helpful for designing next-generation self-healing ceramics for high-temperature applications. In addition, the model can facilitate a detailed microstructural optimization and selecting the appropriate HA for the use in the actual environments encountered in real applications. However, crack propagation under stress at high temperature increases the required tH. Further, it is assumed that investigations of various problems, such as the effectiveness of self-healing for uncertain crack size due to FOD and thermal–structural coupling behavior (including competition between the crack propagation and self-healing), will be required for practical designs. Thus, FEA incorporating our model [Citation50,Citation51] will be a useful technique for investigating such influences in more detail.
6. Conclusions
In summary, we have proposed a universal kinetic model describing the strength recovery induced by the self-healing of alumina containing SiC HAs for various damage sizes and under various heat-treatment conditions. The bridging model for estimating the remaining flaw size, which was proposed based on 3D crack-gap filling observation, can predict the upper strength limit of a healed-crack specimen with inadequate filling the crack gap. Further, the proposed tip-to-mouth filling model can predict the lower strength limit of the healed specimen. The kinetic model indicates the minimum healing time for full strength recovery. Further, this theoretical approach can indicate the optimal microstructural combination yielding the self-healing functionality required for actual high-temperature applications and may aid the design of next-generation self-healing ceramics. In future work, we will attempt to integrate this kinetic model into the FEA to develop the design guidelines for next-generation self-healing components, specifically the turbine blades.
Acknowledgments
This research was supported by KAKENHI (grant no.: JP24760093) and partially supported by JSPS Overseas Research Fellowships. This study was partially supported by the Advanced Characterization Nanotechnology Platform (Ministry of Education, Culture, Sports, Science and Technology, MEXT, Japan). We thank Ms. Yuka Hara, Ms. Akiko Nakamura and Mr. Takuma Kohata from NIMS for their support with the focused-ion-beam–scanning-electron-microscopy observation. We also acknowledge Dr. Masahiro Yokouchi from Kanagawa Institute of Industrial Science and Technology for his support with sintering. Lastly, we would like to thank Editage (www.editage.jp) for English language editing.
Disclosure statement
No potential conflict of interest was reported by the authors.
Additional information
Funding
References
- Osada T, Kamoda K, Mitome M, et al. A novel design approach for self-crack-healing structural ceramics with 3D networks of healing activator. Sci Rep. 2017;7:17853.
- Osada T, Nakao W, Takahashi K, et al. Self-crack-healing behavior in ceramic matrix composites, Advances in ceramic matrix composites. Cambridge, UK: Woodhead Publishing; 2014. p. 410–441.
- Nakao W, Maruoka D, Ozaki S, et al. Mechanical properties and performance of engineering ceramics and composites IX. In: Singh D, Salem J, editors. Hoboken, NJ: John Wiley & Sons, Inc.; 2014. p. 187–193.
- Padture NP. Advanced structural ceramics in aerospace propulsion. Nat Mater. 2016;15:804–809.
- Evans AG. Perspective on the development of high-toughness ceramics. J Am Ceram Soc. 1990;73:187–206.
- Wegst UGK, Bai H, Saiz E, et al. Bioinspired structural materials. Nat Mater. 2015;14:23–36.
- Bouville F, Maire E, Meille S, et al. Strong, tough and stiff bioinspired ceramics from brittle constituents. Nat Mater. 2014;13:508–514.
- Hu CF, Sakka Y, Grasso S, et al. Shell-like nanolayered Nib4AlC3 ceramics with high strength and toughness. Scr Mater. 2011;64:765–768.
- van der Zwaag S, Dijk NH, Jonkers HM, et al. Self-healing behavior in man-made engineering materials: bioinspired but taking into account their intrinsic character. Phil Trans R Soc A. 2009;367:1689–1704.
- Hager MD, Greil P, Leyens C, et al. Self-healing materials. Adv Mater. 2010;22:5424–5430.
- White SR, Sottos NR, Geubelle PH, et al. Autonomic healing of polymer composites. Nature. 2001;409:794–797.
- Toohey KS, Sottos NR, Lewis JA, et al. self-healing materials with microvascular networks. Nat Mater. 2007;6:581–585.
- Jonkers HM, Thijssen A, Muyzer G, et al. Application of bacteria as self-healing agent for the development of sustainable concrete. Ecol Eng. 2010;36:230–235.
- Chu MC, Sato S, Kobayashi Y, et al. Damage healing and strengthening behaviour in intelligent mullite/SiC ceramics. Fatigue Fract Eng Mater Struct. 1995;18:1019–1029.
- Ando K, Chu MC, Tsuji K, et al. Crack healing behavior and high-temperature strength of mullite/SiC composite ceramics. J Eur Ceram Soc. 2002;22:1313–1319.
- Ando K, Kim BS, Chu MC, et al. Crack-healing and mechanical behavior of Al2O3/SiC composites at elevated temperature. Fatigue Fract Eng Mater Struct. 2004;27:533–541.
- Nakao W, Ono M, Takahashi K, et al. Critical crack-healing condition for SiC whisker reinforced alumina under stress. J Eur Ceram Soc. 2005;25:3649–3655.
- Nakao W, Takahashi K, Ando K. Threshold stress during crack-healing treatment of structural ceramics having the crack-healing the ability. Mater Lett. 2007;61:2711–2713.
- Osada T, Nakao W, Takahashi K, et al. Kinetics of self-crack-healing of alumina/silicon carbide composite including oxygen partial pressure effect. J Am Ceram Soc. 2009;92:864–869.
- Osada T, Nakao W, Takahashi K, et al. Strength recovery behavior of machined Al2O3/SiC nano-composite ceramics by crack-healing. J Eur Ceram Soc. 2007;27:3261–3267.
- Sugiyama R, Yamane K, Nakao W, et al. Effect of difference in crack-healing ability on fatigue behavior of alumina/silicon carbide composites. J Intell Material Syst Struct. 2008;19:411–415.
- Ando K, Furasawa K, Chu MC, et al. Crack-healing behavior under stress of mullite/silicon carbide ceramics and the resultant fatigue strength. J Am Ceram Soc. 2001;84:2073–2078.
- Nakao W, Abe S. Enhancement of the self-healing ability in oxidation induced self-healing ceramic by modifying the healing agent. Smart Mater Struct. 2012;21:025002.
- Farle A, Boatemaa L, Shen L, et al. Demonstrating the self-healing behavior of some selected ceramics under combustion chamber condition. Smart Mater Struct. 2016;25:084019.
- Yoshioka S, Boatemaa L, van der Zwaag S, et al. On the use of TiC as high-temperature healing particles in alumina based composites. J Eur Ceram Soc. 2016;36:4155–4511.
- Yoshioka S, Nakao W. Methodology for evaluating self-healing agent of structural ceramics. J Intell Material Syst Struct. 2014;26:1395–1403.
- Derelioglu Z, Carabat AL, Song GM, et al. On the use of B-alloyed MoSi2 particles as crack healing agents in yttria stabilized zirconia thermal barrier coatings. J Eur Ceram Soc. 2015;35:4507–4511.
- Bei GP, Pedimonte BJ, Pezoldt M, et al. Crack healing in Ti2Al0.5Sn0.5C–Al2O3 composites. J Am Ceram Soc. 2015;98:1604–1610.
- Sloof WG, Pei R, McDonald SA, et al. Repeated crack healing in MAX-phase ceramics revealed by 4D in situ synchrotron X-ray tomographic microscopy. Sci Rep. 2016;6:1–9.
- Li S, Xiao L, Song G, et al. Oxidation and Crack healing behavior of a fine-grained Cr2AlC ceramic. J Am Ceram Soc. 2013;96:892–899.
- Farle A, Kwakernaak C, van der Zwaag S, et al. A conceptual study into the potential of Mn+1AXn-phase ceramics for self-healing of crack damage. J Eur Ceram Soc. 2015;35:37–45.
- Stumpf M, Fey T, Kakimoto K, et al. Nb2AlC-particle induced accelerated crack healing in ZrO2–matrix composites. Ceram Int. 2018;44:19352–19361.
- Biatemaa L, van der Zwaag S, Sloof WG. Self-healing of Al2O3 containing Ti microparticles. Ceram Int. 2018;44:11116–11126.
- Maruoka D, Nanko M. Recovery of mechanical strength by surface crack disappearance via thermal oxidation for nano-Ni/Al2O3 hybrid materials. Ceram Int. 2013;39:3221–3229.
- Yoshida H, Kano S, Hasegawa Y, et al. Particle impact phenomena of silicon nitride ceramics. Phil Mag A. 1996;74:1287–1297.
- Koizumi Y, Kobayashi T, Yokokawa T, et al. Superalloys 2004. PA: TMS; 2004. p. 35–43. (Eds: K. A. Green, T. M. Pollock, H. Harada, T. E. Howson, R. C. Reed, J. J. Schirra, S. Walston).
- Gu YF, Cui C, Harada H, et al. Superalloys 2008. PA: TMS; 2008. p. 53–61. (Eds: R. C. Reed, K. A. Green, P. Caron T. P. Gabb, M. G. Fahrmann, E. S. Huron, S. A. Woodard).
- Reed R. The superalloys: fundamentals and applications. Cambridge, UK: Cambridge University Press; 2006.
- Harada H, Ohno K, Yamagata T, et al. Superalloys 1988. PA: TMS; 1988. p. 733–742. (Eds:S. Reichman, D.N. Duhl, G. Maurer, S. Antolovich and C. Lund).
- Xiong W, Olson GB. Cybermaterials: materials by design and accelerated insertion of materials. NPJ Compu Mats. 2016;2:15009.
- Galindo-Nava EI, Connor LD, Rae CMF. On the prediction of the yield stress of unimodal and multimodal γ’ Nickel-base superalloys. Acta Mater. 2015;98:377–390.
- Whitmore L, Ahmadi MR, Stockinger M, et al. Microstructural investigation of thermally aged nickel-based superalloy 718Plus. Mater Sci Eng A. 2014;594:253–259.
- Osada T, Gu YF, Nagashima N, et al. Optimum microstructure combination for maximizing tensile strength in a polycrystalline superalloy with a two-phase structure. Acta Mater. 2013;61:1820–1829.
- Goto T, Homma H. High-temperature active/passive oxidation and bubble formation of CVD SiC in O2 and CO2 atmospheres. J Eur Ceram Soc. 2002;22:2749–2756.
- Goto T, Homma H, Hirai T. Effect of oxygen partial pressure on the high-temperature oxidation of CVD SiC. Corros Sci. 2002;44:359–370.
- Castello JA, Tressler RE. Oxidation kinetics of hot-pressed and sintered α-SiC. J Am Ceram Soc. 1981;64:327–331.
- Lv Z, Chen H. Modeling of self-healing efficiency for cracks due to unhydrated cement nuclei in hardened cement paste. Procedia Eng. 2012;27:281–290.
- Ponnusami SA, Turteltaub S, van der Zwaag S. Cohesive-zone modelling of crack nucleation and propagation in particulate composites. Eng Fract Mech. 2015;149:170–190.
- Osada T, Kinetics model for self-crack-healing in ceramics and possibility of turbine blade applications. Proceedings of the 4th International Conference on Self-Healing Materials; Ghent, Belgium; 2013, p. 573–576.
- Fukuda M, Harada H, Yokokawa T, et al. Virtual jet engine system. Mater Sci Forum. 2010;638-642:2239–2244.
- Drabi MK, Abu Al-Rub RK, Little DN. A continuum damage mechanics framework for modeling micro-damage healing. Int J Solids Struct. 2012;49:492–513.
- Ozaki S, Aoki Y, Osada T, et al. Finite element analysis of fracture statistics of ceramics: effects of grain size and pore size distributions. J Am Ceram Soc. 2018;101:3191–3204.
- Ozaki S, Osada T, Nakao W. Finite element analysis of the damage and healing behavior of self-healing ceramic materials. Int J Solids Struct. 2016;100:307–318.
- Nakamura M, Takeo K, Osada T, et al. Finite element analysis of self-healing and damage processes in alumina/SiC composite ceramics. Technologies. 2017;5:40–50.
- Bazant ZP, Kazemi MT. Size effect in fracture ceramics and its use to determine fracture energy and effective process zone length. J Am Ceram Soc. 1990;73:1841–1853.
- Ando K, Shirai Y, Nakatani M, et al. (Crack-healing + proof test): a new methodology to guarantee the structural integrity of a ceramics component. J Eur Ceram Soc. 2002;22:121–128.
- Tada H, Paris PC, Irwin GR. The stress analysis of cracks Handbook. USA: ASME; 1973.
- Newman JC Jr., Raju IS. An empirical stress-intensity factor equation for surface crack. Eng Fract Mech. 1981;15:185–192.
- Murakami Y. Stress intensity factor handbook, committee on fracture mechanics. Japan: The Society of Materials Science; 2001.
- Takeuchi M, Kato T, Washiya T, et al. Corrosion resistance of ceramic materials in pyrochemical electrowinning conditions. JNC Technical Review. 2004;23:31–40. (In Japanese).
- Lawn BR, Evans AG, Marshall DB. Elastic/plastic indentation damage in ceramics: the medial/radial crack system. J Am Ceram Soc. 1980;63:574–581.
- Marshall DB, Lawn BR. Residual stress effects in sharp contact cracking, part1 indentation fracture mechanics. J Mater Sci. 1979;14:2001–2012.
- Schneider GA, Fett T. Corrosion resistance of ceramic materials in pyrochemical electrowinning conditions. J Ceram Soc Jpn. 2006;114:1044–1048.
- Fitt T, Rizzi G. Weight function and stress intensity factors for ring-shaped cracks, KIT-Report. FZKA. 2007;7265:1–40.