
ABSTRACT
Environmental policies may have important consequences for firms’ competitiveness or profitability. For the European Union Emissions Trading System (EU ETS) the empirical literature documents that significant emissions reductions have resulted from it. Surprisingly, however, the literature shows that there have been hardly any concurrent negative effects on firms’ competitiveness during the first two phases of the scheme (2005–2012). We show that the main explanations for the absence of negative impacts on competitiveness are a large over-allocation of emissions allowances leading to a price drop and the ability of firms to pass costs onto consumers in some sectors. Cost pass-through combined with free allocation, in turn, partly generated windfall profits. In addition, the relatively low importance of energy costs indicated by their average share in the budgets of most manufacturing industries may have limited the impact of the EU ETS. Finally, small but significant stimulating effects on innovation have been found so far. Several factors suggest that over-allocation is likely to remain substantial in the upcoming periods of the scheme. Therefore, we expect to see no negative competitiveness effects from the EU ETS in Phases III and IV (2013–2030).
Key policy insights
Empirical literature on the EU ETS shows that there have been hardly any effects on firms’ competitiveness or profitability.
One main explanation is a large over-allocation of emissions allowances leading to a price drop. This reduced incentives for innovation.
Moreover, firms were able to pass costs on to consumers in some sectors which partly generated windfall profits.
Innovation effects have so far been small but positive.
We expect to see no negative competitiveness effects on regulated firms in the near future suggesting that no further reliefs for regulated firms are required.
1. Introduction
The European Union Emissions Trading System (EU ETS) is the largest market for greenhouse gas (GHG) emissions worldwide covering more than 11,000 manufacturing and power plants and about 45% of the EU’s GHG emissions in 31 countries (EU Commission, Citation2016). Significant emissions reductions have been found to result from the EU ETS (Ellerman, Marcantonini, & Zaklan, Citation2016; Martin, Muûls, & Wagner, Citation2016; Petrick & Wagner, Citation2014; Wagner, Muûls, Martin, & Colmer, Citation2014). However, one would also expect negative side effects on competitiveness and employment of regulated companies. This is because regulated firms face additional costs either for abatement or for purchasing emissions allowances and may, in consequence, lose market shares to non-regulated firms, e.g. abroad.
Surprisingly, the ex post literature on firm-level effects of the EU ETS shows hardly any significant negative impacts on the competitiveness of regulated firms during Phase I and II (for overviews see Arlinghaus, Citation2015; Martin et al., Citation2016; Venmans, Citation2012; also Dechezleprêtre & Sato, Citation2017; Jaraite & Di Maria, Citation2016). A cross-sector comparison for the entire European Union shows negligible competitiveness effects (Abrell, Ndoye, & Zachmann, Citation2011). Even when focusing on energy intensive industries, no negative effects on firm level competitiveness were found for cement or iron and steel industries (Chan, Li, & Zhang, Citation2013). By contrast, in the power sector, despite rising unit material costs, revenue might even have increased substantially (ibid.). Also, a refined methodological approach finds no competitiveness effects for Germany, the largest economy within the European Union (Petrick & Wagner, Citation2014). Against this background, the present paper explores factors that may help account for this finding of no negative effects on competition resulting from the EU ETS in Phases I and II. We also try to extend our reasoning to Phases III and IV, where relevant.
Why is it important to understand a phenomenon that displays a zero effect? This is because a zero effect may come as a surprise given that special interest groups were highly concerned about employment losses and other negative competitiveness effects (Hanoteau, Citation2014; Monjon & Quirion, Citation2011). Also, in economics ‘there is no free lunch’ so there may be hidden negative side effects from the fact that the emissions reduction goals of the EU ETS were fully achieved in Phase II (EU Commission, Citation2015a). In fact, positive and negative side effects from the EU ETS on firms may cancel each other out. In parallel, emissions trading has distributional effects such that certain firms or sectors may benefit while others may face additional challenges (Flues & Thomas, Citation2015). Understanding past experience is crucial to shaping the future of the EU ETS. Therefore, it is important to understand whether this zero effect is due to the design of the scheme (e.g. allocation method), to firms’ quick adaptation, or to other contextual elements. Finally, some special interest groups or lobbies have an interest in shaping concerns about potential negative competitiveness effects such as job losses. Our analysis is based on a thorough analysis of the literature and provides key insights to policymakers and researchers while pointing out where we see a need for more research.
In theory, a cap-and-trade system imposes extra costs on firms (e.g. Deschenes, Citation2014). This is because they either have to implement abatement activities or to purchase emissions allowances unless there is free allocation. In addition, firms face transaction costs and costs for monitoring, reporting and verification of emissions (MRV). The sum of these costs may lead to a loss of competitiveness depending on the market structure and on the design of the policies, e.g. exemptions. Moreover, the effects are contingent on who is covered by the policy, e.g. whether it is a unilateral policy. It is of relevance whether (foreign) competition exists and the type of regulation that competitors face. Notwithstanding, environmental policies could also have positive effects on firms’ competitiveness. For example, these policies may trigger innovation with potentially positive consequences (Porter, Citation1991; Porter & Van der Linde, Citation1995). Also, net selling firms benefit if emissions allowances are freely allocated and over-allocated, and have a positive price on the emissions market. Hence, there may be positive and negative partial effects from emissions trading where the overall effect is not generally clear.
We contribute to the literature by providing a systematic reasoning for why there have been no negative effects on firm level competitiveness due to the EU ETS for Phase I and II. While past literature has already documented close to zero negative effects (Arlinghaus, Citation2015; Martin et al., Citation2016), we add to this a careful explanation of the underlying reasons. We discuss the relevance of the different channels also in light of the changes made to the EU ETS in Phase III (2013–2020) and Phase IV (2021–2030), although there is, as yet, no comprehensive ex post evidence for these Phases.
We limit our analysis to competitiveness at the firm level thus excluding the country level perspective. By ‘competitiveness’ we mean a firm’s long run profit performance as measured by turnover, value added or employment (Dechezleprêtre & Sato, Citation2017). The focus is on direct effects from the EU ETS whereas indirect effects, such as through rising electricity prices, are covered only briefly (as in Martin et al., Citation2016). Also, this survey cannot provide a fully-fledged cost–benefit analysis.
Our results start from the large amount of free allocation in Phases I and II. Thus, firms have mostly faced transaction and opportunity costs, rather than any costs of purchasing certificates. Second, there has been a large over-allocation of emissions certificates leading to a price drop which, in turn, has reduced the costs of buying additional certificates, and with it, the incentives to abate emissions. Third, firms have been able to pass through the costs of emissions trading onto consumers at least in some sectors, most prominently in the power sector. This fact, in combination with free allocation of allowances, has generated windfall profits for some firms. Fourth, the share of energy costs in production is on average rather low, therefore limiting the economic impacts of emissions trading. Fifth, statistically significant stimulating effects on innovation have been found, although these are small, potentially due to the low price of certificates.
These results suggest that free allocation and a very low price of certificates, together with small but significant stimulating effects on innovation, have added up positively so as to counteract a potential small negative effect from rising energy cost shares. Together with options for passing through costs to consumers, the profitability of firms has even increased for a few sectors under the EU ETS.
This paper is structured as follows: The next section gives a brief overview of relevant institutional aspects of the EU ETS. Section 3 briefly reviews the corresponding ex-post literature. Section 4 checks five hypotheses that may account for the zero effect on competitiveness of the EU ETS, by collecting existing empirical findings. These are: free allocation; over-allocation; cost pass-through; low energy cost shares; and innovation. Finally, section 5 concludes.
2. Institutional background of the EU ETS
The EU ETS caps carbon emissions by allocating only a limited amount of emissions allowances called European Union Allowances (EUAs) which can then be traded. Phase I (2005–2007) was considered a trial phase. Phase II ran from 2008 to 2012. Phase III is running from 2013 to 2020 and is seen as a tightening of the system.Footnote1 Phase IV will run from 2021 to 2030. The EU ETS covers about 50% of the European Union’s CO2 emissions and 40% of its total GHG emissions (Schleich, Rogge, & Betz, Citation2009). Regulated industries are energy-intensive industries within the manufacturing and the power sector, i.e. combustion installations with a rated thermal input capacity of at least 20 MW, refineries, coke ovens, steel plants, and installations producing cement clinker, lime, bricks, glass, pulp and paper. Since 2012, the aviation sector has also been added to the EU ETS.
Emission allowances were fully grandfathered at the beginning of the scheme and later only partly given for free via benchmarking. Full auctioning applies to power generators since Phase III, while all other manufacturing sectors receive allowances according to benchmarking.Footnote2 But there are exceptions in order to explicitly maintain the competitiveness of EU ETS-covered industries and prevent carbon leakageFootnote3 (Directive Citation2009/29/EC, Article 10a). These exceptions are regulated according to the estimated risk of carbon leakage.Footnote4 Installations in sectors exposed to carbon leakage risk are eligible for 100% free allowances up to the benchmark (ibid). This preferential treatment concerns 154 out of 258 sectorsFootnote5, representing between 85% (Martin, Muûls, De Preux, & Wagner, Citation2014a) and 95% (De Bruyn, Nelissen, & Koopman, Citation2013) of CO2 emissions from manufacturing. Still, in 2013, manufacturing industries not classified at risk of carbon leakage have received 80% of needed permits for free up to the benchmark. This share is expected to be 30% in 2020, and 0% in 2027 (EU Commission, Citation2015b, Citation2016; also see Martin, Muûls, de Preux, & Wagner, Citation2014b).
As an alternative to submitting EUAs according to the amount of verified emissions, installations could submit alternative offsets from the Kyoto Protocol during Phase II, but only to a limited extent. These alternative offsets were Emission Reduction Units (ERU) generated from Joint Implementation (JI) activities or Certified Emissions Reductions (CERs) generated from the Clean Development Mechanism (CDM) project activity. In Phase IV, the use of international credits will no longer be allowed.
The initial target – to reduce ETS-covered emissions in CO2 equivalent by 21% by 2020 as compared to 2005 levels – was already over-achieved during the second period. GHG emissions from ETS sectors decreased by 24% between 2004 and 2014 (European Environment Agency, Citation2015). Under the Commission’s proposal, ETS installations should now achieve a 43% emission reduction by 2030 compared to 2005 (EU Commission, Citation2015c; European Environment Agency, Citation2015).
3. Literature overview on competitiveness effects of the EU ETS
We will now give a brief overview on empirical ex post evaluation studies on the EU ETS. More details on the competitiveness and other firm-level effects of environmental policies can also be found in Venmans (Citation2012), Arlinghaus (Citation2015) and Martin et al. (Citation2016).
The empirical ex post literature on firm-level effects of the EU ETS finds hardly any indication for negative competitiveness effects for the first two trading periods. Across ten large countries, Chan et al. (Citation2013) study firms in the power, cement, and iron and steel sectors, comparing ETS-regulated to non-ETS-regulated companies within each sector. Interestingly, they find no statistically significant negative effects on competitiveness – except in the power sector. Nor do they find significant impacts on employment in any of the studied sectors. This means that in all very energy-intensive sectors but one, there is a lack of negative competitiveness effects. Based on firm-level census data for the manufacturing industries, Wagner et al. (Citation2014) and Petrick and Wagner (Citation2014) compare regulated to non-regulated companies in France and in Germany, respectively. They find significant reductions in carbon emissions in both countries for the first half of Phase II. For Germany, no negative competitiveness effects can be detected, neither for employment nor for gross output or exports. The effects on gross output and exports in Germany might even be slightly positive. For France, the preliminary results show significant reductions in employment but no within-firm carbon leakage (Wagner et al., Citation2014). For the early period of 2004–2005, Anger and Oberndorfer (Citation2008) analyse regulated companies in Germany taking the ratio of EUAs to verified emissions as an explanatory variable of interest. This indicator for over-allocation shows no statistically significant effects on changes in firm revenue or in employment. However, their results could be biased by early abatement activities. For Lithuania – the most over-allocated country in the EU ETS – Jaraite and Di Maria (Citation2016) also find no significant economic effects on regulated firms. They stress that this result also implies that there have not been any huge windfall profits for these firms. Abrell et al. (Citation2011) empirically analyse manufacturing firms across the entire EU comparing regulated firms to firms from all non-regulated sectors. Their results show no statistically significant effects of the EU ETS on firms’ value added or profit margins. Still, for employment they detect a small but statistically significant effect of −0.9% for the first trading phase which appears to be driven by the non-metallic mineral sector. Identifying ETS participation only by sector, Commins, Lyons, Schiffbauer, and Tol (Citation2011) report statistically significant negative effects on total factor productivity (TFP) growth for the first period of the EU ETS. However, treatment identification in the two latter studies is based only on cross-sector differences and thus rather rough. When focusing on cross-firm comparisons instead, the literature shows hardly any negative effects (also see Arlinghaus, Citation2015; Martin et al., Citation2016).
Turning from manufacturing to more specific industrial sectors, Chan et al. (Citation2013) show that while unit material costs in the power sector have increased by 5% (Phase I) and 8% (Phase II), revenue has increased by a remarkable amount of 30%. Yu (Citation2013) analyses a large sample of Swedish energy firms for the first two years of the EU ETS. The study shows no significant impact of the introduction of the EU ETS on profitability in 2005 but a significant negative impact in 2006. For major European power companies, also the returns on the stock market appear to be positively correlated with EUA prices (Bushnell, Chong, & Mansur, Citation2013; Veith, Werner, & Zimmermann, Citation2009). However, the results of these two studies have to be treated with caution due to their small samples.
4. Why does the EU ETS not significantly affect firms’ competitiveness?
4.1. Hypothesis no. 1: free allocation
Our first hypothesis is that free permits, particularly when allocated according to grandfathering, have contributed to the zero impact on competitiveness. With grandfathering, firms receive permits for free based on their historical emissions, thus barely needing to buy any additional permits. Hence, additional costs from the EU ETS should be limited and competitiveness safeguarded.
When faced with the EU ETS regulation, firms have to either abate emissions or buy allowances. Therefore, firms traditionally consider environmental regulation an economic burden, as it increases production costs. Three types of costs associated with emissions trading can be distinguished (following Clò, Citation2010): abatement costs,Footnote6 the costs of buying emission allowances, and potentially higher electricity prices. Free allocation saves firms from bearing the cost of buying their permits on the carbon market and may thus help alleviate the potential negative impact on regulated plants.
Free allocation was the default and by far the most prevalent method during Phases I and II (2005–2012), and to a lesser extent also at the beginning of Phase III. The European Commission authorized EU member states to auction a maximum of 5% of their allowances in Phase I and up to 10% in the second trading period. Auctioning accounted for an annual average of 0.13% of certified emissions in Phase I (Ellerman & Buchner, Citation2007). In Phase III, free allocation represents 43% of the total amount of certificates (EU Commission, Citation2017) and is expected to remain at around 40% in Phase IV (Alberola et al., Citation2015).
Should it be of concern that emissions allowances are allocated for free? This allocation method is challenged by some economists (e.g. Cramton & Kerr, Citation2002; Hepburn, Grubb, Neuhoff, Matthes, & Tse, Citation2006). In particular, if firms receive just enough EUAs to cover their emissions for free, there are only a few transactions on the market. Indeed, trading was very low in Phase I (Betz & Schmidt, Citation2016). In consequence, the system could lack liquidity, and thus a proper price signal (Hepburn et al., Citation2006). Moreover, free allocation is often referred to as a subsidy in the literature (Böhringer & Lange, Citation2005; Jegou & Rubini, Citation2011; Neuhoff et al., Citation2006). Auctioning may be more effective than free allocation in minimizing abatement costs over the long run, because its positive price may induce greater investment in low-carbon technologies (Cramton & Kerr, Citation2002, p. 2; Milliman & Prince, Citation1989, Citation1992). Thus, from the viewpoint of dynamic efficiency, auctioning may be preferable to free allocation. Still, under free allocation, the opportunity costs of the emission certificates remain, thus also generating incentives for abatement and investment signals – as long as the price is positive (Requate & Unold, Citation2003).
In conclusion, free allocation was prevailing in the early period of the scheme. Since it saves firms from the cost of buying allowances, it has likely contributed to finding no negative competitiveness effects in this period.
In Phase III and IV the amount of free allocation is reduced, hence entailing a risk of short run negative competition effects due to the additional costs of buying emission allowances.
4.2. Hypothesis no. 2: over-allocation
Our second hypothesis is that the majority of regulated firms have received more allowances than their needs. In turn, this overall over-allocation situation and the resulting low carbon price, have eased compliance for all firms, thus explaining a non-significant impact on their competitiveness.
To what extent has over-allocation taken place since the implementation of the EU ETS? Over-allocation would mean that the majority of ETS firms have many more allowances than corresponding to their emissions. Under auctioning, over-allocation could be lower than under free allocation, as rational firms only buy as many allowances as they are required to submit. This argument holds as long as authorities withdraw unused allowances from the market. In the EU ETS firms are allowed to bank permits to subsequent periods since Phase II and may therefore buy more permits than needed, so as to anticipate future needs. There is a strong indication for over-allocation of allowances in the EU ETS for all three trading phases.
In the first trading period there has been an excess of (freely distributed) allowances at least during the first two years (Grubb, Azar, & Persson, Citation2005). In 2005 the whole market exhibited a surplus of 95 million tonnes CO2, corresponding to 4.5% of the allocated allowances (Kettner, Köppl, Schleicher, & Thenius, Citation2008). Ellerman and Buchner (Citation2008) stress that over-allocation could have its roots either in an under-estimation of abatement or an over-estimation of emissions ex ante. Also, in this first learning phase, regulatory authorities did not want to set too stringent caps to allow firms to have a gradual start (Woerdman, Citation2015). When the EU Commission released the complete version of verified emissions on 15 May 2006, the EUA price collapsed and was then considered too low to exploit a large abatement potential (Kettner et al., Citation2008). The low-carbon price reduced potential gains of selling EUAs of the apparently over-allocated majority of firms, but at the same time, reduced costs for those fewer sectors or installations that were short.
The power sector is the only one that used more allowances than it received for free during the first two phases (Abrell et al., Citation2011). It was short by about 3% in 2005 (Ellerman & Buchner, Citation2008). Most EU-15 countries provided a short allocation of EUAs to the power sector because it was hardly trade-exposed and governments believed that potential abatement was larger (Ellerman & Buchner, Citation2007; Kettner et al., Citation2008).
The second trading period was characterized by a fierce economic downturn. In consequence, emissions fell due to reduced economic activity, leaving a large excess of unused allowances (EU Commission, Citation2017; Haita, Citation2013). In 2008, verified emissions were 3% below the 2007 level (EU Commission, Citation2009). Although the economic downturn seems to have initiated the downward trend, there may be many other reasons for its continuing decline, such as the overlapping of different climate policies or the mild weather of the period (Haita, Citation2013). We also observe that the CER price started to decouple with the EUA price, making it cheaper for firms to buy international carbon offset credits rather than allowances (ibid). Pintos and Linares (Citation2018) document that the steel, ceramics and cement industries in Spain received more than double their emissions in free allowances in 2012.
What is important is the possibility of banking these unused allowances to the third trading period. In fact, it can be rational for firms to bank emission allowances to future periods in order to minimize abatement costs over time (Ellerman, Valero, & Zaklan, Citation2015). At the end of 2013, overcapacity reached 2 billion allowances (Carbon Market Watch, Citation2014; see ). This shows that banking entails the risk of extending a surplus of allowances to the subsequent period. According to Carbon Market Watch (Citation2014), this excess was further increased by the possibility of using international credit offsets, whose price was close to €0 in 2014 (at around €0.10) and thus lower than the allowance price (around 5€) during the same period.
Figure 1. The build-up of surplus in EU ETS by 2020. Source: Carbon Market Watch (Citation2014), p. 4.
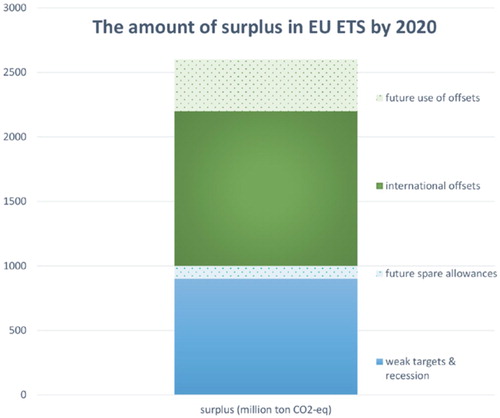
In 2015, at the start of the third trading period, emissions declined at a slower pace than the supply of EUAs, thus reducing the allowance surplus (European Environment Agency, Citation2016). Still, Phase III has to deal with a massive surplus of 1.7 billion permits, equivalent to almost one year of EU ETS emissions (European Environment Agency, Citation2017). To address this surplus, the Commission has postponed the auctioning of 900 million EUAs of Phase III until 2019–2020 (‘Backloading’, EU Reg. 176/2014), which will be added to a new Market Stability Reserve (MSR), starting in 2019 (Decision 2015/1814, Art. 1).
Also, while the new benchmark rules of the period were meant to reduce the allocations, it is argued that at least for some very heterogeneous sectors (e.g. pulp and paper industry; Stenqvist & Åhman, Citation2016) over-allocation is likely to be intensified due to benchmark misspecification.
Another important characteristic of the third trading period is the application of exemption rules to sectors with a high risk of relocation. This may lead to an overcompensation of these sectors deemed at risk. Martin et al. (Citation2014a) show that for most firms, the propensity to relocate does not fluctuate with the amount of free certificates. In turn, this finding implies that these firms are overcompensated with free permits (ibid.).
Phase IV will likely also be characterized by an allowances surplus, i.e. a low carbon price. According to projections by the European Environment Agency, the MSR will not be able to absorb the surplus before 2029, i.e. the end of Phase IV. Also, Perino and Willner (Citation2017) argue that postponing permit auction using the MSR only increases short-term scarcity but lowers long-term prices. Finally, governments are implementing abatement subsidies and other renewable energy policies (Löfgren, Wråke, Hagberg, & Roth, Citation2014), partly due to the EU-20-20-20 strategy and lack of adoption of green technologies (see section 4.5). These additional efforts outside the EU ETS could cause ‘over-abatement’ and thus over-allocation (see Abrell & Weigt, Citation2008; Vailles et al., Citation2017).
Summing up, we document substantial over-allocation for all three phases. This means that firms can sell their excess permits and thus increase their profitability, all the more so if they received these permits for free. As oversupply causes prices to fall, other firms benefit from cheap allowances on the carbon market. In addition, the low price of emission allowances reduces the scope of feasible abatement options. Hence, we support the over-allocation hypothesis for explaining no significant impact of the EU ETS on firms’ competitiveness.
4.3. Hypothesis no. 3: cost pass-through
This hypothesis states that regulated firms could pass EU ETS compliance costs onto consumers without significant impact on their market shares, therefore avoiding any negative consequence of the scheme on their profitability.
Consumers may have to pay for emissions reductions under a carbon trading scheme if firms can pass on the trading scheme’s costs. On top of abating emissions at zero costs, firms may also incur windfall profits if either one of the following two conditions is fulfilled: First, in the case of free allocation of emissions allowances, if firms use marginal pricing to pass on the opportunity cost of the certificates to consumers; and second, under auctioning, if the pass-through rate is higher than 100%, i.e. the pass-through overcompensates for the cost of purchasing the certificates (e.g. Sijm, Neuhoff, & Chen, Citation2006). Theory suggests that firms integrate the opportunity costs and the auction costs in like manner. Thus, in both cases, the price increase for consumers should be the same (Fabra & Reguant, Citation2014; Klemperer, Citation2008; Sorrell & Sijm, Citation2003). However, Wang and Zhou (Citation2017) show theoretically that benchmarking would allow lower pass-through rates (PTRs) than other allocation methods. The PTR as well as the potential of increasing profitability depends on the market structure, namely on the number of competitors as well as on the demand and supply price elasticity (for details see Sijm, Chen, & Hobbs, Citation2012). In addition, price rigidities are another potential source of incompleteness of passing through costs (Fabra & Reguant, Citation2014).
If firms cannot pass-through the costs of the EU ETS, they may have to decrease profit margins or may decide to exit the market and / or relocate (Alexeeva-Talebi, Citation2010). However, the literature shows no negative effect on competitiveness and we find no evidence of carbon leakage (see section 4.6). These negative effects may arise later if consumers’ negative response to increased prices is heavily lagged. Until then, evidence of pass-through represents evidence of increased profitability, when permits are freely allocated.
The energy sector is a special case with respect to cost pass-through ability for two main reasons. First, electricity distribution is based on a national grid structure, which prevents most international companies from competing (Clò, Citation2010). Therefore, many power firms used to have a historical monopoly in delivering electricity implying a strong market position, especially in retail markets (EU Commission, Citation2011; Veith et al., Citation2009). Second, demand for electricity is highly price inelastic, with even lower price elasticity for households than for industry (Fan & Hyndman, Citation2011; Filippini, Citation1999; Filippini & Pachauri, Citation2004).
High PTRs in the power sector are confirmed empirically for several countries. For Spain, for the period 2004 to 2006, Fabra and Reguant (Citation2014) find that carbon costs were almost fully transferred to final prices with an average PTR of 80%. Sijm et al. (Citation2006) calculate empirical PTRs between 60% and 117% for 2005 for Germany. For the Netherlands, they find PTRs between 64% and 81%. Another indication for windfall profits due to high PTRs in the power sector is the positive evaluation of increasing EUA prices on the stock market (Bushnell et al., Citation2013; Oberndorfer, Citation2009; Veith et al., Citation2009). These studies reveal that financial markets expect firms to pass compliance costs through to consumers and expect power generators to benefit from the regulation.
On top of this, the electricity sector may benefit from an asymmetric cost pass-through according to which price increases are passed on to consumers while price decreases may not (Mokinski & Wölfing, Citation2014; Oberndorfer, Alexeeva-Talebi, & Löschel, Citation2010; Zachmann & Von Hirschhausen, Citation2008). Thus, electricity producers may largely benefit from increased prices.
Windfall profits for the UK power generation sector were estimated to reach about £800 m/year during Phase I (WWF, Citation2005). In Phase III, the power sector now has to buy emissions certificates via auctioning, except in eight countries. The introduction of auctioning may substantially reduce windfall profits in the power sector. Finally, public authorities may intervene to limit cost pass-through.
Importantly, rising electricity prices can have indirect effects on other sectors of the economy. If regulated and non-regulated manufacturing industries are equally affected by rising electricity prices, this could explain the absence of any significant differences in terms of competitiveness between these two groups – at least for this indirect channel. However, and in contrast to the power sector, many manufacturing industries may be more exposed to competition. Therefore, manufacturing industries may be at risk if they increase output prices compared to non-regulated competitors.
We now turn to analyse several specific sectors within manufacturing. Empirical studies of the refining industry show PTRs of about 100%, i.e. full cost pass-through (Alexeeva-Talebi, Citation2011; De Bruyn, Markowska, de Jong, & Bles, Citation2010; Oberndorfer et al., Citation2010). Overall, European refineries appear to have benefited from large profits in the first trading period, be it by passing through the opportunity costs of EUAs or by selling their allowance surplus.
Substantial windfall profits have also been documented for the iron and steel industry (basic metals). De Bruyn et al. (Citation2010) estimate that refineries as well as iron and steel industries may have earned up to €14 billion of profits in total between 2005 and 2008, by fully passing through their costs (also see Demailly & Quirion, Citation2008). Moreover, the iron and steel sector is often referred to as a ‘carbon fat cat’ (Elsworth, Worthington, Buick, & Craston, Citation2011; Morris & Worthington, Citation2010), implying that it receives a substantial amount of allowances at no cost. In 2011, the ten highest emitting iron and steel companies had a surplus of 172 million allowances that is estimated to represent €2.9 billion (Elsworth et al., Citation2011).
Within the non-mineral branches, Alexeeva-Talebi (Citation2010) estimates that PTRs vary between 24% (other glass) and >60% (hollow glass). Oberndorfer et al. (Citation2010) find PTRs for the UK glass industry to be 0% (container glass) and 20–25% (hollow glass). Furthermore, the PTR is up to 40% for ceramic bricks and higher than 100% for ceramic goods (ibid.).
Within the chemical industry, production processes are very heterogeneous as De Bruyn et al. (Citation2010) argue. Therefore, impacts of regulation may widely vary within this sector. Oberndorfer et al. (Citation2010) find PTRs of 50% (ammonium nitrate) and 100% (low density polyethylene), using data from the UK, and wider European data when available. De Bruyn et al. (Citation2010) find the PTR of chemicals to vary from 33% to 100% across selected products. However, they are concerned that it may be the result of the significant cost pass-through of refineries (see above) and of specific chemicals (suppliers). Accordingly, the studied chemical industries themselves may not benefit from increased prices, but rather the suppliers do so.
In sum, due to high PTRs in some selected sectors, some firms have increased profits due to the EU ETS. Other sectors – especially those exposed to international trading – could hardly pass through the additional costs from the EU ETS to consumers, but these sectors are protected by the carbon leakage list. Thus, overall, cost pass-through implies additional benefits rather than additional costs for regulated firms. Accordingly, cost pass-through, especially when combined with free allocation, may strongly contribute to the finding of zero competitiveness effects for the average firm.
4.4. Hypothesis no. 4: low share of energy costs
Our fourth hypothesis is that energy costs represent a low share of total production costs and therefore, an increase of energy costs will unlikely have a strong impact on firms’ competitiveness.
We show that energy cost shares are low in the aggregate. The European Commission estimates that energy costs made up a cost share of 4.6% in total production within the EU-27 in 2011 ().Footnote7
Figure 2. Energy cost shares in basic prices (in % of gross output). Source: European Competitiveness Report (Citation2014), p. 194.
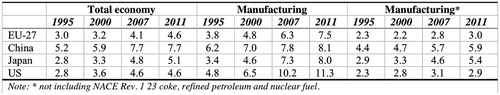
Besides, not only is the share of energy costs low in European manufacturing industries, but it is on average even lower than those of foreign competitors, such as China, Japan and the US (). In addition, the increase in the energy cost share over time appears to have been slower in Europe than in its main competitor countries. This suggests that European manufacturing seems to perform well in terms of competitiveness relative to its major competitors, on average.Footnote8
Furthermore, the European Commission analyses the relationship between the energy cost share and exports at the NACE-2-digit industry levelFootnote9 in 21 EU countries (European Competitiveness Report, Citation2014, p. 203 f.). According to their results, a one percentage point increase in the energy cost share correlates with a 0.8% reduction in exports (European Competitiveness Report, Citation2014, Table 6.9, p. 206). Considering the fact that energy cost share has increased by less than one percentage point on average for manufacturing (excluding coke) in the EU-27 for the period from 1995 to 2011, this correlation seems negligible. For energy-intensive industries, this relation is not statistically significant implying that increases in energy cost shares are actually irrelevant in these sectors.
The share of energy costs in gross value added (GVA) is generally higher than in gross output. The European Commission (Citation2014b) estimates real energy costs to amount to about 10% of value added for the manufacturing sector in the EU-27. This share increased only slightly between 1995 and 2011Footnote10 (EU Commission, Citation2014b). Besides, if energy cost increases due to the EU ETS are important in proportion to GVA, the concerned sectors should benefit from the exemption rules (see section 2).
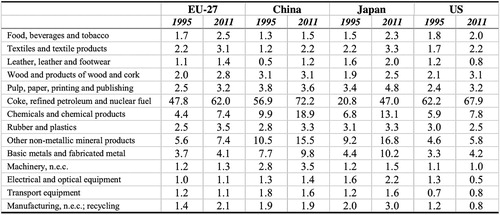
It is, however, important to turn away from looking at average numbers and consider the heterogeneities across sectors as they may differ substantially (). Data provided by the European Union show that energy cost shares are low in many manufacturing industries but stand out in the manufacturing of coke, refined petroleum and nuclear fuel amounting to 62% of the sector’s gross output in 2011 (see ). Therefore, this sector may be more exposed to energy cost increases (e.g. exposure to the EU ETS). However, emission allowance costs also represent a very modest share of the total production costs of the European refining industry, estimated at about 2% (Alexeeva-Talebi, Citation2011). In addition, this sector is on the carbon leakage list, that is, it benefits from free allocation, and appears to be able to achieve full pass-through (see section 4.3).
Figure 3. Energy cost shares by manufacturing industry in basic prices (in % of gross output). Source: European Competitiveness Report (Citation2014), p. 195.
In conclusion, energy cost shares appear rather low for most industries when considering aggregate values. However, this may hide a more unequal distribution at the individual firm level. In particular, there is an indication that transaction costs (internal costs, capital costs, consultancy and trading costs; see Betz & Schmidt, Citation2016; Jaraite, Convery, & Di Maria, Citation2010), as well as costs for MRV of emissions (see Heindl, Citation2017) in the EU ETS vary strongly across firm size in a way that affects small and medium sized firms most seriously. At the same time, small and medium sized enterprises tend to be less energy intensive and could display energy cost shares below average. Hence, firm size differences need to be further investigated. Still, for the average firm, energy costs and their increases due to the EU ETS are likely very small. Accordingly, this hypothesis may largely explain finding a zero competitiveness impact for the EU ETS. In particular, this result is empirically supported by the European Competitiveness report of 2014 for energy-intensive firms, where competitiveness performances are measured by exports.
4.5. Hypothesis no. 5: innovation
This last hypothesis consists of stating that the EU ETS, by pricing carbon, has led firms to adopt energy-efficient equipment and to innovate, which in turn has offset costs induced by the EU ETS, and even increased the competitiveness of regulated firms relative to non-regulated firms.
Can the EU ETS induce innovation in such a way that it increases competitiveness? According to the seminal Porter Hypothesis, ‘properly designed environmental standards can trigger innovation that may partially or more than fully offset the costs of complying with them’ (Porter & Van der Linde, Citation1995, p. 98; also see Porter, Citation1991). Environmental regulation can limit resource misuse and enhance resource productivity (Ambec, Cohen, Elgie, & Lanoie, Citation2013). Hence, clean innovation and thus improved productivity may offer an absolute advantage over non-regulated competitors. Still, Porter and Van der Linde (Citation1995) emphasize that green policies need to be ‘well-crafted’ and stringent enough to induce innovative investments.
Innovation and investment in low-carbon technologies are essential to influence long-term abatement and create a sustainable low-carbon path (Calel & Dechezleprêtre, Citation2016; Martin, Muûls, & Wagner, Citation2013; Pizer & Popp, Citation2008). There may be a first mover advantage for ‘green’ technologies (Beise & Rennings, Citation2005; Fankhauser et al., Citation2013; Oberndorfer & Rennings, Citation2006). For these reasons, we would expect a positive effect from the EU ETS on firms’ economic performance.
There is a large amount of literature on the innovation effects of environmental policies in general (Acemoglu, Aghion, Bursztyn, & Hemous, Citation2012; Ambec et al., Citation2013; Brunnermeier & Cohen, Citation2003; Gagelmann & Frondel, Citation2005; Hamamoto, Citation2006; Jaffe & Palmer, Citation1997; for a review see Popp, Citation2010). For the EU ETS in particular, Martin et al. (Citation2013) show that regulated sectors facing a more binding constraint are more likely to innovate. First, they demonstrate that firms expecting higher stringency in Phase III display a higher propensity for innovating. Above a certain threshold of carbon intensity or trade intensity (or a combination of both), firms are exempted from auctioning and the authors observe a jump in innovation right after the threshold. Therefore, they conclude that a lower constraint leads to less clean innovation. This result is in line with other researchers stating that an overly generous allocation of free permits may reduce incentives to invest in new technologies (Schleich & Betz, Citation2005).
In order to induce investments for innovation, a high carbon price is considered necessary (Popp, Citation2002). The target carbon price is often pinpointed at about €30 per tonne of CO2 (e.g. Ares, Citation2014). However, the EUA price has not been higher than €10 since 2013. The European Commission is concerned that the low price may prevent investments in low-carbon technologies and could even create carbon lock-in (EU Commission, Citation2014a). Moreover, its continuing declining trend along with its volatility may not provide long-term credibility for a future high carbon price, which is necessary for stimulating green investment decisions (Laing, Sato, Grubb, & Comberti, Citation2013).
The lack of stringency and the uncertainty characterizing the EU ETS in its early phase may have led firms to adopt a wait-and-see strategy, that is, prudent investment behaviour (Pontoglio, Citation2010). Borghesi, Cainelli, and Mazzanti (Citation2012), and Löfgren et al. (Citation2014) for Swedish industry, conclude that the scheme was not strict enough to stimulate the adoption of carbon reduction technologies. According to Borghesi et al. (Citation2012), the system rather triggered investments for environmental innovations on the consumption side that are less radical and cheaper than innovations on the production side. Rogge, Schneider, and Hoffmann (Citation2011) add the important role of other contextual factors. Calel and Dechezleprêtre (Citation2016) do not find evidence of the EU ETS causing spill-over effects on third parties’ patenting activity, implying a limited scope of innovation effects, so far.
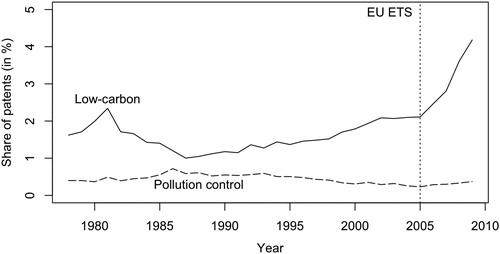
However, it seems that at least a small number of regulated firms reacted strongly to new constraints under the EU ETS. Petsonk and Cozijnsen (Citation2007) point out that low-carbon solutions were developed at an early stage. A structural break of low-carbon patenting is observed in 2005, at the start of the EU-ETS (). Calel and Dechezleprêtre (Citation2016) investigate whether this is a consequence of the EU ETS applying a difference-in-difference design to a large sample of matched EU ETS firms. The evidence shows that the system boosted low-carbon patenting by 36.2% among regulated firms relative to non-regulated ones. This percentage drops to 8.1% when extrapolating results to the whole non-matched sample of EU ETS firms, covering 80% of regulated emissions. In all, the EU ETS accounts for only 1% of the surge in low-carbon patenting, depicted in . Interestingly, the disaggregated level of data shows the strong reaction of a small group of firms. In parallel, they show that the EU ETS did not crowd out patenting for other technologies and even encouraged it moderately. Anderson, Convery, and Di Maria (Citation2011) surveyed Irish EU ETS firms during the first phase and find that the system stimulated technological change and raised awareness about emissions reduction possibilities, despite decreasing carbon prices and uncertainty.
Figure 4. Share of low-carbon patents in total patents filed with the European Patent Office (1978–2009). Source: Calel and Dechezleprêtre (Citation2016), p. 177.
In conclusion, the empirical findings suggest that the innovation behaviour of regulated firms attributable to the EU ETS has been limited so far. However, the ex-post literature can so far only measure effects on a rather short-term scale, whereas innovations may easily take a decade or more to unfold. Thus, long-term effects may only be detected later. Still, this finding implies that the innovation hypothesis is not likely to contribute significantly to the result of finding no harmful effect on firms’ competitiveness in Phases I and II. In addition, the results imply that expectations on the stringency of the scheme matter for innovation effects – an aspect that will be relevant for future phases.
4.6. Further hypotheses
There could be further economic channels explaining why there have been no negative competitiveness effects of the EU ETS on firm-level economic performance. For these following arguments, there is, however, hardly any empirical evidence and therefore we keep the discussion short.
Abatement costs could have been lower than expected, especially due to energy efficiency and renewable energy policies (see section 4.2). In that case, firms would have faced unexpectedly low costs of reducing emissions, which might explain not finding significant effects on economic performance. However, firms themselves are often unaware of their abatement costs (Engels, Citation2009; also see Martin et al., Citation2016). Moreover, the KfW/ZEW-CO2-Panel repeatedly reports very low shares of ETS firms whose abatement activities are driven by the goal of emissions reduction (Brockmann, Heindl, Löschel, Lutz, & Schumacher, Citation2012; Detken et al., Citation2009; Gallier, Lutz, Brockmann, & Dieckhöner, Citation2014, Citation2015; Löschel et al., Citation2010, Citation2011, Citation2013; Osberghaus, Heindl, Sommerfeld, & Höfling, Citation2016). Instead, emissions reductions usually occur as a side effect of measures intended to, for example, reduce production costs. While these survey results do not allow conclusions about the level of abatement costs, they show that abatement is rarely the main driver of emissions reduction.
Another argument is related to the restricted entry of competitors: A large-scale environmental regulation may substantially increase the sunk costs for new entrants, deterring them to come into the market (Ryan, Citation2012). These sunk costs would include costs for learning about the requirements of the EU ETS for entering into the allocation process, as well as entry costs for MRV of emissions. If these costs were high, firms already under the ETS would rather be protected from new entrants to the EU market. In addition, the EU is generally characterized by high environmental standards which may also restrict the entry of foreign competitors (De Bruyn et al., Citation2010). This topic has not yet been much investigated empirically for the EU ETS. If anything, this argument would raise the competitiveness of regulated firms.
Furthermore, some ‘dirty’ firms may have faced such high environmental costs from the EU ETS that they had to exit the market. Similarly, multinational corporations with production units could delocalize their production outside the EU. In the end, only firms who were competitive in a clean environment could have kept their business running. In the aggregate, this would result in a more productive and cleaner business environment. This may explain finding no negative competitiveness effects on firms that have stayed in the market. If firms or subsidiaries exit the market in order to relocate to places where environmental regulation is less restrictive (‘pollution havens’), this is called the Pollution Haven Hypothesis (PHH; e.g. see Cole, Citation2004; Eskeland & Harrison, Citation2003; Kozluk & Timiliotis, Citation2016; Millimet & Roy, Citation2011; Wagner & Timmins, Citation2008; Yoon & Heshmati, Citation2017). In the case of the EU ETS, the PHH is supported if significant evidence of carbon leakage attributable to the EU ETS is established. If firms were to start emitting more once relocated, we could observe an increase in total emissions worldwide, making the EU ETS an ineffective mechanism. No empirical evidence of carbon leakage or firm closures attributable due to the EU ETS has been documented so far. Preliminary results using emissions data by Dechezleprêtre, Gennaioli, Martin, and Muûls (Citation2014) and Wagner et al. (Citation2014) find no supportive evidence for carbon leakage within companies which have non-treated plants during Phase II. Besides emissions, indirect measures of carbon leakage may be used. While short-term leakage is usually detected through increased imports, long-term production relocation may be analysed through outbound foreign direct investments (FDI, see Koch & Basse Mama, Citation2016). Several trade flow analyses show that the carbon price level did not lead to any significant carbon leakage in the European primary aluminium sector (Sartor, Citation2012), in the cement and steel sectors (Boutabba & Lardic, Citation2017; Branger, Quirion, & Chevallier, Citation2017) or in manufacturing sectorsFootnote11 (Naegele & Zaklan, Citation2017). Focusing on German and Italian multinationals, respectively, Koch and Basse Mama (Citation2016) and Borghesi, Franco, and Marin (Citation2016) show that the EU ETS did not lead to relocation through outbound FDI for the average firm. However, both studies reveal that particular sub-groups of enterprises did significantly react to the EU ETS stringency. Still, overall, the scarce evidence so far shows no evidence of carbon leakage for the average firm, and thus contradicts the PHH.
5. Conclusions
Emissions trading is generally expected to impose costs on firms because these have to either abate emissions or to buy the required allowances. This would imply an increase in production costs for ETS-regulated relative to non-regulated firms. As a consequence, regulated firms could lose market shares to non-regulated firms, e.g. abroad. However, there appears to be no significant negative effects of the EU ETS on firm-level competitiveness during Phase I and II as documented by the empirical ex post literature (Arlinghaus, Citation2015; Martin et al., Citation2016; Venmans, Citation2012). Also, there is no indication so far of a relevant amount of carbon leakage (Dechezleprêtre et al., Citation2014; European Competitiveness Report, Citation2014). Therefore, this paper aims to explain the channels that may be relevant for finding this zero effect on competitiveness. We find the following:
First, most emissions allowances in the EU ETS have been allocated for free by means of grandfathering, at least in the first two trading phases. Only a small share of certificates has been auctioned and this share increases only slowly. Free allocation saves firms from bearing the cost of buying their permits. Hence, free allocation can help to explain finding no competitiveness effects for Phase I and II. This may change for later phases due to the growing importance of auctioning.
Second, we document over-allocation of emission allowances for all three phases. Under over-allocation, the majority of firms have more allowances than they need, and can therefore generate revenues from the sale of their allowance surplus. The few installations that are short can benefit from a very low carbon price, a consequence of oversupply, and therefore comply with the EU ETS at least costs. On top of this, over-allocation combined with free allocation and a positive allowance price can generate extra profits for firms. Due to the large oversupply of allowances in Phase III, we expect no significant negative effects on competitiveness for this period.
Third, firms in certain regulated sectors have been able to pass-through the (opportunity) costs of the EU ETS onto their customers. Particularly high PTRs have been documented for the power sector thanks to its particular market structure. Within energy-intense manufacturing, some sectors display high PTRs (e.g. refining and iron and steel) while others do not (some sub-sectors from the chemical and from the pulp and paper industry), likely due to high international competition. In cases of high PTR together with free allocation of EUAs, regulated firms are able to reap windfall profits. In this case, opportunity costs are borne by end users, such as households and industry. Consumers may substitute away from more expensive ETS goods, but so far, we do not find indication on this in the literature.
Fourth, energy costs make up about 5% of gross output on average. This may explain why increases in these costs via the carbon price may hardly affect firms’ competitiveness on average. Some specific firms or sectors may still display high energy cost shares, such as the refining sector which is, however, protected by the carbon leakage list. The fact that energy-intensive sectors exhibit not statistically significant negative effects from the EU ETS on exports further supports the point that competitiveness has not been hurt so far. As long as the increase in energy prices affects regulated and non-regulated firms alike, we expect to see no competitiveness effects within the EU for Phase III, either. Nevertheless, increased carbon leakage is possible in Phase III and should be investigated further.
Note that if hypotheses 3 and 4 were not to hold for some firms – i.e. they fail to pass through costs because of fierce international competition or face a high share of energy costs – they should be protected by the carbon leakage list. Thus, they are not directly affected by the EU ETS.
Fifth, we check whether innovation is stimulated in such a way by the EU ETS so as to overcompensate otherwise negative competitiveness effects. So far only limited innovation effects could be detected likely because of the low price for EUA certificates, caused by the large oversupply of allowances. However, due to the long time horizon which innovations need to unfold, innovations and therefore positive effects of the EU ETS on competitiveness may arise in the future.
These findings show that the EU ETS has effectively reduced GHG emissions in the regulated sectors without incurring substantial competitiveness effects. Put differently, firms abated emissions without those abatement activities showing up negatively in competitiveness. Most likely, the design of the scheme so far (over-allocation, mostly for free) has prevented the negative effects for firms on average. While this is good news for the current level of European competitiveness, could this mean short-term gains for long-term pain? A low carbon price undermines incentives for early investments in low-carbon technology and could affect the system’s dynamic efficiency (minimization of long run abatement costs). Therefore, negative competitiveness effects may just arise later, when more ambitious abatement will be required. At the same time, Vailles et al. (Citation2017) argue that in Phase IV, energy efficiency and renewable energy policies will enable emissions reductions that are already sufficient to meet the EU ETS target. Finally, other elements suggest that firms would be capable of absorbing higher carbon prices, as demonstrated by their ability to pass costs onto consumers and due to the low burden of energy costs on average. Therefore, we conclude that strong negative effects on competitiveness under the current and near-future design of the scheme are unlikely. In consequence, this means that policymakers need not implement further relief for the average regulated firm.
We recommend several routes for future research. Naturally, there is scope for investigating the channels discussed here in more detail. Most importantly, we see a lack of research focusing on potential firms’ closure and carbon leakage. So far, empirical research has focused on within-firms leakage so that a serious gap exists for between-markets leakage. In parallel, demand-side responses to cost-pass through behaviours need to be further investigated. Finally, researchers should focus on firm size differences, in case small and medium enterprises are more heavily affected by the scheme. Concerning methodological issues, the ex post literature should attempt to deal with the empirical challenges of identifying a causal effect. The weaknesses of most econometric approaches so far lie in the identification of a suitable control group as well as the interactions between the EU ETS and other policies. Indirect spillovers between industries through rising electricity prices are also an issue that should be targeted. Last but not least, ex post results for Phase III are still pending. As a prerequisite for all of these, better data needs to be provided, such as firm-level administrative data sets preferably on the full universe of enterprises. For this, full support of policymakers, research organizations and data providers is required.
Acknowledgements
We thank Ulrich Wagner, Aleksandar Zaklan and seminar participants at ZEW for helpful comments, in particular Robert Germeshausen, Kathrine von Graevenitz, Peter Heindl, Benjamin Lutz and Philipp Massier, as well as three anonymous reviewers and the editor. Financial support by ZEW within the project ‘Employment Effects of Environmental Regulation’ is gratefully acknowledged. All errors remain the authors’ responsibility.
Disclosure statement
No potential conflict of interest was reported by the authors.
Additional information
Funding
Notes
1 Country specific National Allocation Plans (NAPs) were used to define the cap as well as the distribution of allowances across individual installations in Phase I and II. Since Phase III, an EU wide cap has been replacing the NAPs system thus centralizing the allocation system (Ellerman et al., Citation2016; Kruger, Oates, & Pizer, Citation2007).
2 The benchmark value is product-specific and equals the average CO2 emissions of the best performing 10% of installations for this product (EU Commission, Citation2015b, p. 40).
3 We use the definition of the European Parliament for carbon leakage: ‘an increase in greenhouse gas emissions in third countries where industry would not be subject to comparable carbon constraints’ (i.e. constraints imposed by the EU ETS; Directive Citation2009/29/EC, Paragraph 24).
4 According to Directive Citation2009/29/EC (Article 10a), a sector or sub-sector is deemed to be exposed to a significant risk of carbon leakage if it meets one of the following criteria:
direct and indirect costs induced by the implementation of the directive increase production cost, calculated as a proportion of the gross value added, by at least 5%; and the sector's trade intensity with non-EU countries is above 10%.
the sum of direct and indirect additional costs of the regulation is above 30%.
the non-EU trade intensity is larger than 30%.
5 These sectors are defined according to the NACE classification, i.e. the statistical classification of economic activities in Europe, at the four-digit level, which is the most detailed level of classification.
6 E.g., firms may buy new equipment to adopt an eco-friendly production process and to control their level of pollution (Gray, Citation2015).
7 Energy cost shares are calculated in basic prices (excluding taxes and margin) as a percentage of gross output.
8 Alternatively, this trend could be an outcome of the regulation where energy intense firms move outside the EU but these aggregated numbers are not sufficient to judge whether this dynamic behaviour has indeed taken place.
9 NACE is the statistical classification of economic activities used in the EU. It goes from a 1-digit detail (aggregated sectors) to a 4-digit level (more detailed sectors). A 2-digit level is therefore a low level of disaggregation of sectors, meaning that the authors of the European Competitiveness report could not go very deep in analysing sectors’ heterogeneities and have rather measured an average impact.
10 When excluding coke, refined petrol & nuclear fuels.
11 Cement; Chemicals, rubber, plastic; Iron and steel; Metal products; Paper products; Petroleum and coal products; Other metals; Other minerals.
References
- Abrell, J., Ndoye, F. A., & Zachmann, G. (2011). Assessing the impact of the EU ETS using firm level data (Bruegel Working Paper 2011/08). Brussels. Retrieved from http://bruegel.org/wp-content/uploads/imported/publications/WP_2011_08_ETS_01.pdf
- Abrell, J., & Weigt, H. (2008). The interaction of emissions trading and renewable energy promotion (Dresden University of Technology Working Paper No. WP-EGW-05). Retrieved from SSRN: https://ssrn.com/abstract=1317310
- Acemoglu, D., Aghion, P., Bursztyn, L., & Hemous, D. (2012). The environment and directed technical change. American Economic Review, 102(1), 131–166. doi: 10.1257/aer.102.1.131
- Alberola, E., Afriat, M., Cail, S., Cassisa, S., Coussy, P., Dahan, L., … Vaidyula, M. (2015). Carbon pricing and carbon leakage issues in Phase IV of the EU ETS, Chapter 3. In Exploring the EU ETS beyond 2020: A first assessment of the EU Commission’s proposal for Phase IV of the EU ETS (2021-2030). Retrieved from https://www.i4ce.org/download/copec-report/?wpdmdl=11830
- Alexeeva-Talebi, V. (2010). Cost pass-through in strategic oligopoly: Sectoral evidence for the EU ETS (ZEW Discussion Paper 10-056). Mannheim. Retrieved from ftp://ftp.zew.de/pub/zew-docs/dp/dp10056.pdf
- Alexeeva-Talebi, V. (2011). Cost pass-through of the EU emissions allowances: Examining the European petroleum markets. Energy Economics, 33, S75–S83. doi: 10.1016/j.eneco.2011.07.029
- Ambec, S., Cohen, M. A., Elgie, S., & Lanoie, P. (2013). The porter hypothesis at 20: Can environmental regulation enhance innovation and competitiveness? Review of Environmental Economics and Policy, 7(1), 2–22. doi: 10.1093/reep/res016
- Anderson, B., Convery, F., & Di Maria, C. (2011). Technological change and the EU ETS: The case of Ireland (IEFE Working Paper 43). Milano: IEFE – Centre for Research on Energy and Environmental Economics and Policy, Bocconi University.
- Anger, N., & Oberndorfer, U. (2008). Firm performance and employment in the EU emissions trading scheme: An empirical assessment for Germany. Energy Policy, 36(1), 12–22. doi: 10.1016/j.enpol.2007.09.007
- Ares, E. (2014). Carbon price floor. Parliament note. House of the Commons Library. Science and Environment Section. SN/SC/5927. London. Retrieved from http://researchbriefings.parliament.uk/ResearchBriefing/Summary/SN05927#fullreport
- Arlinghaus, J. (2015). Impact of carbon prices on indicators of competitiveness: A review of empirical findings (OECD Environment Working Paper 87). Paris: OECD. doi: 10.1787/5js37p21grzq-en
- Beise, M., & Rennings, K. (2005). Lead markets and regulation: A framework for analyzing the international diffusion of environmental innovations. Ecological Economics, 52(1), 5–17.
- Betz, R. A., & Schmidt, T. S. (2016). Transfer patterns in phase I of the EU Emissions Trading System: A first reality check based on cluster analysis. Climate Policy, 16(4), 474–495. doi: 10.1080/14693062.2015.1028319
- Böhringer, C., & Lange, A. (2005). On the design of optimal grandfathering schemes for emission allowances. European Economic Review, 49(8), 2041–2055. doi: 10.1016/j.euroecorev.2004.06.006
- Borghesi, S., Cainelli, G., & Mazzanti, M. (2012). The European emission trading scheme and environmental innovation diffusion: Empirical analyses using CIS data for Italy. Giornale degli Economisti et Annali die Economia, 71(1), 71–97.
- Borghesi, S., Franco, C., & Marin, G. (2016). Outward foreign direct investments: Pattern of Italian firms in the EU-ETS (SEEDS Working Paper).
- Boutabba, M. A., & Lardic, S. (2017). EU emissions trading scheme, competitiveness and carbon leakage: New evidence from cement and steel industries. Annals of Operations Research, 255(1), 47–61.
- Branger, F., Quirion, P., & Chevallier, J. (2017). Carbon leakage and competitiveness of cement and steel industries under the EU ETS: Much ado about nothing. The Energy Journal, 37(3), Retrieved from https://EconPapers.repec.org/RePEc:aen:journl:ej37-3-branger
- Brockmann, K. L., Heindl, P., Löschel, A., Lutz, B. J., & Schumacher, J. (2012). Kfw/ ZEW CO2 Barometer 2012, Anreizwirkung des EU-Emissionshandels auf Unternehmen gering – Klimapolitische Regulierung wenig relevant für Standortentscheidungen. Frankfurt am Main: KfW Bankengruppe. Retrieved from https://www.kfw.de/Download-Center/Konzernthemen/Research/PDF-Dokumente-CO2-Barometer/CO2-Barometer-2012-LF.pdf
- Brunnermeier, S. B., & Cohen, M. A. (2003). Determinants of environmental innovation in US manufacturing industries. Journal of Environmental Economics and Management, 45(2), 278–293. doi: 10.1016/S0095-0696(02)00058-X
- Bushnell, B. J., Chong, H., & Mansur, T. E. (2013). Profiting from regulation: Evidence from the European carbon market. American Economic Journal: Economic Policy, 5(4), 78–106. doi: 10.1257/pol.5.4.78
- Calel, R., & Dechezleprêtre, A. (2016). Environmental policy and directed technological change: Evidence from the European carbon market. Review of Economics and Statistics, 98(1), 173–191. doi: 10.1162/REST_a_00470
- Carbon Market Watch. (2014). What’s needed to fix the EU’s carbon market? Recommendations for the market stability reserve and future ETS reform proposals (Policy Briefing). Retrieved from http://carbonmarketwatch.org/wp-content/uploads/2014/07/ETS-POLICY-BRIEF-JULY-2014_final_1.pdf
- Chan, H. S., Li, S., & Zhang, F. (2013). Firm competitiveness and the European Union emissions trading scheme. Energy Policy, 63, 1056–1064. doi: 10.1016/j.enpol.2013.09.032
- Clò, S. (2010). Grandfathering, auctioning and carbon leakage: Assessing the inconsistencies of the new ETS directive. Energy Policy, 38(5), 2420–2430. doi: 10.1016/j.enpol.2009.12.035
- Cole, M. A. (2004). Trade, the pollution haven hypothesis and the environmental Kuznets curve: Examining the linkages. Ecological Economics, 48(1), 71–81.
- Commins, N., Lyons, S., Schiffbauer, M., & Tol, R. S. J. (2011). Climate policy and corporate behavior. The Energy Journal, 32(4), 51–68. doi: 10.5547/ISSN0195-6574-EJ-Vo132-No4-3
- Cramton, P., & Kerr, S. (2002). Tradeable carbon permit auctions: How and why to auction not grandfather. Energy Policy, 30(4), 333–345. doi: 10.1016/S0301-4215(01)00100-8
- De Bruyn, S., Markowska, A., de Jong, F., & Bles, M. (2010). Does the energy intensive industry obtain windfall profits through the EU ETS? In An econometric analysis for products from the refineries, iron and steel and chemical sectors. CE Delft. Retrieved from http://www.cef.nl/publicatie/does_the_energy_intensive_industry_obtain_windfall_profits_through_the_eu_ets/1038
- De Bruyn, S., Nelissen, D., & Koopman, M. (2013). Impact of recent developments in the EU ETS on the list of sectors deemed to be exposed to carbon leakage. CE DELFT. Retrieved from http://www.cedelft.eu/art/uploads/CE_Delft_7917_Carbon_leakage_future_EU_ETS_market_Final.pdf
- Dechezleprêtre, A., Gennaioli, C., Martin, R., & Muûls, M. (2014). Searching for carbon leaks in multinational companies (Centre for Climate Change Economics and Policy Working Paper No.187). Grantham Research Institute on Climate Change and the Environment. Retrieved from http://personal.lse.ac.uk/dechezle/Working-Paper-165-Dechezlepretre-et-al-2014.pdf
- Dechezleprêtre, A., & Sato, M. (2017). The impacts of environmental regulations on competitiveness. Review of Environmental Economics and Policy, 11(2), 183–206. doi: 10.1093/reep/rex013
- Demailly, D., & Quirion, P. (2008). European emission trading scheme and competitiveness: A case study on the iron and steel industry. Energy Economics, 30(4), 2009–2027. doi: 10.1016/j.eneco.2007.01.020
- Deschenes, O. (2014). Environmental regulations and labor markets: Balancing the benefits of environmental regulations for everyone and the costs to workers and firms. Bonn: IZA World of Labor. doi: 10.15185/izawol.22
- Detken, A., Löschel, A., Alexeeva-Talebi, A., Heindl, P., Lo, V., & Strunz, M. (2009). Kfw/ZEW CO2 barometer 2009, leaving the trial phase behind – preferences & strategies of German companies under the EU ETS. Frankfurt am Main: KfW Bankengruppe.
- Directive 2009/29/EC: Directive of the European parliament and of the council of 23 April 2009 amending Directive 2003/87/EC so as to improve and extend the greenhouse gas emission allowance trading scheme of the community.
- Ellerman, A. D., & Buchner, K. B. (2007). The European Union emissions trading scheme: Origins, allocation, and early results. Review of Environmental Economics and Policy, 1(1), 66–87. doi: 10.1093/reep/rem003
- Ellerman, A. D., & Buchner, K. B. (2008). Over-allocation of abatement? A preliminary analysis of the EU emissions trading scheme based on the 2005–2006 emissions data. Environmental and Resource Economics, 41(2), 267–287. doi: 10.1007/s10640-008-9191-2
- Ellerman, A. D., Marcantonini, C., & Zaklan, A. (2016). The European Union Emissions Trading System: Ten years and counting. Review of Environmental Economics and Policy, 10(1), 89–107.
- Ellerman, A. D., Valero, V., & Zaklan, A. (2015). An analysis of allowance banking in the EU ETS (Robert Schuman Centre for Advanced Studies Research Paper No. RSCAS, 29).
- Elsworth, R., Worthington, B., Buick, M., & Craston, P. (2011). Carbon fat cats 2011: The companies profiting from the EU emissions trading scheme. London: Sandbag. Retrieved from https://sandbag.org.uk/site_media/pdfs/reports/Sandbag_2011-06_fatcats.pdf
- Engels, A. (2009). The European emissions trading scheme: An exploratory study of how companies learn to account for carbon. Accounting, Organizations and Society, 34(3), 488–498. doi: 10.1016/j.aos.2008.08.005
- Eskeland, G. S., & Harrison, A. E. (2003). Moving to greener pastures? Multinationals and the pollution haven hypothesis. Journal of Development Economics, 70(1), 1–23.
- EU Commission. (2009). EU press release: Emissions trading: EU ETS emissions fall 3% in 2008. Retrieved from http://europa.eu/rapid/press-release_IP-09-794_en.htm?locale=en
- EU Commission. (2011). 2009–2010 report on progress in creating the internal gas and electricity market (Commission Staff Working Document). Brussels. Retrieved from https://ec.europa.eu/energy/sites/ener/files/documents/20100609_internal_market_report_2009_2010.pdf
- EU Commission. (2014a). Impact assessment. (Staff Working Document, Brussels, 22.1.2014, SWD(2014) 17). Retrieved from http://ec.europa.eu/clima/policies/ets/reform/docs/swd_2014_17_en.pdf
- EU Commission. (2014b). Energy economic developments in Europe. Part I “energy costs and competitiveness”. In European Economy 1/January 2014. Brussels. ISSN KC-AR-14-001-EN-N.
- EU Commission. (2015a). Report from the commission to the European parliament and the council. Climate action progress report, including the report on the functioning of the European carbon market and the report on the review of Directive 2009/31/EC on the geological storage of carbon dioxide. Brussels, COM(2015) 576.
- EU Commission. (2015b). EU ETS Handbook. DG Climate Action.
- EU Commission. (2015c). Proposal for a directive of the European parliament and of the council amending Directive 2003/87/EC to enhance cost-effective emission reductions and low- carbon investment. Brussels COM(2015) 337 final.
- EU Commission. (2016). The EU Emissions Trading System (EU ETS). ISBN 978-92-79-62396-7. doi: 10.2834/6083
- EU Commission. (2017). Report from the commission to the European parliament and the council: Report on the functioning of the European carbon market. Brussels, COM/2017/048 final.
- European Competitiveness Report. (2014). Retrieved from http://ec.europa.eu/growth/industry/competitiveness/reports/eu-competitiveness-report/index_en.htm
- European Environment Agency. (2015). Trends and projections in the EU ETS in 2015. The EU Emissions Trading System in numbers (European Environment Agency Technical Report No. 14). doi: 10.2800/472636
- European Environment Agency. (2016). Trends and projections in the EU ETS in 2016. The EU Emissions Trading System in numbers (European Environment Agency Technical Report No. 24). doi: 10.2800/71685
- European Environment Agency. (2017). Trends and projections in the EU ETS in 2017. The EU Emissions Trading System in numbers (European Environment Agency Technical Report No. 18). doi: 10.2800/425306
- Fabra, N., & Reguant, M. (2014). Pass-through of emissions costs in electricity markets. American Economic Review, 104(9), 2872–2899. doi: 10.1257/aer.104.9.2872
- Fan, S., & Hyndman, R. J. (2011). The price elasticity of electricity demand in South Australia. Energy Policy, 39(6), 3709–3719. doi: 10.1016/j.enpol.2011.03.080
- Fankhauser, S., Bowen, A., Calel, R., Dechezleprêtre, A., Grover, D., Rydge, J., & Sato, M. (2013). Who will win the green race? In search of environmental competitiveness and innovation. Global Environmental Change, 23(5), 902–913. doi: 10.1016/j.gloenvcha.2013.05.007
- Filippini, M. (1999). Swiss residential demand for electricity. Applied Economics Letters, 6(8), 533–538. doi: 10.1080/135048599352880
- Filippini, M., & Pachauri, S. (2004). Elasticities of electricity demand in urban Indian households. Energy Policy, 32(3), 429–436. doi: 10.1016/S0301-4215(02)00314-2
- Flues, F. S., & Thomas, A. (2015). The distributional effects of energy taxes (OECD Taxation Working Papers No. 23). Paris: OECD. doi: 10.1787/5js1qwkqqrbv-en
- Gagelmann, F., & Frondel, M. (2005). The impact of emission trading on innovation - science fiction or reality? European Environment, 15(4), 203–211. doi: 10.1002/eet.387
- Gallier, C., Heindl, P., Osberghaus, D., Brockmann, K. L., & Dieckhöner, C. (2015). Kfw/ZEW CO2 barometer 2015 – carbon edition: Ten years of emissions trading – strategies of German companies. Frankfurt am Main: KfW Bankengruppe. Retrieved from https://www.kfw.de/PDF/Download-Center/Konzernthemen/Research/PDF-Dokumente-CO2-Barometer/CO2-Barometer-2015-Carbon-Edition.pdf
- Gallier, C., Lutz, B. J., Brockmann, K. L., & Dieckhöner, C. (2014). Kfw/ZEW CO2 barometer 2014 – carbon edition, new phase, old problems. Frankfurt am Main: KfW Bankengruppe. Retrieved from https://www.kfw.de/PDF/Download-Center/Konzernthemen/Research/PDF-Dokumente-CO2-Barometer/CO2-Barometer-2014-Carbon-Edition.pdf
- Gray, W. B. (2015). Environmental regulations and business decisions: Environmental regulations impose costs on firms, affecting productivity and location but providing significant health benefits. Bonn: IZA World of Labor. Retrieved from http://wol.iza.org/articles/environmental-regulations-and-business-decisions.pdf
- Grubb, M., Azar, C., & Persson, U. M. (2005). Allowance allocation in the European Emissions Trading System: A commentary. Climate Policy, 5(1), 127–136. doi: 10.1080/14693062.2005.9685545
- Haita, C. (2013). The state of the EU carbon market (ICCG Reflection No. 14/2013). Retrieved from http://www.iccgov.org/wp-content/uploads/2015/05/14_Reflection_February_2013.pdf
- Hamamoto, M. (2006). Environmental regulation and the productivity of Japanese manufacturing industries. Resource and Energy Economics, 28(4), 299–312. doi: 10.1016/j.reseneeco.2005.11.001
- Hanoteau, J. (2014). Lobbying for carbon permits in Europe. Recherches économiques de Louvain, 80(1), 61–87. ISBN: 978280418893. doi: 10.3917/rel.801.0061
- Heindl, P. (2017). The impact of administrative transaction costs in the EU Emissions Trading System. Climate Policy, 17(3), 314–329. doi: 10.1080/14693062.2015.1110108
- Hepburn, C., Grubb, M., Neuhoff, K., Matthes, F., & Tse, M. (2006). Auctioning of EU ETS phase II allowances: How and why? Climate Policy, 6(1), 137–160. doi: 10.1080/14693062.2006.9685592
- Jaffe, A. B., & Palmer, K. (1997). Environmental regulation and innovation: A panel data study. Review of Economics and Statistics, 79(4), 610–619. doi: 10.1162/003465397557196
- Jaraite, J., Convery, F., & Di Maria, C. (2010). Transaction costs for firms in the EU ETS: Lessons from Ireland. Climate Policy, 10, 190–215. doi: 10.3763/cpol.2009.0659
- Jaraite, J., & Di Maria, C. (2016). Did the EU ETS make a difference? An empirical assessment using Lithuanian firm-level data. The Energy Journal, 37(1), 1–23. doi: 10.5547/01956574.37.2.jjar
- Jegou, I., & Rubini, L. (2011). The allocation of emission allowances free of charge: Legal and economic considerations (ICTSD Global Platform on Climate Change, Trade Policies and Sustainable Energy, Issue Paper No.14). Geneva: International Centre for Trade and Sustainable Development. Retrieved from http://ssrn.com/abstract=1914997
- Kettner, C., Köppl, A., Schleicher, S. P., & Thenius, G. (2008). Stringency and distribution in the EU emissions trading scheme: First evidence. Climate Policy, 8(1), 41–61. doi: 10.3763/cpol.2007.0394
- Klemperer, P. (2008). Permit auction will not affect prices. Letters. Financial Times. Retrieved from http://www.ft.com/cms/s/0/cdc05514-35bc-11dd-998d-0000779fd2ac.html#axzz4H0kNwx2f
- Koch, N., & Basse Mama, H. (2016). European climate policy and industrial relocation: Evidence from German multinational firms. Retrieved from SSRN: https://ssrn.com/abstract=2868283
- Kozluk, T., & Timiliotis, C. (2016). Do environmental policies affect global value chains? A new perspective on the pollution haven hypothesis (OECD Economics Department Working Papers). ISSN: 1815-1973 (online). doi: 10.1787/18151973
- Kruger, J., Oates, W. E., & Pizer, W. A. (2007). Decentralization in the EU emissions trading scheme and lessons for global policy. Review of Environmental Economics and Policy, 1, 112–133.
- Laing, T., Sato, M., Grubb, M., & Comberti, C. (2013). Assessing the effectiveness of the EU Emissions Trading System (Working Paper 126). Centre for Climate Change Economics and Policy. Retrieved from http://citeseerx.ist.psu.edu/viewdoc/download?doi=10.1.1.365.6508&rep=rep1&type=pdf
- Löfgren, Å, Wråke, M., Hagberg, T., & Roth, S. (2014). Why the EU ETS needs reforming: An empirical analysis of the impact on company investments. Climate Policy, 14(5), 537–558. doi: 10.1080/14693062.2014.864800
- Löschel, A., Brockmann, K. L., Heindl, P., Lutz, B. J., & Schumacher, J. (2011). Kfw/ZEW CO2 barometer 2011, Hoher Anpassungsbedarf im EU-Emissionshandel ab 2013 – deutliche Defizite bei der Vorbereitung in den Unternehmen. Frankfurt am Main: KfW Bankengruppe. Retrieved from https://www.kfw.de/Download-Center/Konzernthemen/Research/PDF-Dokumente-CO2-Barometer/CO2-Barometer-2011-LF.pdf
- Löschel, A., Gallier, C., Lutz, B. J., Brockmann, K. L., & Dieckhöner, C. (2013). Kfw/ZEW CO2 barometer 2013 – carbon edition, The EU emission trading scheme: Firm behavior during the crisis. Frankfurt am Main: KfW Bankengruppe. Retrieved from http://www.zew.de/de/publikationen/kfwzew-co2-barometer-2013-carbon-edition/
- Löschel, A., Kiehl, K., Heindl, P., Lo, V., Koschel, H., & Koesler, S. (2010). Kfw/ZEW CO2 barometer 2010, Effizienzpotenziale des Emissionshandels noch nicht ausgeschöpft – Strategien und Management deutscher Unternehmen. Frankfurt am Main: KfW Bankengruppe, ZEW. Retrieved from https://www.kfw.de/Download-Center/Konzernthemen/Research/PDF-Dokumente-CO2-Barometer/CO2-Barometer-2011-LF.pdf
- Martin, R., Muûls, M., De Preux, L. B., & Wagner, U. J. (2014a). Industry compensation under relocation risk: A firm-level analysis of the EU emissions trading scheme. American Economic Review, 104(8), 2482–2508. doi: 10.1257/aer.104.8.2482
- Martin, R., Muûls, M., de Preux, L. B., & Wagner, U. J. (2014b). On the empirical content of carbon leakage criteria in the EU Emissions Trading Scheme. Ecological Economics, 105, 78–88. doi: 10.1016/j.ecolecon.2014.05.010
- Martin, R., Muûls, M., & Wagner, U. (2013). Carbon markets, carbon prices and innovation: Evidence from interviews with managers. Annual meetings of the American economic association, San Diego. Retrieved from https://www.aeaweb.org/conference/2013/retrieve.php?pdfid=372
- Martin, R., Muûls, M., & Wagner, U. J. (2016). The impact of the European Union emissions trading scheme on regulated firms: What is the evidence after ten years? Review of Environmental Economics and Policy, 10(1), 129–148. doi: 10.1093/reep/rev016
- Milliman, S. R., & Prince, R. (1989). Firm incentives to promote technological change in pollution control. Journal of Environmental Economics and Management, 17, 247–265. doi: 10.1016/0095-0696(89)90019-3
- Milliman, S. R., & Prince, R. (1992). Firm incentives to promote technological change in pollution control: Reply. Journal of Environmental Economics and Management, 22(3), 292–296. doi: 10.1016/0095-0696(92)90035-U
- Millimet, D. L., & Roy, J. (2011). Empirical tests of the pollution haven hypothesis when environmental regulation is endogenous. Journal of Applied Econometrics, 31(4), 652–677. doi: 10.1002/jae.2451
- Mokinski, F., & Wölfing, N. M. (2014). The effect of regulatory scrutiny: Asymmetric cost pass-through in power wholesale and its end. Journal of Regulatory Economics, 45(2), 175–193. doi: 10.1007/s11149-013-9233-8
- Monjon, S., & Quirion, P. (2011). Addressing leakage in the EU ETS: Border adjustment or output-based allocation? Ecological Economics, 70(11), 1957–1971.
- Morris, D., & Worthington, B. (2010). Carbon fat cats 2009: Company analysis of the EU ETS. London: Sandbag. Retrieved from https://sandbag.org.uk/site_media/pdfs/reports/fatcats2009.pdf
- Naegele, H., & Zaklan, A. (2017). Does the EU ETS cause carbon leakage in European manufacturing? (DIW Berlin Discussion Paper No. 1689). Retrieved from SSRN: https://ssrn.com/abstract=3050323
- Neuhoff, K., Åhman, M., Betz, R., Cludius, J., Ferrario, F., Holmgren, K., & Sato, M. (2006). Implications of announced phase II national allocation plans for the EU ETS. Climate Policy, 6(4), 411–422. doi: 10.1080/14693062.2006.9685610
- Oberndorfer, U. (2009). EU emission allowances and the stock market: Evidence from the electricity industry. Ecological Economics, 68(4), 1116–1126. doi: 10.1016/j.ecolecon.2008.07.026
- Oberndorfer, U., Alexeeva-Talebi, V., & Löschel, A. (2010). Understanding the competitiveness implications of future phases of EU ETS on the industrial sectors (ZEW Discussion Paper 10-044). Mannheim. Retrieved from ftp://ftp.zew.de/pub/zew-docs/dp/dp10044.pdf
- Oberndorfer, U., & Rennings, K. (2006). The impacts of the European Union emissions trading scheme on competitiveness in Europe ZEW (Discussion Paper 06-051). Mannheim. Retrieved from http://ftp.zew.de/pub/zew-docs/dp/dp06051.pdf
- Osberghaus, D., Heindl, P., Sommerfeld, K., & Höfling, H. (2016). Kfw/ZEW CO2 barometer 2016 – carbon edition. How the EU ETS can contribute to meeting the ambitious targets of the Paris agreement. Frankfurt am Main: KfW Bankengruppe, ZEW. Retrieved from http://www.zew.de/fileadmin/FTP/co2panel/CO2Barometer2016.pdf
- Perino, G., & Willner, M. (2017). EU-ETS Phase IV: Allowance prices, design choices and the market stability reserve. Climate Policy, 17(7), 936–946. doi: 10.1080/14693062.2017.1360173
- Petrick, S., & Wagner, U. J. (2014). The impact of carbon trading on industry: Evidence from German manufacturing firms. doi: 10.2139/ssrn.2389800
- Petsonk, A., & Cozijnsen, J. (2007). Harvesting the low-carbon cornucopia: How the European Union Emissions Trading System (EU-ETS) is spurring innovation and scoring results. Environmental Defense. Retrieved from http://www.edf.org/sites/default/files/harvesting-the-low-carbon-cornucopia-march2007.pdf
- Pintos, P., & Linares, P. (2018). Assessing the EU ETS with a bottom-up, multi-sector model. Climate Policy, 18(4), 413–424. doi: 10.1080/14693062.2017.1294045
- Pizer, W. A., & Popp, D. (2008). Endogenizing technological change: Matching empirical evidence to modeling needs. Energy Economics, 30(6), 2754–2770. doi: 10.1016/j.eneco.2008.02.006
- Pontoglio, S. (2010). An early assessment of the influence on eco-innovation of the EU emissions trading scheme. In Environmental efficiency, innovation and economic performances (pp. 81–91). London: Routledge.
- Popp, D. (2002). Induced innovation and energy prices. American Economic Review, 92(1), 160–180. doi: 10.1257/000282802760015658
- Popp, D. (2010). Innovation and climate policy. Annual Review of Resource Economics, 2, 275–298. doi: 10.1146/annurev.resource.012809.103929
- Porter, M. (1991). America’s green strategy. Scientific American, 264, 168–168.
- Porter, M. E., & Van der Linde, C. (1995). Toward a new conception of the environment-competitiveness relationship. Journal of Economic Perspectives, 9(4), 97–118. doi: 10.1257/jep.9.4.97
- Requate, T., & Unold, W. (2003). Environmental policy incentives to adopt advanced abatement technology: Will the true ranking please stand up? European Economic Review, 47, 125–146.
- Rogge, K. S., Schneider, M., & Hoffmann, V. H. (2011). The innovation impact of the EU emission trading system — findings of company case studies in the German power sector. Ecological Economics, 70(3), 513–523. doi: 10.1016/j.ecolecon.2010.09.032
- Ryan, S. P. (2012). The costs of environmental regulation in a concentrated industry. Econometrica, 80(3), 1019–1061. doi: 10.3982/ECTA6750
- Sartor, O. (2012). Carbon Leakage in the Primary Aluminium Sector: What evidence after 6 1⁄2 years of the EU ETS? (CDC Climat Research, WP N° 2012-12).
- Schleich, J., & Betz, R. (2005). Incentives for energy efficiency and innovation in the European emission trading system. Proceedings of the 2005 ECEEE summer study – what works and who delivers. Retrieved from https://www.researchgate.net/profile/Joachim_Schleich/publication/228358298_Incentives_for_energy_efficiency_and_innovation_in_the_European_Emission_Trading_System/links/0c96052ff3652b7dcf000000.pdf
- Schleich, J., Rogge, K., & Betz, R. (2009). Incentives for energy efficiency in the EU Emissions Trading Scheme. Energy Efficiency, 2(1), 37–67. doi: 10.1007/s12053-008-9029-3
- Sijm, J. S., Chen, Y., & Hobbs, B. F. (2012). The impact of power market structure on CO2 cost pass-through to electricity prices under quantity competition – A theoretical approach. Energy Economics, 34(4), 1143–1152. doi: 10.1016/j.eneco.2011.10.002
- Sijm, J., Neuhoff, K., & Chen, Y. (2006). CO2 cost pass-through and windfall profits in the power sector. Climate Policy, 6(1), 49–72. doi: 10.1080/14693062.2006.9685588
- Sorrell, S., & Sijm, J. (2003). Carbon trading in the policy mix. Oxford Review of Economic Policy, 19(3), 420–437. doi: 10.1093/oxrep/19.3.420
- Stenqvist, C., & Åhman, M. (2016). Free allocation in the 3rd EU ETS period: Assessing two manufacturing sectors. Climate Policy, 16(2), 125–144.
- Vailles, C., Alberola, E., Cassisa, C., Bonnefous, J., Coussy, P., Marion, P., & Escagues, S. (2017). EU ETS: Last call before the doors close on the negotiations for the post-2020 reform (I4CE Climate Brief No. 49). Retrieved from https://www.enerdata.net/about-us/company-news/i4ce-enerdata-ifpen-eu-ets-post-2020-reform-last-call-policy-brief.pdf
- Veith, S., Werner, J. R., & Zimmermann, J. (2009). Capital market response to emission rights returns: Evidence from the European power sector. Energy Economics, 31(4), 605–613. doi: 10.1016/j.eneco.2009.01.004
- Venmans, F. (2012). A literature-based multi-criteria evaluation of the EU ETS. Renewable and Sustainable Energy Reviews, 16, 5493–5510. doi: 10.1016/j.rser.2012.05.036
- Wagner, U. J., Muûls, M., Martin, R., & Colmer, J. (2014). The causal effects of the European Union emissions trading scheme: Evidence from French manufacturing plants. Fifth world congress of environmental and resources economists. Retrieved from http://www.iza.org/conference_files/EnvEmpl2014/martin_r7617.pdf
- Wagner, U. J., & Timmins, C. D. (2008). Agglomeration effects in foreign direct investment and the pollution haven hypothesis. Environmental and Resource Economics, 43(2), 231–256.
- Wang, M., & Zhou, P. (2017). Does emission permit allocation affect CO2 cost pass-through? A theoretical analysis. Energy Economics, 66, 140–146. ISSN 0140-9883.
- Woerdman, E. (2015). ‘The EU greenhouse gas emissions trading scheme’ (chapter 3). In E. Woerdman, M. M. Roggenkamp, & M. Holwerda (Eds.), Essential EU climate law (pp. 43–75). Cheltenham: Edward Elgar.
- WWF. (2005). Implications of the EU emissions trading scheme for the UK power generation sector. Retrieved from http://www.wwf.org.uk/filelibrary/pdf/ipareport.pdf
- Yoon, H., & Heshmati, A. (2017). Do environmental regulations effect FDI decisions? The pollution haven hypothesis revisited (IZA DP No. 10897).
- Yu, H. (2013). The EU ETS and firm profits: An ex-post analysis for Swedish energy firms. Environmental Economics, 4(3), 59–71.
- Zachmann, G., & Von Hirschhausen, C. (2008). First evidence of asymmetric cost pass-through of EU emissions allowances: Examining wholesale electricity prices in Germany. Economics Letters, 99(3), 465–469. doi: 10.1016/j.econlet.2007.09.024