
ABSTRACT
One of the most important challenges for the South East Europe region will be replacing more than 30% of its presently installed fossil fuel generation capacity by the end of 2030, and more than 95% by 2050 if its age structure is considered. This requires a strong policy framework to incentivise new investments in a region currently lacking investors, but also presents an opportunity to shape the electricity sector over the long term according to the broader energy transition strategy of the EU and the Energy Community. The aim of this paper is to assess what type of long-term pathways exist for electricity sector development in the region if they follow the energy transition process of the EU. In this model-based scenario assessment, long term electricity sector futures are explored using a set of interlinked electricity models evaluating the level of renewable energy investment required in the region to reach a deep decarbonization target, assuming emission reduction above 94% by 2050 compared to 1990 in line with the long term market integration and climate policy goals of the EU. It also explores what are the most important system wide impacts of the high deployment of renewable energy concerning generation adequacy and security of supply.
Key policy insights
Energy policies in the South East Europe (SEE) region, both at the national and regional level, should focus on enabling renewable energy integration, as this will be a key component of the future energy mix.
EU and Energy Community policies should be incorporated into national energy planning to ensure that SEE countries embark on the energy transition process at an early stage.
Stranded costs should be carefully considered in decision-making on new fossil-fuel generation and gas network investment in order to avoid lock-in to carbon intensive technologies.
If consistent decarbonization policy prevails, with a significant and persistent CO2 price signal, the role of natural gas remains transitory in the region.
The SEE region offers relatively cheap decarbonization options: the power sector can reduce GHG emissions above 94% by 2050 in the modelled scenarios.
Introduction
South East Europe is a diverse region with respect to its electricity sector development. This study defines the region as six Energy Community countries (Albania, Bosnia and Herzegovina, Kosovo, former Yugoslav Republic (FYR) of Macedonia, Montenegro and Serbia, collectively referred to as WB6) and three EU member states: Bulgaria, Greece and Romania.Footnote1 The electricity network of the region is well connected; energy policies have started to become more harmonized as a result of the EU accession process, the Energy Community Treaty and, more recently, the Energy Union initiative supporting a regional approach to sector development. As a result of these initiatives, the region is expected to follow the transition path of the EU toward a secure, affordable and climate-friendly energy sector in the long term.
One of the most important challenges for the region will be replacing more than 30% of its presently installed fossil fuel generation capacity by the end of 2030 and more than 95% by 2050, taking account its age structure. This requires a strong policy framework to incentivise new investments in a region currently lacking investors, but also presents an opportunity to shape the electricity sector over the long term according to the broader energy transition strategy of the EU and the Energy Community. A recent OECD study on the competitiveness of South East Europe (SEE) (OECD, Citation2018) also underlines the need for regionally integrated electricity markets, as well as the importance of strong policy frameworks both in electricity market reforms and in the environmental field, to attract investment to the WB6 countries that is sustainable over the long term.
The aim of this paper is to assess what type of long-term pathways exist for electricity sector development in the region, if the countries follow the energy transition process of EU Member States. The region is modelled in the SEERMAP project (South East European Electricity Roadmap), which uses a model-based assessment of various long-term electricity scenarios.Footnote2 (Szabó et al., Citation2017) The main research questions in this paper are the following:
Can deployment of renewable energy sources (RES) enable cost-effective decarbonization? Which types of RES technologies could support the energy transition process of the SEE region?
What are the most important system wide impacts of high renewables deployment – e.g. concerning adequacy of generation, and security of supply?
To what extent can the electricity sectors of the SEE region contribute to the decarbonization targets set by the EU and the Paris Agreement?
While many similar evaluations have addressed these questions for EU member states [EU Energy and Climate Roadmaps (European Commission, Citation2011, Citation2012), ECF roadmap (European Climate Foundation, Citation2010)], they did not cover the SEE region, where mainly individual country-based assessments exist. In contrast, a regionally focused assessment is carried out in the SEERMAP project, where the most important results are introduced in this paper concerning changes in the generation portfolio, system impacts and cost effects.
In this model-based scenario assessment, long term electricity sector futures are explored using a set of five high resolution models incorporating the crucial inputs driving electricity policy and investment decisions. The European Electricity Market Model (EEMM) and the Green-X model together (through multiple step iterations) assess the impact of different scenario assumptions on power generation investment and dispatch decisions.
Normative scenarios, evaluating the level of RES investment required in the region to reach a deep decarbonization target, assuming emission reductions above 94% by 2050 compared to 1990, are explored. In addition, a scenario without a decarbonization target (‘No target’ scenario) is assessed, where we assume that power plants currently included in national energy strategies are built. This can be considered as a ‘best guess’ of where current energy policies will lead.
The article is structured as follows. This introduction is followed by a review of recent long term energy modelling of the SEE region and Europe. Next, we introduce the methodology followed by the detailed presentation of the modelled results. The conclusion is divided into two sections: research conclusions and main policy recommendations.
Literature overview
A number of energy sector modelling exercises have been carried out for the SEE region. We review studies for individual countries in the region, as well as studies which cover the electricity sector of the EU, since three of the nine countries in focus are EU member states and others are candidate or potential candidate countries, with electricity grids already connected with the EU.
Based on the review of the literature, there are a limited number of modelling exercises which assess long-term scenarios for the electricity sector in SEE as a whole. One exception is Dominković et al. (Citation2016), which assesses the feasibility of achieving 100% renewable energy generation in SEE using a model covering 11 countries. Most other models are national or EU models; however, the latter omit non-EU countries in the SEE region. In single country models, either the price of imported electricity or the size of net imports have to be set exogenously, making assessment of the interactions between the SEE and other electricity markets impossible. The PRIMES model is the exception, as it has been used to develop reference scenarios for countries in the Western Balkans; however, these results have not been published in academic journals.Footnote3 All published studies have therefore depicted national or SEE regional electricity systems as operating in an island mode, separated from the rest of the European electricity market. This is a limitation that our modelling exercise has overcome by modelling the entire European electricity sector.
With some exceptions (e.g. Capros, Tasios, De Vita, Mantzos, and Paroussos, Citation2012; Dedinec et al., Citation2016; E3M Lab, Citation2017), models take electricity demand as exogenous and model the supply side only, similarly to the EEMM model used for this study.
The reviewed models are technologically explicit, and also depict electricity sector supply (and when modelled, demand) in a detailed way, usually by including hourly data on load and availability. The level of technological detail differs. Most models either do not account for storage technologies or provide for a simplified depiction of storage (e.g. Haller, Ludig, and Bauer (Citation2012) consider two generic storage technologies).
Most studies, with the exception of E3M Lab (Citation2017), and Szabó et al. (Citation2017) do not model the operation of the electricity market explicitly. E3M Lab (Citation2017) assumes the sequential operation of organized markets at day-ahead, intraday and real time timeframes involving detailed simulation by time slice and country. The study includes scenarios that assume electricity-only markets, as well as scenarios involving the different implementation of capacity mechanisms. In Szabó et al. (Citation2017), the operation of electricity markets applies competitive price setting with day ahead markets modelled for 90 representative hours, but no capacity market mechanisms are assumed in the applied EEMM model.
Most studies do not provide a detailed description of the methodology for estimating technical or economic renewables potential. An exception is the LIMES-EU+ model (Haller et al., Citation2012) where installable generation capacities and maximum capacity factors per region and 6-hour time wedges are derived from gridded meteorological data. Regional constraints on biomass consumption are taken from available literature.
In contrast, the Green-X model used in our study provides a detailed methodology for estimating physical and economic renewables potential. It builds on meteorological data for some of the key RES technologies like wind and solar power. This data was combined with land use and other constraints to serve as input for GIS-based modelling. Long-term (year-2050) realizable technical potentials were matched with economic data to serve as the basis for deriving cost-resource curves. Diffusion constraints reflect non-cost barriers such as grid access or permitting processes, and limit the uptake of a specific RES technology within a country or region over the short term. On the other hand, technological learning or changes in financing parameters (e.g. the weighted average cost of capital, WACC) facilitate certain RES developments. A further assessment of long term energy scenario models applied to the electricity sectors of South East Europe is placed in the online appendix comparing the studies of Ćosić et al. (Citation2013), Del Rio et al. (Citation2017), Georgopolou et al. (Citation2015), Mezősi et al. (Citation2016), and Koratinov, and Veselka (Citation2003).
Methodology
Scenarios and main assumptions
The replacement of aging power plants across most of SEE in the coming years presents affordability, security of supply and decarbonization related challenges, but there are several potential long-term capacity development strategies that can meet these requirements.
To assess the effects of different policy decisions, we have modelled three scenarios; the following table summarizes the main assumptions driving the scenarios. It is important to note that other, mainly non-policy related, assumptions are the same for all three scenarios, so the effect of different policy decisions can be isolated and compared ().
Table 1. Summary of main assumptions in the three modelled scenarios (Szabó et al., Citation2017).
The scenarios differ with respect to CO2 emission reduction targets and the new fossil-fuel based generation capacities included in the model. RES capacity expansion is an important result of the modelling carried out in SEERMAP. As the other drivers of CO2 reductions (energy efficiency, nuclear power) are kept constant across scenarios, it is the RES expansion that will achieve the targeted emission reduction. The overall level of RES capacity can be viewed as a ‘normative’ constraint in this modelling framework. However, the RES capacity distribution – amongst the countries and amongst the technologies – is an important result of the modelling. The results of the modelling with respect to the economic and energy security implications of a very high RES share also provide interesting insights.
The ‘no target’ scenario projects the implementation of current energy policy without CO2 emission reduction targets in the EU and Western Balkans. Although a CO2 target is not imposed, producers face CO2 prices. Currently planned fossil fuel power plants are entered into the model exogenously, and information from official national strategies/plans and from local experts are taken into account. The scenario assumes countries meet their 2020 renewable target, then gradually phase out support for renewables between 2021 and 2025.
EU policy (European Commission, Citation2011) sets a long-term indicative emission reduction goal of 93-99% for the electricity sector by 2050. The ‘decarbonization’ scenario, representative of a sustained effort to reach significant reductions in CO2 emissions, assumes an emission reduction target within this range, that is, 94% for the EU28 + WB6 region. Targets are not fulfilled nationally, but are set at a regional level, with separate targets for the SEERMAP region and for the rest of the EU. This implies that emission reductions will vary among individual SEE countries depending on where emissions can be reduced most cost-efficiently. This scenario only includes planned investments which had a final investment decision in 2016, leading to a lower exogenous fossil fuel capacity than assumed in the ‘no target’ scenario.Footnote4 RES support is calculated endogenously to enable countries to reach the prescribed decarbonization target by 2050 with the necessary renewable investment.
The ‘delayed’ scenario involves an initial implementation of current (fossil-fuel) investment plans followed by a change in policy direction from 2035 onwards. The increased RES support from 2035 onwards enables the SEE group of countries to reach the same CO2 emission reduction target as in the ‘decarbonization’ scenario.
Due to distinct generation capacities, the scenarios result in different power production mixes, thus different CO2 emission levels per country, investment needs, wholesale price levels, patterns of trade, and macroeconomic impacts.
Main assumptions
To ensure the comparability of scenarios with respect to the impact of the different policy decisions resulting in different investment strategies over the next few decades, all scenarios share common framework assumptions as described below.
Factors affecting the cost of investment and generation
Investment costs for new generation technologies are taken from EIA (Citation2017) and Green-X and are available in the online Annex. Investment costs reflect the cost reductions induced by technological learning end development, but no difference in this cost reduction is assumed between the scenarios.
WACC has a significant impact on the cost of investment, with a higher WACC leading to lower net present value and limiting the scope of profitable investment. WACC values used in the modelling are country-specific, modified by technology and policy instrument-specific risk factors. The country-specific WACC values (see Online appendix, Table 5) are assumed to vary between 10 and 15% in 2016 for the countries in the region, decreasing to between 9.6 and 11.2% by 2050, and are based on the results of the Diacore project (Fraunhofer ISI, Citation2016). Other studies verify the high WACC values in the region: Ecofys & Eclareon (Citation2017) estimated 7–13.7% for onshore wind and 7–12.4% for PV and IRENA, Joanneum Research, and University of Ljubljana (Citation2017) assumed 8–10% for SEE countries for 2016. The online Annex provides country details on the assumed WACC levels and their time dynamics.
Future natural gas prices are estimated with REKK’s EGMM model, which is a partial equilibrium model with a detailed representation of European gas infrastructure.Footnote5 Country-level gas prices in the SEERMAP region increase by between 66% and 93%, from 20 to 30–35 €/MWh. The price of coal is taken from EIA (Citation2017) and is expected to grow by close to 15% from 2016 to 2050.
A carbon price is applied across the entire modelling period for EU member states and from 2030 onwards for the entire SEE, as it is assumed that all modelled (candidate and potential candidate) countries will implement the EU Emissions Trading Scheme (ETS) or a corresponding scheme by 2030. For 2030 the assumed carbon price level is 33.5 EUR/tCO2, which rises to 88 EUR/tCO2 by 2050, in line with the EU Reference Scenario 2016 (European Commission, Citation2016). This EU Reference Scenario reflects the impacts of the full implementation of existing legally-binding 2020 targets and EU legislation, but does not result in the ambitious emission reduction targeted by the EU as a whole by 2050. This price is therefore a medium level estimate compared with other estimates of EU ETS carbon prices by 2050. A sensitivity case assessment, where we assumed only half the reference carbon value, is also carried out and its impacts are presented.
Renewable energy sources and technologies
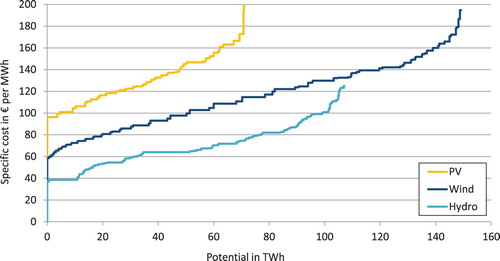
RES modelling generally builds on the principle of least cost deployment, whereby rational investors choose the best locations (with lowest cost) first and the levelised cost of electricity (LCOE) for new capacities increases over time due to limited resource availability. At the same time, technology learning reduces LCOE, so the net impact is the result of these two opposing effects. The relationship between the cost of RES technologies and installed capacity is shown in for the SEE region, but does not account for the learning curve adjustments which were embedded in the Green-X model.
Figure 1. Long term cost and potentials of renewable technologies (EUR/MWh) in the SEE region.
Demand
Projected electricity demand is based – to the extent possible – on data from official national strategies. Where official projections do not exist, electricity demand growth rates are based on the EU Reference scenario (European Commission, Citation2016) for 2013 or 2016 (for non-MS and MS respectively).
The PRIMES EU Reference scenario assumes low levels of electrification of transport and space heating and low levels of energy efficiency compared with a decarbonization scenario. The average annual electricity growth rate for the SEERMAP region as a whole is 0.74% between 2015 and 2050 but annual demand growth varies significantly between countries (e.g. 0.2% in Greece compared to 1.7% in Bosnia and Herzegovina). While the growth rate across all SEE EU countries is below 0.7%, WB6 countries foresee above 1% rates, with the exception of Macedonia, where this rate is 0.8%.
Demand side management (DSM) measures are not adopted until 2035 and shift 3.5% of total daily demand from peak to base load hours by 2050. This is considered a conservative approach compared to other projections from McKinsey (Citation2010) or TECHNOFI (Citation2013).
Infrastructure
ENTSO-E Net Transfer capacity (NTC) data from 2015 is used in the modelling. Future cross border capacity values are based on the ENTSO-E TYNDP 2016 (ENTSO-E, Citation2016), ENTSO-E (Citation2015a) and the 100% RES scenario of the E-Highway projection (ENTSO-E, Citation2015b).
New gas infrastructure follows ENTSO-G TYNDP 2017 (ENTSO-G, Citation2017); TAP and TANAP are constructed between 2016 and 2021 and the Revithoussa and Krk LNG terminals are also built. This results in higher access to natural gas in the region: currently two WB6 countries completely lack access to natural gas connections.
Results
The modelled scenarios lead to significant changes in the capacity mix of the SEERMAP region. This paper brings three aspects into focus: changes to the generation portfolio mix; variation of system adequacy; and the long-term trend in carbon dioxide emissions.
Portfolio changes in the power sector
illustrates the changes in the capacity mix in the modelled three scenarios for the period up to 2050.
Figure 2. Installed capacities in the assessed scenarios, aggregated SEERMAP region
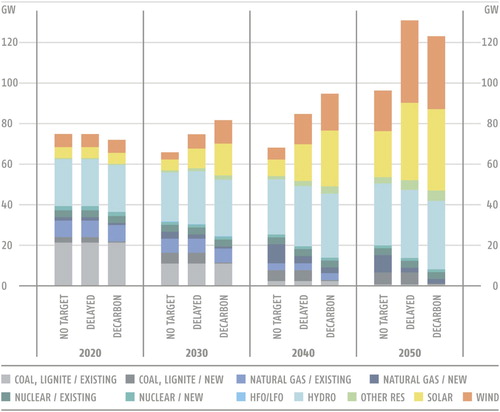
In all three scenarios the capacity mix shifts away from fossil fuels towards renewable capacities, driven by increasing carbon prices and decreasing renewable technology costs. Coal and lignite capacity falls from 24.2 GW in 2016 to 6. GW by 2050 in the ‘no target’ and ‘delayed’ scenarios, and to 1.2 GW in the ‘decarbonization’ scenario. By 2050, most of the remaining coal capacities are located in Bosnia and Herzegovina, Kosovo and Serbia in both the ‘no target’ and ‘delayed’ scenarios, with 2000, 1100 and 1400 MW capacity respectively. (Of this capacity, 600 MW in Kosovo is equipped with carbon capture and storage (CCS) and has been included in the model exogenously in these two scenarios. CCS capacity does not enter into the model endogenously as the cost of CCS is higher than that of renewables. In the ‘decarbonization’ scenario the entire remaining coal capacity in the SEERMAP region is based in three countries: Bosnia and Herzegovina, Bulgaria and Greece.
Nuclear capacity investment decisions are not modelled but driven by exogenous assumptions; apart from the two existing plants in Bulgaria and Romania, 1400 MW capacity are added in Romania by 2028 in accordance with national strategy.
Renewable capacity becomes dominant in all three scenarios. The uptake of wind capacity from 2016 to 2050 is significant across scenarios, tripling from 6 to 20 GW in the ‘no target’ scenario. In the two scenarios with a decarbonization target for 2050 the growth is even more substantial, with wind capacity reaching 41 and 36 GW in the 2050 ‘delayed’ and ‘decarbonization’ scenarios respectively.
Solar capacity expansion is comparable to wind capacity in the region by the end of the modelling period in all scenarios. Although photovoltaic is more expensive than wind generation throughout the modelled period, investment in small scale photovoltaic installations are incentivized by participation in retail electricity markets whereas wind and large scale PV farms compete against the wholesale electricity price. The growth in hydro capacity is the lowest of the three main RES technologies. According to expert consultation within the course of this study, more dynamic hydro capacity development is constrained by sustainability concerns and competing water uses.
Similar trends unfold on the generation side, with photovoltaic and wind generation replacing outgoing coal and lignite based generation. This occurs slowly over the first 15 years and more rapidly after 2030. In the ‘no target’ scenario, when new RES generators do not receive support from 2020 onwards, PV and wind development is initially slow, still only slightly above 2020 levels by 2040. However, in the last modelled decade even without subsidies PV and wind generation expands rapidly in the ‘no target’ scenario, driven by the increasing wholesale prices and falling technology costs.
Depending on the scenario, the role of natural gas within the regional electricity system as a ‘bridging’ fuel varies. In the ‘no target’ scenario electricity generation from natural gas initially increases by a factor of more than four, while in the ‘decarbonization’ scenario the bridging role of natural gas is more short lived, and at its peak increases only by a factor of two. This increase in generation can be accommodated without a need to increase generation capacity. From 2030 to2040 the share of natural gas generation broadly declines in all scenarios, only keeping a sizable share in the ‘no target’ scenario. It is a topic for further research to assess whether all currently planned gas infrastructure developments are needed to satisfy the modelled gas demand, or whether investment in gas infrastructure will create a new set of stranded assets in the region over the long term. As this modelling only partially covers gas demand (household and industrial consumption is not modelled), the SEERMAP assessment cannot provide a fully reliable answer.
Studies like Capros et al. (Citation2012) and Haller et al. (Citation2012) also assess the long-term role of gas in long term energy scenarios. Capros et al. (Citation2012) find regional natural gas demand to be constant over time in the region, which does not support large inter-country investments in infrastructure, while Haller et al. (Citation2012) show that the role of gas generation increases after 2030 but can be limited by emission constraints.
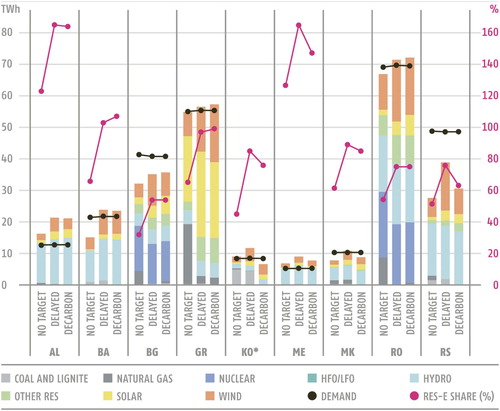
Although most SEERMAP countries follow the broad regional trend highlighted in , noteworthy differences can be observed at country level. While most countries will be self-sufficient by 2050, imports in Bulgaria and Serbia will increase significantly by 2050. Albania and Montenegro, in contrast, become net exporters due to their favourable RES potential within the region. As illustrates, in these net exporting countries the electricity sector will exclusively rely on RES generation, where hydro power based generation will dominate. Hydropower remains significant in Bosnia and Herzegovina, FYR of Macedonia and Serbia, while variable PV and wind generation grow more in Greece, Bulgaria and Romania. Interestingly, while nuclear generation helps Romania reach self-sufficiency, Bulgaria will still rely on significant imports in spite of the sizeable nuclear generation share.
Figure 3. Electricity generation in the modelled scenarios for the SEERMAP region.
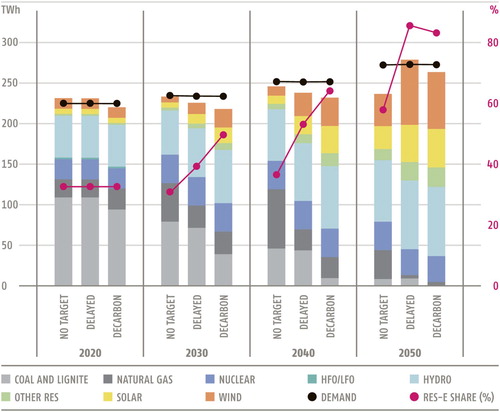
Figure 4. Electricity generation in the modelled scenarios by country level, 2050.
Security of supply
The scenarios assume physical and commercial integration of national electricity markets of the SEE countries, which generally improves security of supply. However, for energy systems with a high share of variable renewables, security of supply concerns may arise. In order to assess the validity of these concerns, three security of supply indices were calculated for all countries and scenarios: the generation capacity margin, the system adequacy margin, and the cost of increasing the generation adequacy margin to zero.
The generation adequacy margin, defined as the difference between available capacity and hourly load as a percentage of hourly load, was calculated for all of the modelled 90 representative hours with the lowest value used as the indicator.Footnote6 System adequacy was defined in a similar way, but net transfer capacity is added to available domestic capacity. In cases where the generation adequacy indicator was negative, the cost of increasing the generation adequacy margin to zero was calculated, defined as the yearly fixed cost of an open cycle gas turbine (OCGT) with adequate capacity to ensure that the generation adequacy margin reaches zero. This cost indicator can be interpreted as a capacity fee.
shows the calculated indices for the SEERMAP in 2030 and 2050.
Figure 5. Generation and system adequacy indices in the ‘decarbonization’ scenario, 2030, 2050.
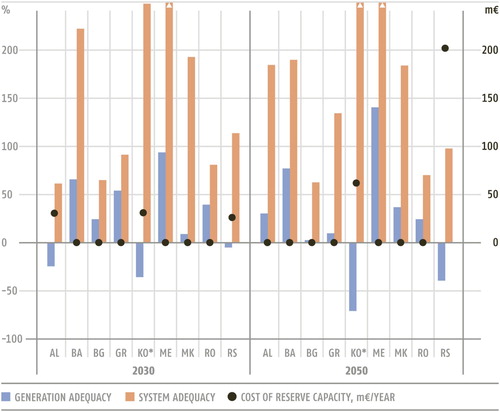
Although illustrates generation and system adequacy indicator values for the ‘decarbonization’ scenario, the trends in other scenarios are similar. Albania, Kosovo and Serbia face the biggest challenge, as their generation adequacy indicators are negative for some years. In contrast, the system adequacy margin is positive for all countries. This underlines the importance of deepening cross-border cooperation within the region and implementing the rules of functioning market institutions.
Impacts on carbon dioxide emissions
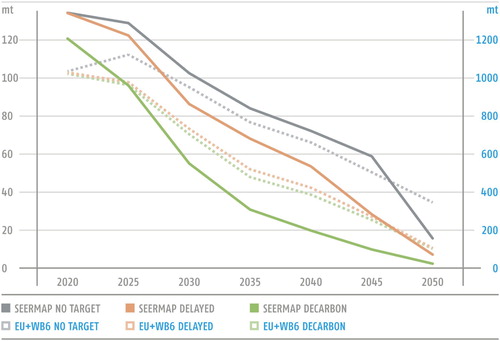
The CO2 emissions of the three modelled scenarios were calculated, but due to data limitations we did not account for other greenhouse gases and only considered emissions from electricity generation, not including emissions related to heat production from cogeneration. The calculations were based on representative emission factors for the region. The 94% decarbonization target for the EU28 + WB6 region translates into a higher than average level of decarbonization in the SEERMAP region for the electricity sector; by 2050 regional CO2 emissions are 95.9% and 98.7% lower than 1990 levels in the ‘delayed’ and ‘decarbonization’ scenarios respectively. This is due to a relative advantage for renewable electricity generation in the region compared with the European electricity sector in general, despite higher WACC levels than in the EU. The comparative advantage for the region relative to the EU lies in hydro potential and solar irradiation. shows that even in the ‘no target’ scenario, substantial carbon reduction – close to 91% by 2050 – is achieved driven by the carbon value path which results in a changing generation mix.
Figure 6. CO2 emissions in the modelled scenarios in the SEERMAP region an in the EU and WB6, 2020–2050 (mt).
This result underlines the importance of carbon pricing in the electricity sector. An efficiently operating carbon market in the region can drive significant decarbonization trends, with declining emissions in countries where high RES potential offers higher emission reduction potential. An important consideration is whether the region can achieve this operative carbon market in an integrated way – through a regional scheme or by joining the EU ETS – or in a fragmented manner. This latter approach would have the disadvantage that some countries would pursue strategies to increase fossil-fuel based generation, resulting in inefficient long term outcomes (i.e. carbon lock-in).
The significant emission reduction in the ‘no target’ scenario is a result of lower fossil fuel power plant utilization rates and the availability and viability of low carbon generation capacities. Bosnia and Herzegovina, Bulgaria, Greece, and Montenegro all have coal capacities that will become uneconomical and exit the market before the end of their commercial lifetime, resulting in a higher level of stranded costs.
The emissions profile of countries in the region varies significantly, but in the ‘delayed’ and ‘decarbonization’ scenarios emission reduction reaches high levels in all countries. FYR of Macedonia, Montenegro and Serbia each achieve a zero emission electricity sector by 2050 under the ‘decarbonization’ scenario.
Economic impacts
The previously described physical changes in the SEE electricity network lead to significant economic impacts on the electricity system. In the following table, these impacts on prices, renewable support and investment levels, as well as on stranded costs, are summarized for the assessed scenarios ().
Table 2. Economic indicators of the modelled scenarios.
Wholesale prices increase significantly in the modelled period, doubling by 2040 from present levels. This increase is driven by the continuously increasing carbon price level, and by increasing fossil fuel prices, mainly natural gas. After 2040, the wholesale electricity price starts to fall in the ‘delayed’ and ‘decarbonization’ scenarios due to merit order effects of RES: low variable cost renewable generation crowds out high variable cost fossil-fuel based generation (gas and coal), reducing wholesale electricity prices by 6 €/MWh over the last 10 years. The SEE region belongs to one price zone with only minor differences amongst countries, indicating the sufficiency of the transmission capacity in the region.
With the exception of the first decade, generation investments are dominated by renewable technologies, even in the ‘no target’ scenario. The average RES support required to reach high penetration levels of RES in the decarbonization scenario remains low, peaking in 2030 but even then remaining below 6.6 €/MWh and decreasing thereafter as a result of increasing wholesale prices and the falling cost of RES technologies. A higher wholesale price would generally be reflected in end-user prices, which is often perceived negatively. However, a positive aspect of this trend is that it allows higher investment levels in the sector. The RES support in 2050 in the ‘delayed’ scenario is an outlier indicating that postponed RES investments would significantly increase the cost of reaching the targeted 94% decarbonization levels.
Investment levels increase significantly in all scenarios. This is partly due to the very low investment levels in the sector presently, which has been characteristic of the region during the last decades, but mainly to the transformation of the electricity sector from carbon intensive coal and lignite towards renewables in the ‘delayed’ and ‘decarbonization’ scenarios.
Stranded costs emerge in the ‘no target’ and ‘delayed’ scenarios during the second half of the assessed period due to the under-utilization of fossil-fuel based capacities. Stranded costs are calculated as the sum of the non-recovered annualized fixed costs, i.e. costs that are not covered by any realized profits (income above variable costs) over the whole lifetime of the coal and gas-based capacities. In the ‘delayed’ and ‘no target’ scenarios, coal and lignite plants built in the 2018-2030 period (18.4–19.7 GW according to the current official energy policies in the region) become stranded, resulting in close to €7 billion worth of stranded costs. Stranded costs are significantly lower, €1.6 billion, in the ‘decarbonization’ scenario where most planned new coal assets do not materialize (limited to 4.5 GW).
These stranded cost estimates indicate technology lock-in occurring mainly in the ‘no target’ and ‘delayed’ scenarios in the region, a similar result to Capros et al. (Citation2012). To better represent the scale of stranded costs, an indicator was calculated, showing the burden of this cost if spread over the electricity consumption of the 10-year period of 2040–2050. In the ‘no target’ and ‘delayed’ scenarios, the value is 2.5–2.6 €/MWh, higher than the average RES support needed in the post 2030 period for decarbonizing the electricity system, but falls to €0.5/MWh in the decarbonization scenario.
The household electricity expenditure to disposable income ratio is also measured under the various scenarios. The present average level of 2.5% household electricity bill is increased to around 3% by 2050 in the region, where the assumed income growth effectively limits the increase of this expenditure share. The delayed scenario is an exception, where the share increases even further, to 4%. It must be emphasized that the increase in electricity expenditure is present in the ‘no target’ scenario as well; the modelled expansion in RES capacities does not put further pressure on household expenditure. These expenditure shares, however, are regional ones. Some countries are exposed to higher expenditure deviations, such as Bosnia and Herzegovina, Bulgaria and FYR of Macedonia, which are characterized by higher shares of old coal capacities and lower RES potential. Electricity price increase is a sensitive issue in the region, as a significant proportion of households live in energy poverty and are very vulnerable to energy price increases. As the projected wholesale price increase needs to be reflected in the end user prices, countries need to find specific solutions for this group of consumers, as artificially limiting the increase in end user price is not a viable policy option over the long term.
Sensitivity analysis of the carbon price
To quantify the impact of the assumed reference carbon price, a low carbon price sensitivity analysis was also carried out for the decarbonization scenario. where the reference carbon price is halved, reaching 44 €/tCO2 by 2050. At the same time, the logic of the scenario is maintained: a 94% decarbonization target still applies to the EU + WB6 region.
We can observe the following pattern in the generation portfolio: higher RES capacity level is needed to reach the same emission constraint, where PV generation gains a higher share compared to wind based generation. The high level of the gas to coal switching rate is significantly reduced compared to the base decarbonization scenario. The wholesale price is significantly lower than in the original ‘decarbonization’ scenario, by €22/MWh. This has a large impact on the required RES support level, which is €35/MWh compared to the original €2/MWh level in 2050. For end users the net effect is an increase in the cost of electricity; based on the model results the carbon price is an efficient policy tool for decarbonization.
The export position of SEERMAP countries also improves. Both security of supply indicators, and generation and system adequacy improve with a lower carbon price. The main results of the sensitivity analysis are presented in the online appendix.
Conclusions
The introduction of a well-functioning competitive market is a key driver for the SEE electricity sector. It will enable more intra-regional trading opportunities between countries leading to price equalization and higher RES deployment. Additionally, a uniform carbon pricing scheme would have a significant impact on SEE electricity markets. If the carbon price increases significantly compared with current levels, it can help RES penetration in two ways: by reducing the profitability of fossil-fuel based generation and at the same time reducing the level of RES support needed (due to the impact of the carbon price on increasing the wholesale price). The modelling results show that the highest average RES support level is below €6.6/MWh in all scenarios except the ‘delayed’ scenario, where in the last modelled decade, a relatively significant increase in RES support is required to trigger the required fast uptake necessary to meet the decarbonization target. Even in the ‘no target’ scenario where new subsidies are not granted after 2020, RES deployment takes off after 2040 driven by the higher wholesale prices and lower technology costs.
By 2050, RES can reach above 85% of electricity consumption in the region, but the contribution varies between individual countries. Those with high RES potential, like Albania and Montenegro, become RES exporters, while others, like Bulgaria and Serbia, exhibit less growth in RES output and increasing import dependence.
If introduced in a timely manner, a carbon pricing scheme would send the appropriate signal to investors and reduce the risk of locking-in carbon intensive technologies. If currently planned coal and lignite investments are realized, they will lead to stranded costs in the second half of the period (in the range of €2–8 /MWh in different SEE countries) exceeding the cost of RES support needed during the same period to decarbonize the electricity sector. The utilization of fossil fuel plants will fall below required economic levels after 2040, with most newly built coal and lignite plant entering early retirement.
There is a strong interaction between decarbonization policy and the role of gas in the power sector in the long run. If consistent decarbonization policy prevails, with a significant and persistent CO2 price signal, the role of gas remains transitory in the region. Although a significant increase is projected in electricity generation from natural gas in the SEE region, more than quadrupling in the ‘no target’ and doubling in the ‘decarbonization’ scenarios by the middle of the modelled period, after 2030–2040 gas generation declines in all scenarios. In the ‘delayed’ and ‘decarbonization’ scenarios, gas is mostly replaced by RES by 2050, with gas generation dropping to a quarter of its 2016 level by 2050.
Results indicate that the SEERMAP region offers relatively cheap decarbonization options: the region reduces emissions by close to 99% compared to the 94% reduction level by 2050 assumed for the EU28 + WB6. Even in the ‘no target’ scenario, emission reduction is significant, in the range of 90%, due to the changes in the generation portfolio resulting from the increased carbon price.
The high penetration of renewables in all scenarios suggests that energy policy, both at the national and regional level, should focus on lowering the cost of RES integration, as RES will be a key component of the future energy mix. This means that the foundation of market institutions (power exchange, competitive allocation of available transfer capacities with the neighbours) needs to be established as the first step in the energy transition process. Reducing risk premiums on financing RES investments, e.g. by building up reliable and predictable RES support schemes, could lead to significant savings in financing investment needs. Our modelling shows that a cost efficient RES uptake does not require an abrupt uptake of these technologies in the region, but rather a more steady and continuous development of RES capacities. In this way, SEE governments could avoid the severe end user price impacts that a too-quick RES uptake would entail, but would still contribute to shared climate goals. Our results suggest that RES subsidies needed to cover end-user surcharges are in a very reasonable range, if such viable RES trajectories are followed.
EU and Energy Community policies should be incorporated into national energy planning to ensure that SEE countries embark on the energy transition process at an early stage. Stranded costs should be carefully considered in fossil-fuel generation and gas network investment decisions in order to avoid lock-in to carbon intensive technologies. As household electricity expenditure may increase significantly in some SEE countries in the future, regardless of the decarbonization target set, this may require new policy approaches in the affected countries. Regional cooperation helps to handle security of supply issues and reduces the cost of decarbonization by enabling the utilization of the most economic RES resource potential in the region. EU and international financial institutions have a key role in this transition process by helping to meet growing investment needs highlighted in this study. The results of the scenarios and the sensitivity assessment also suggest that establishing an ETS scheme would be a major policy instrument in achieving 2050 carbon targets. The role of the EU and Energy Community is key in order to direct WB6 countries in this direction, as presently ETS is not on their policy agendas.
Supplemental Material
Download Zip (71.1 KB)Disclosure statement
No potential conflict of interest was reported by the authors.
Additional information
Funding
Notes
1 The Energy Community is an international organisation founded in 2005 with the key objective to extend the EU internal energy market rules and principles to countries in South East Europe, the Black Sea region and beyond on the basis of a legally binding framework.
2 SEERMAP is a research project dealing with the energy transition process of the electricity sector of the SEE region, financed by the Austrian Federal Ministry of Agriculture, Forestry, Environment and Water Management and the European Climate Foundation. www.seermap.rekk.hu
3 For PRIMES model references, see E3M Lab/NTUA & IIASA (Citation2016) and E3M Lab (Citation2017).
4 The impacts of the Large Combustion Plant BREF (Commission Implementing Decision of 2017/1442) are not taken into account in our modelling work, as it entered into force in July 2017.
5 For further details on the EGMM model, see Kiss, Selei, and Takácsné Tóth (Citation2017).
6 For this calculation, assumptions were made with respect to the maximum availability of different technologies. Fossil fuel power plants were assumed to be available 95% of the time, and hydro storage 100% of the time. For other RES technologies historical availability data was used.
Related Research Data
References
- Capros, P., Tasios, N., De Vita, A., Mantzos, L., & Paroussos, L. (2012). Transformations of the energy system in the context of the decarbonisation of the EU economy in the time horizon to 2050. Energy Strategy Reviews, 1(2), 85–96. doi: 10.1016/j.esr.2012.06.001
- Dedinec, A., Taseska-Gjorgievska, V., Markovska, N., Obradovic Grncarovska, T., Duic, N., Pop-Jordanov, J., & Taleski, R. (2016). Towards post-2020 climate change regime: Analyses of various mitigation scenarios and contributions for Macedonia. Energy, 94, 124–137. doi: 10.1016/j.energy.2015.10.085
- Del Rio, P., Resch, G., Ortner, A., Liebmann, L., Busch, S., & Panzer, C. (2017). A techno-economic analysis of EU renewable electricity policy pathways in 2030. Energy Policy, 104, 484–493. doi: 10.1016/j.enpol.2017.01.028
- Dominković, D. F., Bačeković, I., Ćosić, B., Krajačić, G., Pukšec, T., Duić, N., & Markovska, N. (2016). Zero carbon energy system of south east Europe in 2050. Applied Energy, 184, 1517–1528. doi: 10.1016/j.apenergy.2016.03.046
- E3M Lab. (2017). Modelling study contributing to the Impact Assessment of the European Commission of the electricity market design initiative final report. Retrieved from European Commission website: https://ec.europa.eu/energy/sites/ener/files/documents/ntua_publication_mdi.pdf
- E3M Lab/NTUA and IIASA. (2016, December). Technical report on Member State results of the EUCO policy scenarios (pp. 1–381). Retrieved from European Commission website: https://ec.europa.eu/energy/sites/ener/files/documents/20161219_-_technical_report_on_euco_scenarios_primes.pdf
- Ecofys, & Eclareon. (2017). Mapping the cost of capital for wind and solar energy in South Eastern European Member States. Retrieved from Ecofys homepage: http://www.ecofys.com/files/files/ecofys-eclareon-2016-wacc-wind-pv-south-east-europe.pdf
- EIA. (2017, January). Annual Energy Outlook 2017 with Projections to 2050. US energy Information Administration. Retrieved from EIA homepage: https://www.eia.gov/outlooks/aeo/pdf/0383(2017).pdf
- ENTSO-E. (2015a). Scenario Outlook and Adequacy Forecast 2015. Brussels, 2015. Retrieved from ENTSO-E homepage: https://www.entsoe.eu/Documents/SDC%20documents/SOAF/150630_SOAF_2015_publication_wcover.pdf
- ENTSO-E. (2015b, November). Europe’s future secure and sustainable electricity infrastructure. E-Highway2050 project results. Retrieved from project homepage: http://www.e-highway2050.eu/fileadmin/documents/e_highway2050_booklet.pdf
- ENTSO-E. (2016). Ten-year network development plan 2016. Retrieved from ENTSO-E homepage: http://tyndp.entsoe.eu/
- ENTSO-G. (2017). Ten-year network development plan 2017. Retrieved from ENTSO-G homepage: https://www.entsog.eu/public/uploads/files/publications/TYNDP/2017/entsog_tyndp_2017_main_170428_web_xs.pdf
- Eurelectric. (2009). Power Choices: Pathways to Carbon-Neutral Electricity in Europe by 2050, 100. Retrieved from Euroelectric homepage: www.eurelectric.org/PowerChoices2050/
- European Climate Foundation. (2010). Roadmap 2050: A practical guide to a prosperous, low-carbon Europe Volume I: technical and economic assessment, I, 387.
- European Commission. (2011). A Roadmap for moving to a competitive low carbon economy in 2050. COM(2011) 112 final.
- European Commission. (2012). Energy Roadmap 2050. ISBN 978-92-79-21798-2.
- European Commission. (2016). EU Reference Scenario 2016. Energy, transport and GHG emissions Trends to 2050. Retrieved from European Commission homepage: https://ec.europa.eu/energy/sites/ener/files/documents/ref2016_report_final-web.pdf
- Fraunhofer ISI. (2016). Policy dialogue on the assessment and convergence of RES policy in EU Member States. Final Report of the DiaCore project. Retrieved from project website: http://www.diacore.eu/images/files2/DIACORE_Final_Report.pdf
- Fürsch, M., Hagspiel, S., Jägemann, C., Nagl, S., Lindenberger, D., & Tröster, E. (2013). The role of grid extensions in a cost-efficient transformation of the European electricity system until 2050. Applied Energy, 104, 642–652. doi: 10.1016/j.apenergy.2012.11.050
- Georgopoulou, E., Mirasgedis, S., Sarafidis, Y., Gakis, N., Hontou, V., Lalas, D. P., … Pucker, J. (2015). Lessons learnt from a sectoral analysis of greenhouse gas mitigation potential in the Balkans. Energy, 92, 577–591. doi: 10.1016/j.energy.2015.04.068
- Halkos, G., Tzeremes, N. G., & Tzeremes, P. G. (2015). A nonparametric approach for evaluating long-term energy policy scenarios: An application to the Greek energy system. Journal of Economic Structures, 4(1), 2–14. doi: 10.1186/s40008-015-0014-7
- Haller, M., Ludig, S., & Bauer, N. (2012). Decarbonization scenarios for the EU and MENA power system: Considering spatial distribution and short term dynamics of renewable generation. Energy Policy, 47, 282–290. doi: 10.1016/j.enpol.2012.04.069
- Jägemann, C., Fürsch, M., Hagspiel, S., & Nagl, S. (2013). Decarbonizing Europe’s power sector by 2050 – Analyzing the economic implications of alternative decarbonization pathways. Energy Economics, 40, 622–636. doi: 10.1016/j.eneco.2013.08.019
- Kiss, A., Selei, A., & Takácsné Tóth, B. (2017). A top-down approach to evaluating cross-border natural gas infrastructure projects in Europe. The Energy Journal, 37, 61–79.
- Koltsaklis, N. E., Dagoumas, A. S., Kopanos, G. M., Pistikopoulos, E. N., & Georgiadis, M. C. (2014). A spatial multi-period long-term energy planning model: A case study of the Greek power system. Applied Energy, 115, 456–482. doi: 10.1016/j.apenergy.2013.10.042
- Koritanov, V. S., & Veselka, T. D. (2003). Modeling the regional electricity network in Southeast Europe. 2003 IEEE Power Engineering Society General Meeting (IEEE Cat. No.03CH37491), 1.
- McKinsey. (2010, September). Transformation of Europe’s power system until 2050. Summary of findings. Düsseldorf. Retrieved from McKinsey homepage: http://www.mckinsey.com/~/media/mckinsey/dotcom/client_service/epng/pdfs/transformation_of_europes_power_system.ashx
- Mezősi, A., Pató, Z., & Szabó, L. (2015). Decarbonisation modelling in the electricity sector. Regional Report. Budapest. Retrieved from Regional Energy Center website: http://sled.rec.org/documents/SLED_Regional_ELEC_ENG.pdf
- Mezősi, A., Pató, Z., & Szabó, L. (2016). Assessment of the EU 10% interconnection target in the context of CO2 mitigation. Climate Policy, 16(4), 658–672. doi: 10.1080/14693062.2016.1160864
- OECD. (2018). Competitiveness in south east Europe – A policy outlook 2018, series: Competitiveness and private sector development. Paris: OECD Publishing. doi: 10.1787/9789264298576-en
- Ćosić, B., Krajačić, G., & Duić, N. (2012). A 100% renewable energy system in the year 2050: The case of Macedonia. Energy, 48(1), 80–87. doi: 10.1016/j.energy.2012.06.078
- Ćosić, B., Maršić, T., Krajačić, G., Markovska, N., Batas Bjelic, I., Gota, D.-I., & Duić, N. (2013). The effect of regionally integrated energy systems on CO2 emissions reduction and wind integration: The case of South East Europe. 6th International Conference on Sustainable Energy and Environmental Protection. Maribor.
- Roinioti, A., Koroneos, C., & Wangensteen, I. (2012). Modeling the Greek energy system: Scenarios of clean energy use and their implications. Energy Policy, 50, 711–722. doi: 10.1016/j.enpol.2012.08.017
- Szabó, L., Mezősi, A., Zs, P., Kelemen, Á, Beöthy, Á, Kácsor, E., … Todorović, D. (2017). SEERMAP: South east Europe electricity roadmap. ISBN 978-615-80813-1-3.
- Taseska, V., Markovska, N., Causevski, A., Bosevski, T., & Pop-Jordanov, J. (2011). Greenhouse gases (GHG) emissions reduction in a power system predominantly based on lignite. Energy, 36(4), 2266–2270. doi: 10.1016/j.energy.2010.04.010
- TECHNOFI. (2013). E-Highway 2050. Selection and characterization of the most impacting demand-side technologies. Paris. Retrieved from project homepage: http://www.e-highway2050.eu/fileadmin/documents/Results/D3/report_demand_technologies_selection_a.pdf and http://www.e-highway2050.eu/fileadmin/documents/Results/D3/report_demand_technologies_selection_b.pdf
- Tigas, K., Giannakidis, G., Mantzaris, J., Lalas, D., Sakellaridis, N., Nakos, C., … Alexandridis, A. T. (2015). Wide scale penetration of renewable electricity in the Greek energy system in view of the European decarbonization targets for 2050. Renewable and Sustainable Energy Reviews, 42, 158–169. doi: 10.1016/j.rser.2014.10.007
- IRENA, Joanneum Research, & University of Ljubljana. (2017). Cost-competitive renewable power generation: Potential across south east Europe. Abu Dhabi: International Renewable Energy Agency (IRENA).
- WWF. (2017). Long term plan for the Greek energy system. Retrieved from WWF website: https://www.wwf.gr/images/pdfs/EnergyReportFinal.pdf