
 ?Mathematical formulae have been encoded as MathML and are displayed in this HTML version using MathJax in order to improve their display. Uncheck the box to turn MathJax off. This feature requires Javascript. Click on a formula to zoom.
ABSTRACT
Company cars have received considerable attention because of their partial tax-exemption and the changes in travel behaviour they stimulate, including car model choices, distances driven, and car ownership patterns. This paper is the first to present evidence on actual transport behaviour change, based on mobility and fuel diaries, and comparing a sample of 624 company cars and 9328 private cars in Germany. Analysis confirms that company cars belong to the more heavily motorized car segments (with an average 97 kW, as opposed to 79 kW of private cars), and are driven more than private cars (24,672 km per year, compared to 12,828 km per year for private cars). Company car benefits also increase average household vehicle numbers by 25%. Results show that it is imperative to distinguish company cars of company owners relative to those driven by employees, as negative externalities increase significantly where company cars are used by the latter. Abolishing company car benefits could significantly reduce emissions from passenger road transport and stimulate change in the country’s automotive industries towards a lower-carbon path. As Germany is not currently on track to meet its climate mitigation targets, this would be a timely policy shift.
Key policy insights
Company car benefits increase transport demand, car ownership, and average vehicle fleet engine power. These effects are particularly relevant for employees.
Company cars have, in spite of their larger size and greater engine power, a (modestly) better fuel economy than private cars, possibly because they represent more recent and hence more efficient car models.
A policy focus on vehicle fuel efficiency improvements will fail to reduce the German car fleet’s CO2 emissions to a sustainable level.
Abolishing company car benefits could yield a significant reduction in GHG emissions from passenger road transport.
Company car subsidies are an out-dated mode of support for the fossil-fuel based automotive industry.
1. Introduction
Emissions of greenhouse gases (GHG) will have to fall by 40–50% by mid-century to prevent warming exceeding 2°C compared to pre-industrial levels (Intergovernmental Panel on Climate Change [IPCC], Citation2014), the international policy goal under the 2015 Paris Agreement. This is a significant challenge, and will require far-reaching action across economic sectors (EEA, Citation2017; Friedlingstein et al., Citation2014; Larkin, Kuriakose, Sharmina, & Anderson, Citation2017). Transportation is a significant contributor of GHG emissions, accounting for about 27% of final energy use, and 6.7GtCO2 direct emissions in 2010 (IPCC, Citation2014, 21). Notably, around 72% of the sector’s direct emissions are road-related (IPCC, Citation2014). Evidence from developments in a wide range of countries warns of a significant future rise in transport-related emissions (Schäfer, Heywood, Jacoby, & Waitz, Citation2009), with very limited evidence of transport systems becoming more energy efficient to a degree where this is reflected in a decline from absolute emission levels (Santos, Citation2017).
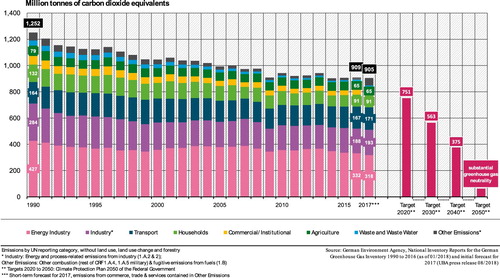
Germany is among the top 10 global emitters of GHG emissions, and has pledged to decarbonize its industries. The Climate Protection Plan 2050 of the Federal Government foresees that the country reduce its emissions from 909 Mt CO2-eq in 2016 to 751 Mt CO2-eq by 2020, 563 Mt CO2-eq by 2030 and 375 Mt CO2-eq by 2040, with the overall goal to achieve GHG neutrality by 2050 (Umweltbundesamt [UBA], Citation2018). However, as shown in , the decline in GHG emission levels has recently stalled. The German Environment Agency (UBA, Citation2018, no page) recently acknowledged that mitigation targets will not be achieved without ‘massive and rapid mitigation efforts’ across economic sectors. For road transport, these have been specified as a reduction of 40–42% by 2030, compared to 1990 (Bundesministerium für Verkehr und digitale Infrastruktur [BMVI], Citation2016). However, to achieve this target in transportation may be even more difficult than for other economic sectors, given that transport emissions have remained stable between 1990 and 2015, at 164 Mt CO2-eq (15% of national emissions; UBA, Citation2016b), and increased in both 2016 and 2017 (UBA, Citation2016c).
Figure 1. Emissions of greenhouse gases, Germany. Source: UBA (Citation2018).
Lack of progress on mitigation targets has been explained by insignificant policies to reduce emissions from transportation (Gössling & Metzler, Citation2017). To date, Germany’s national mitigation efforts in the transport sector have largely focused on reducing specific (per transport unit) emissions from newly registered cars, or in other words, reliance on carmakers to introduce more fuel-efficient cars. This strategy has failed, as it does not consider car use and car fleet renewal patterns (Gössling & Metzler, Citation2017). Moreover, recent studies have also shown considerable divergence between official and ‘real world’ specific emissions in the wake of the Volkswagen scandal and the discovery of ‘defeat devices’, manipulating air pollutants under test conditions (Tietge, Mock, Franco, & Zacharof, Citation2017).
Against this background, it has been argued that Germany faces an ‘automobile dilemma’ regarding climate change, as the country seems unwilling to reduce its emissions from road transportation to meet its climate policy objectives: The country lacks an integrated, comprehensive strategy to address mitigation in the transport sector (Gössling & Metzler, Citation2017). To identify policies that can contribute to the decarbonization of the sector requires a better understanding of the factors that increase emission levels, or represent barriers to reducing these. Company car legislation is one of these aspects (Diekmann et al., Citation2011).
Company cars represent a considerable share of the car fleet in European countries (Cohen-Blankshtain, Citation2008) and are widely considered a benefit to employees that should be partially exempt from taxation (Harding, Citation2014). There is evidence that company cars are also used privately and by other household members, and thus represent an additional, significant source of wealth while influencing transport behaviour. These issues, discussed in various publications ( Cohen-Blankshtain, Citation2008; Dargay, Gately, & Sommer Citation2007; Graus & Worrell, Citation2008; Gutiérrez-i-Puigarnau & Van Ommeren, Citation2011; Ramaekers et al., Citation2010; Shiftan, Albert, & Keinan, Citation2012; Van Ommeren, Van Der Vlist, & Nijkamp, Citation2006), have given rise to concerns that company cars represent a problem as much for climate change, as for fiscal revenue (Harding, Citation2014; Princen, Citation2017).
Climate change impacts are related to changes in mobility patterns and transport mode choices. Where the car is factually cheaper, or perceived as being less costly or even free to use, it can become a self-evident transport choice, increasing overall transport demand, and fostering less energy-efficient car model choices or driving styles (Graus & Worrell, Citation2008; Gutiérrez-i-Puigarnau & Van Ommeren, Citation2011; Ramaekers et al., Citation2010; Shiftan et al., Citation2012). As earlier studies have highlighted, company cars are also associated with longer commutes, increasing overall transport demand. However, it is unclear how reliable these estimates are. Graus and Worrell (Citation2008) cite for example a methodology based on ‘surveys and model calculations’, while Gutiérrez-i-Puigarnau and Van Ommeren (Citation2011) rely on household surveys and national travel survey data, recording travel behaviour during one specific day. Macharis and De Witte (Citation2012) collected data on the basis of personal estimates of company car use. While such data has provided valuable insights, it does not allow for conclusions regarding actual fuel use, in comparison to car size or engine power, distances driven, or driving styles. The purpose of this paper is to analyse these interrelationships, and to discuss their implications for climate change.
2. Background
2.1. Company car benefits
Company car benefits are available in many countries, with reported shares of between 10% and 50% of national car fleets (Cohen-Blankshtain, Citation2008). A key issue regarding company cars is how these are defined. Often, a company car is defined as a ‘[…] car which an employer gives to an employee to use as their own, usually as a benefit of having a particular job, or because their job involves a lot of travelling’ (Collins, Citation2018: no page). According to this definition, the need to travel on the job may – or may not – be relevant for the provision of company car benefits. These benefits consequently also constitute a form of income that can be partial, involving the reimbursement of fuel costs, or comprehensive, including even refunded private parking costs.
Business or work-related travel, including commuting, is often considered part of production, and hence deductible from taxes; yet, private trips made with company cars are unrelated to production, and where these are not distinguished from business trips, constitute a benefit (Cohen-Blankshtain, Citation2008). In more general terms, personal income taxes usually have to be paid on income, less the expenses needed to generate this income (Harding, Citation2014). Hence, personal expenses paid or reimbursed by the employer would have to be treated as taxable income, while work-related expenses would not be taxable. In comparison, personal expenses paid by the employee cannot be deducted from the taxable income, while work-related expenses are deductible. In the case of company cars, the cost of car registration, insurance, fuel and operating expenses including private parking may be fully covered by the employer, i.e. without consideration of travel purpose, which may be business-related or private. The value of this benefit would represent a taxable income, which, however, is not taxed in OECD countries in a way that would cover the full benefit forwarded to employees (Harding, Citation2014).
Principles of company car taxation consequently vary between countries. A typology of tax treatments of personal use of company cars in OECD countries is provided in Harding (Citation2014). Taxation principles may consider the percentages of capital cost in comparison to: cost price (Slovenia, Spain, Switzerland), list price (Belgium, Iceland, Norway), or fair market value (USA); distances travelled for private (Canada, Luxembourg), deemed (i.e. based on an assumed use; Italy) or home-work related purposes (Germany); direct costs that may be private (Australia, France, Japan) or business-related (Austria, South Africa); lump sum approaches (Estonia, Finland, Sweden); or non-taxation (Hungary, Mexico). In a wide range of countries, more than one method of estimating the taxable benefit are allowed (Harding Citation2014). An important question is whether commuting to and from work is considered a tax-deductible expense. In some countries, such as the UK and the USA, commuting is considered private travel and taxed accordingly (Harding, Citation2014).
As the car is one of the most expensive items of household spending (OECD, Citation2018), benefits of company cars can be substantial. Gutiérrez-i-Puigarnau and Van Ommeren (Citation2011) calculated, for example, that the welfare costs of the favourable taxation of company cars in the Netherlands amounted to more than €2000 per car. Princen (Citation2017) estimated the favourable tax treatment of company cars in Belgium at €3.75 billion in foregone revenue per year, equivalent to 0.9% of national GDP. In a study of 26 OECD countries, Harding (Citation2014) found that only 44–58% of the taxable benefit of a company car were taxed, concluding that the weighted average subsidy per company car is €1600 per year in OECD countries, corresponding to an estimated €26.8 billion in 2012.
In Germany, company car policy grants a tax privilege to drivers that is assessed on the basis of the ‘1% rule’, i.e. each month, 1% of the list price of the car is taxed on top of the driver’s income. This constitutes a small share of the tax benefit, with countries such as Israel setting tax levels more than twice as high (Shiftan et al., Citation2012). Diekmann et al. (Citation2011) affirm that the German 1% rule is both unrefined and uses very low values, which the authors calculate to represent a subsidy of untaxed income that is worth an annual €3.3–5.5 billion to German company car drivers. Companies favour car benefits as a means of compensation because they only pay social security on the 1% list price that is taxed, saving on costs that would arise should the full value of the company car be taxed. As Diekmann et al. (Citation2011) highlight, benefits forwarded to the employee consequently increase with the value (sales price) of the company car, as well as the distances travelled, given the fixed level of taxation.
2.2. Observed changes in transport behaviour
Negative social outcomes of company car benefits have been highlighted since the 1980s (Whitelegg, Citation1984). Manning (Citation2003) was one of the first to outline that employees would accept longer commute times if offered higher levels of compensation, prompting Van Ommeren et al. (Citation2006) to investigate forms of company benefits. They found that UK companies offered transport benefits (company cars, parking) or, alternatively, relocation benefits to make jobs more attractive. The strategies had very different social and environmental implications, as transport benefits increased negative externalities associated with congestion and pollution, as a result of growth in transport demand.
Other outcomes of company car benefits include the use of the car as the self-evident transport choice, and a concomitant decline in the use of alternative transportation such as bicycle, bus, tram or train (Dargay et al., Citation2007; Harding, Citation2014; Ramaekers et al., Citation2010). The European Commission (Citation2002, see also Graus & Worrell, Citation2008) observed that company cars are larger and more fuel consuming than private cars. Company cars are also driven twice to three times as much as private cars (Graus & Worrell, Citation2008; Johansson-Stenman, Citation2002; Ramaekers et al., Citation2010). Shiftan et al. (Citation2012) found, in a survey of Israeli drivers, that the availability of a company car even affected the transport behaviour of other household members. Company cars also increase the likelihood of participation in leisure trips. In confirming these effects, 44% of respondents in the Shiftan et al. (Citation2012) study stated that they would make fewer trips, and 42% that they would choose alternative transport modes if they only owned a private car. Even though not discussed by Shiftan et al. (Citation2012), their survey found that 64% of respondents in the company car sample owned two cars, i.e. more than the average household, indicating that household ‘savings’ on company car benefits may be invested in a second, private car.
Yet another effect of company cars may be related to driving styles: Where drivers do not have to pay for fuel, or where the cost of fuel is perceived to be lower, ‘wasteful’ driving styles can become a norm. Energy-intense driving styles include, for example, unnecessary idling, driving at higher speeds, and hard acceleration or deceleration (Rutty, Matthews, Andrey, & Del Matto, Citation2013). As higher average speeds have been linked to higher accident risks (Aarts, & Van Schagen, Citation2006), such behavioural change can cause secondary negative externalities. Company cars may also increase the attachment to powerful, larger cars with combustion engines; i.e. cars that are widely considered indicators of social standing. Koetse and Hoen (Citation2014) find, for example, that company car drivers have a more limited interest in alternative propulsion technologies, including batteries and fuel cells.
Overall, the literature thus reveals that company car ownership may induce changes that increase car attachment, overall transport demand, and technology lock-in, all then raising obstacles to decarbonization of the transport system ().
Table 1. Overview of changes in transport behaviour induced by company car.
3. Methodology
3.1. Car numbers and segments
As of 1 January 2016, Germany had 41.5 million passenger cars (Kraftfahrt-Bundesamt [KBA], Citation2016). These belong to different segments, including microcars, subcompact cars, compact cars, mid-size cars, large family cars, large cars, compact SUVs, sports cars, mini MPV, large MPV, mid-size SUV, mobile homes and full-size SUV. These car segments have differing characteristics regarding weight, engine power and fuel use.
3.2. Mobility and fuel diaries
In Germany, national driving patterns have been assessed on the basis of annual mobility panels since 1994 (‘Mobilitätspanel’; www.mobilitaetspanel.de). Car ownership and mobility patterns are recorded on the basis of household surveys complemented with mobility and fuel diaries; the latter were introduced in 2002. Over the years, varying numbers of households were recruited to participate in the surveys, with a low in 2008 (n = 375). In this paper, which is based on 2015 data, the analysis considers 9952 passenger cars, including 9328 (92.48%) private cars as well as 624 (7.52%) company cars. An important distinction is that out of the 624 company cars, 292 are driven by company owners, and 332 by employees, allowing for further analysis.
Households were identified in a three-stage approach, including i) a representative survey by telephone (mobile phones and landlines); ii) the selection and recruiting of households; and iii) a short interview and formal agreement to participate. Committed households were provided with the survey document, including an extensive questionnaire. Household members then proceeded to collect data on their travel patterns in a personal mobility diary, as well as a car-specific fuel diary. The fuel diary covers a period of one month in spring, i.e. the time of year considered most representative for the year. TNS Infratest, a German research institute, collected the data (for further details on the methodology see Karlsruher Institut für Technologie [KIT], Citation2015; for a critical discussion of the methodology, see Chlond, Streit, Abler, & Vortisch, Citation2015).
3.3. Model
A linear regression model was developed to evaluate data, using the logarithm of the total distance travelled as dependent variable. Independent variables include the logarithm of fuel price, income, rural area, household size, a gasoline dummy and a company car dummy. Elasticities and semi-elasticities were calculated using a range of models to improve the validity of results, including ordinary least squares (OLS), Robust (Venables & Ripley, Citation2002), Quantile (Koenker, Citation2016), as well as Mixed Effect (Bates, Mächler, Bolker, & Walker, Citation2014), the latter to account for random effects as data is clustered on the household level and households take part in the study over three years. Furthermore, a multiplicative interaction term between the company car dummy and fuel price was included. The regression model distinguishes between company cars driven by the employer and company cars driven by the owner of the company. Thus, the relationship between total distance travelled and fuel price depends on the moderating variable ‘company car’ and can be tested based on:(1)
(1)
In the above Equation (1), β3 is the effect of a company car on distance travelled when the fuel price is zero (for discussion see Wooldridge, Citation2003). Data for fuel price are centred to determine the price elasticity in the interaction term. As a result, β3 then gives the effect of a company car on the distance travelled at the average fuel price of the sample. It should be noted that the re-parameterization does not change the coefficients or standard errors of the other independent variables in the regression equation (see Afshartous & Preston, Citation2011). For the company car dummies, semi-elasticities are derived, and to calculate a percentage effect of e.g. a company car owned by the employer on distance driven, the coefficient must be adjusted by 100*[exp(β3) − 1].
Furthermore, Aiken and West (Citation1991) have demonstrated the importance of correctly testing and interpreting interaction terms, i.e. whether the regression is statistically significant, and whether the effect of a change in the primary explanatory variable on the dependent variable for any specific value of the moderating variable is statistically different from zero (for a discussion, see Kingsley, Noordewier, & Van den Bergh, Citation2017). Without this test, a statistically significant non-zero marginal effect of the primary explanatory variable for some value of the moderating variable cannot be ruled out. To test the statistical significance of each marginal effect in our model, the standard error of the coefficient must be estimated separately. In Equation (1) the variable company car is a dichotomous moderating variable taking on the value 0 for ‘no’ and 1 for ‘company car’. The dependent variable ‘lndistance’ is continuous and the marginal effect of fuel price on the distance travelled is given by:(2)
(2)
As a result, the marginal effect of the fuel price on the distance travelled depends on a third variable ‘company car’. Therefore, the interaction model cannot be treated as a single unconditional effect of fuel price on distance travelled. With the dichotomous variable company car, there are two marginal effects to consider (Brambor, Clark, & Golder, Citation2006). When the variable company car is 0, this is:(3)
(3)
When the variable is 1, this is:(4)
(4)
Furthermore, to determine the statistical significance of the marginal effects in Equation (2), the standard error of interest is given by:(5)
(5)
If the covariance is negative, it is possible for the term to be significant for substantively relevant values of the variable ‘company car’, even if all of the model parameters are insignificant (Brambor, Clark, & Golder, Citation2007). Hence, it is necessary to calculate the marginal effects (3) and (4) with the standard errors in Equation (5) to determine if the effect of a change in the primary explanatory variable on the dependent variable is statistically different from zero for any specific value of the variable company car (Kingsley et al., Citation2017).
4. Results
Analysis shows that the average age of company cars is 4.36, while the average age of private passenger cars is 7.63, i.e. revealing a considerable age difference of 3.27 years. This calculation is based on the comparison of the year of production with the survey year, i.e. a car produced in 2015 is 0 years old in the survey year 2015. Age values are consequently not an exact measure of age, and represent an age comparison between private and company cars. The official average age of cars in Germany was 9.2 years in 2015, according to KBA (Citation2016), though this includes ‘historical cars’ (30 years or older) that may be driven only on special occasions.
The analysis also reveals that company cars are driven almost twice as much as private cars, at an average 2056 km per month (24,672 km per year), compared to 1069 km per month (12,828 km per year) for private vehicles. It should be noted that company owners drive considerably less with their company car (18,792 km per year) than employees (29,856 km per year). In comparison, official figures for Germany suggest that the average distance per passenger car amounted to 14,015 km per year (KBA, Citation2017). This finding, that company cars are used significantly more than private cars, confirms international research suggesting that company cars are driven up to three times more than private cars (Harding, Citation2014).
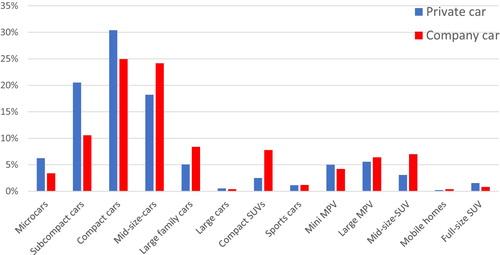
With regards to engine power, private cars were found to average 79 kW, while for company cars, the average is 97 kW. Again, company cars for employees were found to be more heavily motorized (99 kW) than those of owners (95 kW). Differences in engine power are reflected in the distribution of car model types (), showing that there is a general tendency for larger car models to be more common among company cars. In the small car segments, microcars, subcompact cars and compact cars account for 57% of all private cars, but less than 39% of company cars. Company cars dominate most larger car segments with the exception of large cars, mini MPVs and full-size SUVs, i.e. segments where smaller sample sizes make it difficult to assess whether these differences are significant.
Figure 2. Distribution of car model segments, private and company cars.
Even though larger and more heavily motorized cars are more common in company car fleets, averaged specific fuel use values were found to be almost identical with private cars, at 7.80 L/100km for private cars, and 7.77 L/100km for company cars. There are various possible explanations for this. First of all, company cars are newer, and fuel economy efficiencies have improved in recent years. The age difference of more than three years is thus likely to make company cars significantly more fuel efficient.
The findings also have repercussions with regard to official German fuel-use data. For example, the German Environment Agency (UBA, Citation2017) affirms that throughout the German car fleet, specific fuel use declined from 8.8 L/100km in 1995 to 7.2 L/100km in 2016. This research indicates that actual average fuel consumption of the German car fleet, irrespective of company or private car categorization, is probably 0.6 L/100km, or 8%, higher than official data suggests (i.e. 7.8 L/100 km rather than 7.2 L/100km). Findings thus confirm that driving styles and road type mix (highway – rural – urban) influence consumption, making stated efficiencies a poor measure of actual fuel use (Gössling & Metzler, Citation2017; Tietge et al., Citation2017). Apart from production year, driving conditions are the second most important factor explaining the lower fuel use of company cars, as these are more often driven over larger distances, and hence at more constant, albeit higher, speeds. In comparison, private cars are driven proportionally more often in urban contexts, where they use more fuel.
provides further insights regarding travel distances and specific fuel consumption for different car segments. Across segments, drivers of company cars cover considerably larger distances, specifically in the categories compact cars, mid-sized cars, large family cars, large cars, compact SUVs, mini MPV, large MPV, and mobile homes. Microcars are the only category where private cars are used more intensively than company cars. Regarding specific fuel consumption by segment, company cars consume less fuel in most categories.
Table 2. Distances travelled, specific fuel consumption and production year, by car segment.
The most fuel consuming car segments are large family cars, large cars, compact SUVs, sports cars, and mobile homes. None of these segments has a high share of company cars (), suggesting that car types typically chosen for company cars, i.e. compact cars and mid-sized cars, are comparably fuel-efficient. As mid-sized cars are driven the most, at about 33,975 km per year, their relative abundance in the car fleet and contribution to overall distances driven makes them a third factor explaining comparably low average fuel use values for company cars more generally.
Contrary to expectations, higher specific fuel use values for company cars could thus not be confirmed in this analysis, though this is not necessarily a result of more fuel-efficient driving styles, but rather newer production years, more constant speeds, as well as the predominance of mid-sized cars in company car fleets and their intense use. Specifically, with regard to production year, there are considerable differences between private and company cars in some vehicle segments, with for instance private ‘large cars’ averaging 11.4 years, compared to company ‘large cars’ at 3.0 years.
shows the results of multivariate regressions with different control variables, testing whether the distances driven depend on household income, location (rural or urban), or household size. Regressions confirm interrelationships, showing that all of these are statistically significant. Analysis also confirms the role of income with regard to car ownership: Analysis shows that with every €1000 increase in average monthly household income, (multiple) car ownership will grow by 10%. This is also confirmed by data showing that in households with company cars, which constitute a form of additional income, car ownership is significantly higher at 2.0 cars, as compared to households with private cars owning on average 1.6 cars. Company cars consequently increase household car ownership levels by 25%. Income also affects transport demand, i.e. the distances driven. Data reveals, for example, that for the middle-income classes, an increase by €1000 in monthly household income results in a 3.5% growth in transport demand.
Table 3. Overview of model results.
Further variables of interest in the context of company car use are household size and residency in small versus larger towns. Mixed model results indicate, for the overall sample, that an additional household member increases distances driven by 5%. Mobility patterns are also fundamentally different in small/larger cities. In cities with up to 5000 people, travel demand is about 40% higher than in cities with 100,000 inhabitants or more. Overall, findings suggest that the main statistically significant determinants of transport demand are company car availability and city size. Income effects are also statistically significant.
also shows a statistically significant negative relationship between distances travelled and fuel price, for private cars. Averaged across all models (OLS, Mixed Effect, Robust, Quantile), price elasticity was determined at −0.29, confirming data by Gössling and Metzler (Citation2017), who showed that a 1% increase in fuel prices results in a 0.27% decline in car use throughout the German car fleet. In other words, were fuel costs to increase, private car use will decline by 2.7% for every 10% fuel price increase. Price effects are more complex in the context of company cars. Mixed models all show that higher fuel prices have a very limited impact on the transport demand of owners of company cars, as marginal effects are not statistically significant. Owners of company cars appear to use their cars irrespective of cost, which may mean that owners are indifferent to cost or that they consider all trips imperative. In comparison, analysis reveals considerably higher price elasticity in the case of company cars driven by employees. The average price elasticity across all models is statistically significant at the 10% level, at −0.80. Any increase in the cost of fuel by 1% consequently results in a 0.8% decline in transport demand of employees driving company cars. This finding can be interpreted in light of significantly larger annual distances driven by company car users, and specifically employees. Were all distances driven with company cars truly work-related, employees would be expected to be as price-inelastic as owners, which is not the case. Hence, it seems likely that a significant share of employee travel is unrelated to work. These findings suggest that company car effects should be distinguished on the basis of ownership, i.e. whether employees or company owners use cars.
To determine GHG emissions, available data has been extrapolated from national datasets to calculate CO2 from company cars in comparison to private car travel. The results suggest that owners of private cars consume an average 830 L (gasoline) and 1157 L (diesel) per year, while company car drivers use 1170 (gasoline) and 2361 L (diesel) per year. This results in annual emissions of 1.98 t CO2 (gasoline) and 3.05 t CO2 (diesel) for private cars, and 2.80 t CO2 (gasoline) and 6.23 t CO2 (diesel) for company cars. The German vehicle fleet comprised 45.1 million cars in 2015 (KBA, Citation2016), of which about 41.7 million (92.48%) were private and 3.4 million (7.52%) company cars. While the majority of private cars use gasoline, most company cars are diesel vehicles. In 2015, the German car fleet emitted an estimated 113 Mt CO2, of which private cars emitted 84.5%, and company cars 15.5%. As company cars only represent 7.5% of the German vehicle fleet, they account for a share of emissions that is twice as high.
These results are summarized in .
Table 4. Distribution of CO2 emissions, private and company cars.
5. Discussion
5.1. New insights regarding company cars
This research has investigated company car effects on transport behaviour, and therefore on the sector’s contribution to climate change. Mobility and fuel diaries were analysed to derive insights regarding car model choices, distances travelled, specific fuel use, and car ownership patterns. Furthermore, effects of household and city size, as well as fuel type (gasoline/diesel) and income were also investigated. Results partially confirm earlier findings, increasing the degree of validity regarding various interrelationships, but also revealing new insights. For example, analysis of diary data allows for conclusions regarding transport demand distinguishing company cars used by owners relative to employees, as well as implications of higher fuel prices representing, for example, carbon taxes.
More specifically, data reveals that company cars more often belong to the larger and more costly car segments, confirming hypotheses as postulated by European Commission (Citation2002) and in the academic literature (e.g. Graus & Worrell, Citation2008). German company cars are also driven significantly more, again in line with expectations (Harding, Citation2014; Shiftan et al., Citation2012). However, contrary to expectations, company cars were revealed to have a slightly better fuel economy, possibly mostly as a result of their more recent production years. Over the entire sample, all cars were however found to have a significant (8%) worse fuel economy than official data for Germany suggests (UBA, Citation2017). Company cars also increase household car ownership, by about 25%, confirming Annon et al. These findings underline the various implications company cars have for transport behaviour, and therefore for climate change.
More recent research confirms that perceptions of car efficiency, equivalent to perceptions of low fuel costs, lead to considerable increases in transport volumes (Stapleton, Sorrell, & Schwanen, Citation2017). This could be a potential effect of ‘new & efficient car’ perceptions (Gilbert & Perl, Citation2008). It is likely that all of these factors contribute to greater distances travelled with company cars, and their greater overall fuel consumption (Gutiérrez-i-Puigarnau & Van Ommeren, Citation2011). This is confirmed by the finding that there are considerable differences in price elasticities, depending on user type. Employees using company cars were found to use the car most, but they are also the most price elastic group. This suggests that cars are used ‘excessively’ by employees because driving is considered cheap. Were the cost of fuel to increase, this would be expected to rapidly curb transport demand of employees using company cars, by 0.8% for every 1.0% increase in the cost of fuel.
5.2. Implications of findings for German company car policy
These findings have various implications for German fiscal and climate policy in the transport sector, lending support for calls to reform tax policies (Harding, Citation2014). Cohen-Blankshtain (Citation2008) recommended that company car numbers be limited, also with a view to equity, while Shiftan et al. (Citation2012) affirmed that changes in taxation would strongly affect personal use. Harding (Citation2014) emphasized that walking, carpooling or bicycling are often not allowed deductions or exemptions, making these transport mode choices less favourable. Also for this reason, Princen (Citation2017) suggests that company cars be taxed equally to other means of transport. Commuting by car in particular may have to be reclassified as a private activity and not be tax deductible at all (Laine & Van Steenbergen, Citation2017). As Dineen, Ryan, and Ó Gallachóir (Citation2018) have highlighted, tax reform directed at emissions can make a significant contribution to climate change mitigation. Specifically, CO2-based vehicle taxes for both private and company cars have been successful in influencing vehicle choices and driver behaviour.
In Germany, the distorting effects of company cars have received attention in the context of payment equity and climate change mitigation. Diekmann et al. (Citation2011) suggested that to reduce negative social and environmental effects, company cars should be taxed at the same level as private cars. This could imply taxation of company cars on a 1% basis, as is currently the case, though with a focus on real car costs (rather than list prices), as well as a use-dependent tax covering maintenance and fuel costs. To achieve this, Diekmann et al. (Citation2011) suggest determining private travel shares, as well as specific fuel consumption values for different car types, to then tax ‘private’ benefits. However, in the light of ‘Dieselgate’, any such approach must be considered unreliable (Tietge et al., Citation2017). Even in the best scenario, taxation of company car use will remain an approximation.
In view of the significant distortions of transport behaviour caused by company cars, including on the urgent problem of climate change, the question is thus whether company car benefits should not be abandoned altogether. As Macharis and De Witte (Citation2012, 98) highlighted, ‘this will not be an easy task as company cars are perceived as very attractive incentives’, more than additional pension payments, life insurances or savings plans. Yet, addressing the company car phenomenon would have positive effects for climate change mitigation and, from a tax policy viewpoint, resolve the problem of payment equity as well as the difficulty of determining taxable travel shares. Hence, it may be argued that company car benefits represent subsidies that are no longer appropriate. This insight has recently gained further relevance with the growing realization of the massive socioeconomic cost of air pollution (The Lancet, Citation2017).
Specifically with regard to climate change mitigation, findings indicate that company cars account for twice the amount of CO2 emissions of private cars, relative to their share of the German vehicle fleet. Consequently, if company cars benefits were abolished, this could theoretically yield a reduction in CO2 emissions equivalent to 7.5% of overall transport emissions from passenger cars. While it cannot be assumed that company car drivers would halve their vehicle use under such a scenario, price elasticity calculations nevertheless indicate that considerable changes can be expected on the side of employees. Abandoning company car benefits would also send a clear signal to carmakers and drivers to plan for climate change, an aspect that is not currently sufficiently on the agenda of German car manufacturers (Gössling & Metzler, Citation2017). To reduce resistance against such policy changes, it may be necessary to simultaneously introduce incentives for greener car choices. Tax benefits could also apply to car pools or alternative forms of transportation. Even more important is to support non-car transport choices, as well as active transportation that makes a positive contribution to social welfare, such as walking and cycling (Gössling & Choi, Citation2015).
While abandoning company car benefits thus has considerable potential to reduce emissions from the transport sector, it will not be sufficient to meet climate change mitigation pledges, given the 40–42% emission reduction challenge for the German transport sector (Bundesministerium für Umwelt, Naturschutz und nukleare Sicherheit [BMUB], Citation2016).
The main question consequently remains as to whether Germany will act on its climate change mitigation pledges. The country maintains a wide range of transport policies not aligned with public opinion (e.g. speed limits) or scientific insight (e.g. accidents, air pollution) (Douglas, Watkins, Gorman, & Higgins, Citation2011; Gössling & Metzler, Citation2017). As Schwedes (Citation2016, 3; author’s translation) noted with regard to German transport policy, ‘there is hardly a political arena characterized by a greater discrepancy between programmatic claims and their actual implementation’.
6. Conclusions and policy implications
Germany is a country that has made far-reaching pledges to reduce its emissions of GHGs. There is however very limited evidence to suggest that targets will be met. Specifically, emissions from transportation have recently grown; probably because the sole policy approach has been to rely on improvements in the fuel economy of newly registered cars. New strategies to reduce emissions have to be identified, if Germany is to meet its mitigation pledges for transportation, as well as overall national emission reduction targets.
This paper studied interrelationships of company car availability and transport behaviour. The results support various earlier findings, such as the fact that company car benefits increase transport demand, car ownership levels, as well as more heavily motorized and larger car model choices. New insights gained from this research include that company cars have, in spite of their size, a (modestly) better fuel economy than private cars, possibly because they represent more recent and hence more efficient car models. The findings also show that a higher income, larger household size and rural household location will all drive up transport demand, while the observed average fuel economy of German cars is significantly worse than official data suggests. Finally, analysis revealed that it is important to distinguish the company car use patterns of company owners and employees. Employees are significantly more mobile than owners, but they are also considerably more price-elastic, suggesting that a high share of the distances travelled by employees represents private purposes.
With regard to climate change, calculations for Germany have shown that abandoning company car benefits is likely to make a significant contribution to mitigation, with a theoretical potential to reduce national emissions from passenger travel by 7.5%. Any such decline in GHG would go along with a concomitant decline in air pollutants, accidents, and other externalities linked to automobility. At a time where global policy ambitions are focused on the reduction of such impacts, company car benefits should be phased out. As forms of subsidies, they contribute to maintaining the automotive system, rather than more sustainable, mobility-as-a-service focused transport systems. Governments should support forms of transport that make positive contributions to social welfare, such as cycling or walking, as well as policies that contribute to a shift in propulsion technology (battery electric vehicles, plug-in hybrid vehicles). Company car benefits as currently designed are an outdated form of support to automotive industries.
The proposition to phase out company car benefits is also supported by other research, showing that those EU-countries significantly reducing emissions from vehicles ‘have aligned CO2-based vehicle taxes with other policy measures such as labelling, company car taxes and fuel prices’ (Dineen et al., Citation2018, 406). Abolishing company car benefits – throughout OECD countries – would signal a major policy regime shift, i.e. that road transportation cannot be exempt from worldwide efforts to reduce emissions of GHG. An important step is thus to identify barriers to such policy shifts and to develop strategies that will not affect company car users to a degree that will jeopardize their employment opportunities.
Future research may seek to disentangle reasons for political resistance to changes in the transport system that continue to favour those transport modes the least warranted from environmental and social sustainability viewpoints.
Data availability
The data set used for calculations can be ordered from Deutsches Zentrum für Luft- und Raumfahrt (DLR, German Aerospace Centre): http://daten.clearingstelle-verkehr.de/192/
Disclosure statement
No potential conflict of interest was reported by the authors.
References
- Aarts, L., & Van Schagen, I. (2006). Driving speed and the risk of road crashes: A review. Accident Analysis & Prevention, 38(2), 215–224. doi: 10.1016/j.aap.2005.07.004
- Afshartous, D., & Preston, R. A. (2011). Key results of interaction models with centering. Journal of Statistics Education, 19(3). doi:10.1080/10691898.2011.11889620.
- Aiken, L., & West, S. (1991). Multiple regression: Testing and interpreting interactions. London: Sage Publishing.
- Bates, D., Mächler, M., Bolker, B., & Walker, S. (2014). Fitting linear mixed-effects models using lme4. Available: arXiv preprint arXiv:1406.5823.
- Brambor, T., Clark, W. R., & Golder, M. (2006). Understanding interaction models: Improving empirical analyses. Political Analysis, 14(1), 63–82. doi: 10.1093/pan/mpi014
- Brambor, T., Clark, W. R., & Golder, M. (2007). Are African party systems different? Electoral Studies, 26(2), 315–323. doi: 10.1016/j.electstud.2006.06.011
- Bundesministerium für Umwelt, Naturschutz und nukleare Sicherheit (BMUB). (2016). Klimaschutzplan 2050. Retrieved from http://www.bmub.bund.de/themen/klima-energie/klimaschutz/klima-klimaschutz-download/artikel/klimaschutzplan-2050/
- Bundesministerium für Verkehr und digitale Infrastruktur (BMVI). (2016). Bundesverkehrswegeplan 2030 (federal transport infrastructure plan 2030). Retrieved from https://www.bmvi.de/SharedDocs/DE/Anlage/ VerkehrUndMobilitaet/BVWP/bvwp-2030-gesamtplan.pdf?__blob=publicationFile
- Chlond, B., Streit, T., Abler, G., & Vortisch, P. (2015). Balancing innovation and continuity – experiences with survey design adaptations of the German mobility panel. Transportation Research Procedia, 11(11), 43–59. doi: 10.1016/j.trpro.2015.12.005
- Cohen-Blankshtain, G. (2008). Institutional constraints on transport policymaking: The case of company cars in Israel. Transportation, 35(3), 411–424. doi: 10.1007/s11116-007-9152-6
- Collins. (2018). Company car. Retrieved from https://www.collinsdictionary.com/dictionary/english/company-car
- Dargay, J., Gately, D., & Sommer, M. (2007). Vehicle ownership and income growth, worldwide: 1960-2030. The Energy Journal, 28(4), 143–170. doi: 10.5547/ISSN0195-6574-EJ-Vol28-No4-7
- Diekmann, L., Klinski, S., Schmidt, S., Gerhards, E., Meyer, B., & Thöne, M. (2011). Steuerliche Behandlung von Firmenwagen in Deutschland. Germany: Fifo Institute for Public Economics. FiFo-Bericht Nr. 13, May 2011, Cologne (244 pp).
- Dineen, D., Ryan, L., & Ó Gallachóir, B. (2018). Vehicle tax policies and new passenger car CO2 performance in EU member states. Climate Policy, 18(4), 396–412. doi: 10.1080/14693062.2017.1294044
- Douglas, M. J., Watkins, S. J., Gorman, D. R., & Higgins, M. (2011). Are cars the new tobacco? Journal of Public Health, 33(2), 160–169. doi: 10.1093/pubmed/fdr032
- European Commission. (2002). Fiscal measures to reduce CO2 emissions from new passenger cars: Main report. Retrieved from https://ec.europa.eu/taxation_customs/sites/taxation/files/docs/body/co2_cars_study_25-02-2002.pdf.
- European Environment Agency. (EFA). (2017). Monitoring progress of Europe's transport sector towards its environment, health and climate objectives. Retrieved from https://www.eea.europa.eu/publications/monitoring-progress-of-europe2019s-transport.
- Friedlingstein, P., Andrew, R. M., Rogelj, J., Peters, G. P., Canadell, J. G., Knutti, R., … Le Quéré, C. (2014). Persistent growth of CO2 emissions and implications for reaching climate targets. Nature Geoscience, 7(10), 709–715. doi: 10.1038/ngeo2248
- Gilbert, R., & Perl, A. (2008). Transport revolutions: Moving people and freight without oil. London: Earthscan.
- Gössling, S., & Choi, A. S. (2015). Transport transitions in Copenhagen: Comparing the cost of cars and bicycles. Ecological Economics, 113, 106–113. doi: 10.1016/j.ecolecon.2015.03.006
- Gössling, S., & Metzler, D. (2017). Germany's climate policy: Facing an automobile dilemma. Energy Policy, 105, 418–428. doi:10.1016/j.enpol.2017.03.019
- Graus, W., & Worrell, E. (2008). The principal–agent problem and transport energy use: Case study of company lease cars in the Netherlands. Energy Policy, 36(10), 3745–3753. doi: 10.1016/j.enpol.2008.07.005
- Gutiérrez-i-Puigarnau, E., & Van Ommeren, J. N. (2011). Welfare effects of distortionary fringe benefits taxation: The case of employer-provided cars. International Economic Review, 52(4), 1105–1122. doi: 10.1111/j.1468-2354.2011.00661.x
- Harding, M. (2014). Personal tax treatment of company cars and commuting expenses: Estimating the fiscal and environmental costs. OECD Taxation Working Papers, No. 20, OECD Publishing. doi: 10.1787/5jz14cg1s7vl-en
- Intergovernmental Panel on Climate Change (IPCC). (2014). Summary for policymakers. In O. Edenhofer, R. Pichs-Madruga, Y. Sokona, E. Farahani, S. Kadner, K. Seyboth, A. Adler, I. Baum, S. Brunner, P. Eickemeier, B. Kriemann, J. Savolainen, S. Schlömer, C. von Stechow, T. Zwickel, & J. C. Minx (Eds.), Climate change 2014: mitigation of climate change. Contribution of Working Group III to the Fifth Assessment Report of the Intergovernmental Panel on Climate Change. Cambridge: Cambridge University Press.
- Johansson-Stenman, O. (2002). Estimating individual driving distance by car and public transport in Sweden. Applied Economics, 34, 959–967. doi: 10.1080/00036840110068823
- Karlsruher Institut für Technologie (KIT). (2015). Deutsches Mobilitätspanel (MOP). Wissenschaftliche Begleitung und Auswertungen. Karlsruhe: Bericht 2015/2016: Alltagsmobilität und Fahrleistung.
- Kingsley, A. F., Noordewier, T. G., & Van den Bergh, R. G. (2017). Overstating and understating interaction results in international business research. Journal of World Business, 52, 286–295. doi: 10.1016/j.jwb.2016.12.010
- Koenker, R. (2016). Quantreg: Quantile regression. R package version 5.21. Retrieved from https://CRAN.R-project.org/package=quantreg
- Koetse, M. J., & Hoen, A. (2014). Preferences for alternative fuel vehicles of company car drivers. Resource and Energy Economics, 37, 279–301. doi: 10.1016/j.reseneeco.2013.12.006
- Kraftfahrt-Bundesamt (KBA). (2016, January). Pressemitteilung Nr. 08/2016 - Der Fahrzeugbestand am 1. Retrieved from http://www.kba.de/DE/Presse/Pressemitteilungen/2016/Fahrzeugbestand/pm8_fz_bestand_pm_komplett.html?nn=716842 Accessed 13 April 2018
- Kraftfahrt-Bundesamt (KBA). (2017). Gesamtkilometer steigen um 1,4 Prozent. Retrieved from https://www.kba.de/DE/Statistik/Kraftverkehr/VerkehrKilometer/2016_vk_kurzbericht_pdf.pdf?__blob=publicationFile&v=11
- Laine, B., & Van Steenbergen, A. (2017). Commuting subsidies in Belgium. Reflets et Perspectives de la vie économique, LVI, 101–120. doi: 10.3917/rpve.562.0101
- The Lancet. (2017). The Lancet Commission on pollution and health. October 19, 2017, doi: 10.1016/S0140-6736(17)32345-0, http://www.thelancet.com/commissions/pollution-and-health.
- Larkin, A., Kuriakose, J., Sharmina, M., & Anderson, K. (2017). What if negative emission technologies fail at scale? Implications of the Paris Agreement for big emitting nations. Climate Policy, 18(6), 690–714. doi: 10.1080/14693062.2017.1346498
- Macharis, C., & De Witte, A. (2012). The typical company car user does not exist: The case of Flemish company car drivers. Transport Policy, 24, 91–98. doi: 10.1016/j.tranpol.2012.06.018
- Manning, A. (2003). The real thin theory: Monopsony in modern labour markets. Labour Economics, 10, 105–131. doi: 10.1016/S0927-5371(03)00018-6
- OECD. (2018). Final consumption expenditure of households. Retrieved from https://stats.oecd.org/Index.aspx?DataSetCode=SNA_TABLE5
- Princen, S. (2017). Taxation of company cars in Belgium – room to reduce their favourable treatment. Retrieved from https://ec.europa.eu/info/publications/economic-and-financial-affairs-publications_en
- Ramaekers, K., Wets, G., De Witte, A., Macharis, C., Cornelis, E., Castaigne, M., & Pauly, X. (2010). The impact of company cars on travel behaviour. 12th World Conference on Transport Research (WCTR), July 11–15, 2010, Lisbon, Portugal.
- Rutty, M., Matthews, L., Andrey, J., & Del Matto, T. (2013). Eco-driver training within the city of calgary’s municipal fleet: Monitoring the impact. Transportation Research Part D: Transport and Environment, 24, 44–51. doi: 10.1016/j.trd.2013.05.006
- Santos, G. (2017). Road fuel taxes in Europe: Do they internalize road transport externalities? Transport Policy, 53, 120–134. doi: 10.1016/j.tranpol.2016.09.009
- Schäfer, A., Heywood, J. B., Jacoby, H. D., & Waitz, I. A. (2009). Transportation in a climate-constrained world. Cambridge: MIT Press.
- Schwedes, O. (2016). Verkehrspolitik: Ein problemorientierter Überblick. In O. Schwedes, W. Cnazler, & A. Knie (Eds.), Handbuch verkehrspolitik (2nd ed., pp. 3–31). Wiesbaden: Springer.
- Shiftan, Y., Albert, G., & Keinan, T. (2012). The impact of company-car taxation policy on travel behavior. Transport Policy, 19(1), 139–146. doi: 10.1016/j.tranpol.2011.09.001
- Stapleton, L., Sorrell, S., & Schwanen, T. (2017). Peak car and increasing rebound: A closer look at car travel trends in Great Britain. Transportation Research Part D: Transport and Environment, 53, 217–233. doi: 10.1016/j.trd.2017.03.025
- Tietge, U., Mock, P., Franco, V., & Zacharof, N. (2017). From laboratory to road: Modeling the divergence between official and real-world fuel consumption and CO2 emission values in the German passenger car market for the years 2001–2014. Energy Policy, 103, 212–222. doi: 10.1016/j.enpol.2017.01.021
- Umweltbundesamt (UBA). (2016b). UBA-Emissionsdaten für 2015 zeigen Notwendigkeit für konsequente Umsetzung des Aktionsprogramms Klimaschutz 2020. Retrieved from https://www. umweltbundesamt.de/presse/presseinformationen/uba-emissionsdaten-fuer-2015-zeigen-notwendigkeit
- Umweltbundesamt (UBA). (2016c). Fahrleistungen, Verkehrsaufwand und Modal Split. Retrieved from https://www.umweltbundesamt.de/daten/verkehr/fahrleistungen-verkehrsaufwand-modal-split#textpart-1
- Umweltbundesamt (UBA). (2017). Kraftstoffe. Retrieved from https://www.umweltbundesamt.de/daten/verkehr/kraftstoffe
- Umweltbundesamt (UBA). (2018). Indicator: Greenhouse gas emissions. Retrieved from https://www.umweltbundesamt.de/en/indicator-greenhouse-gas-emissions#textpart-1
- Van Ommeren, J., Van Der Vlist, A., & Nijkamp, P. (2006). Transport-related fringe benefits: Implications for moving and the journey to work. Journal of Regional Science, 46(3), 493–506. doi: 10.1111/j.1467-9787.2006.00448.x
- Venables, W. N., & Ripley, B. D. (2002). Modern applied statistics with S (4th ed.). New York: Springer.
- Whitelegg, J. (1984). The company car in the United Kingdom as an instrument of transport policy. Transportation Policy and Decision Making, 2, 219–230.
- Wooldridge, J. M. (2003). Introductory econometrics: A modern approach. Mason: South-Western.