
 ?Mathematical formulae have been encoded as MathML and are displayed in this HTML version using MathJax in order to improve their display. Uncheck the box to turn MathJax off. This feature requires Javascript. Click on a formula to zoom.
ABSTRACT
The EU Carbon-CAP project assembled a comprehensive portfolio of consumer initiatives in order to assess the potential total impact of consumer options on national carbon footprints. Existing evaluations of behavioural change have focused primarily on direct energy reductions, typically in households and buildings. However, changes in consumer demand have deeper impacts via their upstream supply chains. The consumer behaviour options considered in the portfolio focus on green household initiatives. Combining existing micro-level studies with a multiregional input-output economic model, we estimated the potential efficacy and uptake of each behaviour across the European Union (EU). The results suggest that adopting these consumer options could reduce carbon footprints by approximately 25%. While 75% of this is delivered as reductions in emissions within Europe, one-quarter of the effect is delivered as a reduced imported carbon footprint, due to changes in the composition of imports.
Key policy insights
Consumer initiatives can have a big effect on embodied carbon imports, in addition to domestic impacts
We connect a portfolio of ∼90 green behaviour changes to a global supply chain database to model impacts holistically
We estimate that with reasonable levels of adoption green consumer actions can reduce the EU CO2 footprint by 25%
A quarter of this effect is delivered in the form of reduced embodied emissions in imports
Introduction
The Paris climate agreement called for limiting global warming to 1.5°C above pre-industrial level yet the currently pledged emission reductions, called Nationally Determined Contributions (NDCs), are grossly insufficient to meet such an ambitious target (Fawcett et al., Citation2015). Behaviour change has been little discussed by many climate policy-makers and analysts despite the fact that the Intergovernmental Panel on Climate Change (IPCC) considers it a relevant strategy for reducing emissions from transportation, buildings, industry and agriculture (Pacala & Socolow, Citation2004). Well-recognized assessments of the ‘behavioural wedge’ (Pacala & Socolow, Citation2004) address the size of potential emission reductions and behavioural plasticity, i.e. the likelihood of adopting a specific desirable behaviour (Barnes, Lynham, Kalberg, & Leung, Citation2016; Creutzig et al., Citation2016; Dietz, Gardner, Gilligan, Stern, & Vandenbergh, Citation2009; Gardner & Stern, Citation2008). Yet these broader assessments of behavioural change often neglect strategies to affect the supply chain and do not yet consider the life-cycle greenhouse gas emissions (a.k.a. carbon footprints) that more narrow studies of specific strategies have shown to be important (Chester, Pincetl, Elizabeth, Eisenstein, & Matute, Citation2013; Hellweg & Milà i Canals, Citation2014; Hoekstra & Wiedmann, Citation2014; Koide & Akenji, Citation2017; O’Rourke, Citation2014; Scholz, Eriksson, & Strid, Citation2015) But increasing attention is being given to potential behavioural changes at points along the emitter-to-final-consumer supply chain aside from the primary emitter (Creutzig et al., Citation2018; Steininger et al., Citation2018).
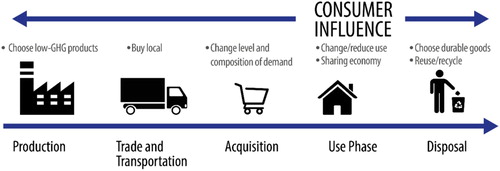
While not discounting the importance of targeting GHG reductions at the point of emissions, it is important to remember that all production is ultimately linked to households via long supply chains and that it is thus possible to pull production toward lower-carbon alternatives by tugging at any point along these chains. Change in consumer behaviour can influence global production recipes, drive demand toward lower-carbon products, and alter the level and composition of global consumption (O’Rourke, Citation2014; Stavros, Marco, Kate, John, & Andy, Citation2016). Consumer behaviour change is just one way to influence the same global supply chains that may be simultaneously affected by policies targeting other links along the chain ().
Figure 1. Since consumers and households can exert influence over the entire supply chain, consumer-oriented sustainability actions should be considered first-class citizens when it comes to GHG mitigation options.
Many detailed studies exist examining the carbon footprint reductions afforded by various green actions, e.g. shifting diets (Alexander, Brown, Arneth, Finnigan, & Rounsevell, Citation2016; Coley, Goodliffe, & Macdiarmid, Citation1998; Hoolohan, Berners-Lee, McKinstry-West, & Hewitt, Citation2013; Springmann et al., Citation2016; Stehfest et al., Citation2009; Tukker et al., Citation2011; Vranken, Avermaete, Petalios, & Mathijs, Citation2014; Westhoek et al., Citation2014), changing transport behaviour (Greening, Citation2004; International Energy Agency, Citation1997; Roth & Kåberger, Citation2002), household purchasing (Bin & Dowlatabadi, Citation2005; Duarte et al., Citation2015; Liu, Daily, Ehrlich, & Luck, Citation2003; Minx et al., Citation2009; Munksgaard, Pedersen, & Wier, Citation2000; Zacarias-Farah & Geyer-Allély, Citation2003) disposal (Beylot, Vaxelaire, & Villeneuve, Citation2015; Lave, Hendrickson, & McMichael, Citation1994) and energy use (McKenna, Hofmann, Merkel, Fichtner, & Strachan, Citation2016) patterns, and so on. There are also many studies which decompose the average per capita carbon footprint in countries into categories in a static way, i.e. not considering actions but rather looking at the composition of demand (Ivanova et al., Citation2017; Jones & Kammen, Citation2014; Jones, Wheeler, & Kammen, Citation2018; Moran et al., Citation2018). However, there has been little work done investigating how effective these consumer options can be in the aggregate at the national scale (especially inclusive of their effects on the economy). Existing studies of consumer-facing actions tend to have narrow scope, assessed typically at the level of households, and are generally implemented using life-cycle analysis (LCA) methods, which while suitable for studies of individual products are considered less useful for macroeconomic assessments (Peters & Hertwich, Citation2006; Suh et al., Citation2004). Estimating the total potential of consumer-oriented strategies cannot be done as a simple survey of previous work since existing studies have been conducted with different methods and study scopes, and thus cannot be aggregated. Yet, we want to build on this pre-existing knowledge base. Therefore we integrated all strategies into a common carbon footprint model. This provides both a uniform, comparable methodology, and a tool to evaluate interactions and competition between the strategies.
While behavioural change is often discussed as a potentially powerful driver of GHG reductions, comprehensive assessments of the opportunities from such measures have remained elusive. A detailed study of consumer behaviour options along the consumer-to-producer supply chains in Austria stands as an exception (Steininger et al., Citation2018). There are many studies evaluating the impact of decisions at the household level, but rarely have these studies been combined and modelled in a macroeconomic context to also understand the impact of these actions, in aggregate, on global supply chains and induced remote emissions. Wynes and Nicholas (Citation2017) assessed a portfolio of consumer behaviour options but focused on identifying the most impactful actions (they pointed to reducing air travel and, controversially (see van Brandstedt & Basshuysen, Citation2018), opting for a smaller family size) rather than evaluating the potential macroeconomic impacts of widespread adoption. Niamir and colleagues (Niamir, Filatova, Voinov, & Bressers, Citation2018) also address the question of how much individual behaviour changes can cumulatively affect macroeconomic CO2 emissions, but focus on advancing modelling methodology and focus their empirical results only on one province in Spain. Lacroix (Citation2018) also considered the reduction potential at the household level from a portfolio of actions. That study considered fewer actions and was based on carbon intensity coefficients sourced from a literature review, rather than a consistent MRIO model. The results of the Wynes and Lacroix studies broadly agree with our results: that food, transport, and building efficiency are crucial areas where consumer behaviour can make a substantial difference in reducing national carbon footprints.
As suggested by Gardner and Stern (Citation2008) we assembled a portfolio of consumer options. We modelled the life-cycle GHG reductions of an economy-wide implementation of bottom-up measures by integrating bottom-up information on the life cycle of the products in question and the market potential of the measures into a global multiregional input-output model developed for footprint analysis (Wood et al., Citation2017).
We systematically assembled a portfolio of 90 nonexclusive green demand-side initiatives (e.g. ‘use carpooling’, ‘turn room thermostat down 1 degree’, and ‘reduce food waste’). These options were identified by looking at seven broad categories of goods and services amenable to consumer options and considering six general kinds of consumer options at various points along the product life-cycle (see Methods). We then reviewed existing literature on the individual initiatives and used this body of work to parameterize each action as one or more interventions in a multi-region input–output (MRIO) model of the world economy. An extensive literature search was conducted in order to collect information on the supply chains and technical characteristics of the actions (see Supplementary Information, and for an example). We consider only actions available to individuals and households i.e. do not include initiatives that would require government or private section actions, but do include reduced, changed and increased spending choices (e.g. through capital expenditure), as detailed in (Wood et al., Citation2017).
Table 1. Examples of actions and impacts.
Since a significant fraction of the emissions footprint of households in developed countries is embodied in imported goods and services (Davis, Peters, & Caldeira, Citation2011; Peters, Davis, & Andrew, Citation2012), a global economic model was required in order to capture how changes in consumption behaviour can drive emissions reductions both territorially and abroad.
The model includes a basic approximation of rebound effects. In the model, income liberated by a shift or reduction in demand may be saved or spent on new purchases (whilst increased expenditure would then result in a decrease in other purchases). Forecasting the details of these rebound effects is complex (Barker, Dagoumas, & Rubin, Citation2009; Hertwich, Citation2005; Sorrell, Citation2009), so we present results both with and without income effects. We have not attempted to estimate potential price responses. Boundaries, and the scope of rebound effects, including the role of price effects, are discussed in (Azevedo, Citation2014).
The full exploitation of consumer options is contingent on behavioural aspects that are difficult to control or predict. We estimated both the technically feasible potential reduction – which we defined as the plausible amount of reduction that an ambitious policy could target – and the reduction after including an estimate of the likely actual uptake rate. The findings thus represent an upper bound on the carbon footprint reduction potential of the actions.
Material and methods
A portfolio of green actions was assembled through a systematic search. The framework for this search has been presented in (Schanes, Giljum, & Hertwich, Citation2016). Ten key consumption areas were considered. These consumption categories were selected because they both represent significant shares of emissions and because they are amenable to demand-side interventions. The consumption categories were: (1) Food; (2) Mobility; (3) Housing/construction; (4) Textiles; (5) Furniture; (6) Electronics; (7) Paper; (8) Plastics; (9) Chemicals; (10) Machinery and equipment. For each of these consumption areas six general types of behaviour change were considered: (1) Reduce consumption; (2) Reduce disposal; (3) Change consumption pattern/purchase alternative product; (4) Change use behaviour; (5) Change disposal behaviour; (6) Purchase more efficient products. A more detailed description of the different categories can be found in another paper (Schanes et al., Citation2016). Specific opportunities were then identified within each permutation of consumption category and intervention type. Some of the permutations yielded either none or several plausible actions, and the net result based on this search was 113 behaviour change opportunities. Of these, 23 could not be numerically parameterized either since no relevant data or studies could be found or since the option was at too fine a resolution to be investigated with the global economic model. The net result is a portfolio of 90 demand-side behaviour change opportunities, such as ‘Shift to more regional and seasonal food’, ‘Reduce consumption of dairy products’, or ‘Prefer naturally treated wood and furniture’, The full set of interventions are detailed in the Supplementary Information.
To model how these actions, taken by households, can affect the wider economy the various actions were used to perturb an environmentally extended multi-region input–output (MRIO) model. Our method is fully described in another paper (Wood et al., Citation2017). The calculations are based on the EXIOBASE 3 MRIO database which provides a consumption-based accounting (CBA) model for 49 regions. The total CBA footprints for each country were calculated before and after the adoptions were adopted.
The MRIO account describes production recipes, trade flows, and consumption patterns across for countries and world regions. Consumer options were parameterized to consist of one or more of: (a) a change in emissions intensity of production; (b) a change in the business economy (e.g. hospitality sector purchasing less meat and more vegetables); or (c) a shift or reduction in household expenditure patterns. For example, the behaviour change ‘Use public transit more often for commuting to work’ could be parametrized as a 10% reduction in spending on the ‘automobiles’ sector in the MRIO and a 10% increase in spending on the ‘other transport’ sector. The values were initially chosen according to what is technically feasible with current-day options, then attenuated with an estimated uptake rate. For example, for the behaviour change ‘reduce consumption of dairy products’, the technical potential was a 90% reduction, but accounting for the predicted uptake rate the final potential impact was parameterized as a 50% reduction.
Estimating the feasible technical potential and likely uptake rate of each behaviour is difficult. The values used in this study were based on a comprehensive literature survey for each option, and were discussed by the authors and Carbon-CAP project work team. The values used to parameterize each option were based on an extensive literature survey, and the numerical parametrization of each option is discussed fully in the Supplementary Information.
Formally, the options were modelled as follows. In a Leontief model of consumption-based responsibility (Leontief, Citation1974; Miller & Blair, Citation2010) carbon footprint of a final demand stimulus (e.g. the purchase of a good or service by a household) is calculated as where
is the sum of all carbon emissions occurring throughout the supply chain of the commodity;
is a row vector of carbon intensities of different industries (GHG emissions per unit of output);
is the so-called Leontief inverse, which indicates the total amount of inputs of a given product category are stimulated by the outputs of another;
is the column vector of final demand and
is the direct carbon emissions of final demand. The elements
of the technical coefficients matrix
report how much direct input of a product
is necessary to deliver one unit of output of product
.
is the identity matrix.
Each behaviour change option will cause a change in at least one of the following factors in at least one sector: (a) the carbon efficiency of production , (b) the production recipe
, or (c) final consumption
. A special case concerns the final consumption of fuels, which have direct repercussions in the direct emissions of final demand (
). Formally, we specify factors between zero and one that reduce or increase one or more particular entries of
,
or
, apply these to create a perturbed MRIO, then calculate the difference in carbon footprint
between the unperturbed and perturbed system.
This model considers the impact of actions at the margin, if taken tomorrow. Modelling the efficacy of the options if they are adopted at different points in time becomes far more complex, as the sequencing creates many different path-dependent trajectories (e.g. the carbon footprint of electric vehicles depends strongly on the carbon intensity of the electricity used to fuel them). Some of the behaviour changes considered affect the volume of a particular stock while other affect yearly flows. We considered the impact of a particular behaviour change as the yearly impact in a future year in which the relevant stock has been fully replaced. For example, the impact of improving building insulation is the comparison between the status quo and a situation where a given fraction of existing buildings and the same fraction of new construction has improved insulation. In other words, we compare the baseline scenario against a future steady-state situation in which the relevant stock has been replaced following the change.
The rebound effect – i.e. how income liberated by reduced spending in one area is saved or spent in different ways – is an important aspect to consider. In our model, first-order rebound effects are considered. Income liberated by shifts or reductions in household expenditure was assumed to be spent according to a marginal consumption model informed by estimated product level income elasticities (see Wood et al., Citation2017, for full details). To provide further context to the results we also present the results with the rebound effect modelling disabled, i.e. assuming the liberated income is not spent. This also equivalent to buying higher-quality goods, i.e. spending the same amount of money in a category but buying a smaller physical quantity.
Results
Our findings indicate that consumer behaviour change options can contribute substantially to reducing total emissions. For the European Union’s 27 countries (EU27), if all options in the portfolio were adopted, we estimate the EU could reduce its territorial emissions by 30% and its total carbon footprint by 25%, or 1.4 Gt (). Imported embodied emissions can be significantly affected. In the EU, approximately 40% of the EU consumption footprint is due to GHG emissions embodied in net imports. Of the total emissions reduction delivered by the portfolio of consumer options, fully one quarter (25%) came in the form of reduced indirect emissions from upstream suppliers outside the EU (the remainder come in the form of reduced territorial direct emissions). The rebound effect is not easy to measure (Font Vivanco, Kemp, & van der Voet, Citation2016; Hertwich, Citation2005). We also present results with the rebound effect modelling disabled (). With the rebound effect disabled (this can equivalently be interpreted as a shift to buying higher-quality alternative goods in the same category), the total reduction potential rises to a 32% reduction.
Table 2. Estimated reduction in global carbon emissions associated with EU consumption after implementing the full portfolio of consumer behavior options. Changes in domestic behaviour can induce reductions in the foreign portion of the carbon footprint due to reduced/altered imports.
The complete results are provided in the Supplementary Information file. The complete set of results is kept in the SI for two reasons: one, for space, as the full list occupies several typset pages, and second, the precision of the results decreases as more specific actions are considered, so while in aggregate stochastic errors cancel, presenting a concrete or ranked list of actions as a central result would imply a higher degree of certainty for those particular values than is reasonable.
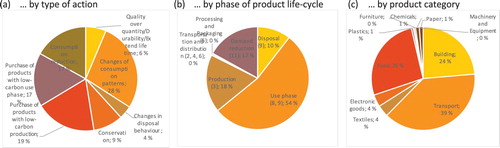
The impact of the portfolio can be evaluated in several ways (). Viewing the portfolio by type of action, the most impactful types of action were to change the consumption pattern (delivering 28% of the total reduction) and reduce consumption (26%), and to switch to using goods with a lower-carbon production and low-carbon use phase (an additional 17% and 19%, respectively). Improving conservation, disposal behaviour, and extending product lifetime had less effect (9%, 4%, and 6% contribution to total reduction, respectively). The total portfolio reductions may also be viewed by the phase of product life-cycle which is targeted by the behaviour change. By phase of the product life-cycle, options aimed at the use phase were the most effective, delivering 54% of the total reductions of the portfolio. Options aimed at the production, purchasing, and disposal phases delivered the other 46%. Finally, viewing the portfolio by product category, options regarding transport, buildings, and food were highly dominant, delivering 39%, 24%, and 26%, respectively, of the total portfolio impact. Reductions from all other six-product categories accounted for the remaining 12%.
Figure 2. The portfolio of green actions was assembled by systematically considering how various consumer actions could be adopted at different points in the product life-cycle to amenable groups of products. Of the estimated 29% reduction in EU carbon footprint, various types of actions are equally effective (a), with a focus at the use, production, and disposal phases (b), and are far more important for transport, food, and buildings (c) than for other product categories.
The transport/mobility category encompasses some of the most significant classes of carbon emissions, including air travel and the use of private vehicles (Sims et al., Citation2014). Unlike the majority of consumer activities, these entail large direct (operational) emissions on top of those embodied in construction, maintenance and various supply chain activities. This contributes to making mobility one of the largest sources of carbon footprint in the EU (European Environment Agency, Citation2008) but it also presents an opportunity for reduction because environmentally minded consumers are acutely aware of the emission-intensive nature of these activities. We find significant scope for carbon footprint reduction, particularly through efforts to decarbonize the private vehicle stock and change private mobility patterns e.g. to increase average seat occupancy rates and the shares of journeys by public transport or non-motorized alternatives. The transport-related options considered in this study are primarily behavioural changes using existing transport infrastructure, not technical changes in the actual transport infrastructure itself. Thus our assessment of reductions from mobility represents only a very small fraction of total emissions reduction potential from improved transport systems.
Food consumption is one of the most important contributors to the total carbon footprint in industrialized countries (Ivanova et al., Citation2015; Jones & Kammen, Citation2011). The options in the food category were chosen based on the results from the literature review indicating which food choices offer higher effectiveness in terms of reducing life-cycle GHG emissions. The portfolio included options such as shifting diets away from dairy products and carbon-intensive meats (i.e. beef) towards white meat or vegetarian alternative, and reducing household food waste. In the current assessment, the combined effect initiatives of food-related initiatives can deliver an estimated 640 Mt reduction in the EU’s total footprint. The question of whether a shift to an entirely plant-based diet is feasible, and if so, how much GHG reductions that would yield, is a topic of active research (Baroni, Cenci, Tettamanti, & Berati, Citation2006; Hilborn, Banobi, Hall, Pucylowski, & Walsworth, Citation2018; Poore & Nemecek, Citation2018; Ripple et al., Citation2013; Schanes et al., Citation2016; Springmann et al., Citation2016; White & Hall, Citation2017).
Of all the options surveyed, we found that a large number contribute negligibly at the national level. A total of 65 consumer options, such as ‘reuse toilet paper’, and ‘donate clothes to charity’, contribute in total just 5% to the total reduction offered by the complete portfolio.
The options related to transport and buildings dominate the results. A majority of the green options make negligible contributions. Some behaviour changes which at first glance seem positive can actually ultimately contribute negatively, due either to rebound effects or since the new good is more carbon intensive given today’s energy mix. Such negative rebounds occur for example in option #86, (shift from print to e-readers) and in several of the food options, where spending liberated after satisfying the diet with cheaper vegetables rather than expensive meat are spent on the current household consumption bundle which is more carbon-intensive than the new vegetarian diet. The relatively coarse modelling used in this synthesis necessarily provides only preliminary results. The contribution of this work is in assembling a comprehensive portfolio of options and proposing a way to quantify the potential contribution of behavioural change to GHG reductions.
Discussion
The green consumption options considered can interact in complex ways. Synergies can be positive, neutral, or negative. Synergies are positive when two or more behaviours adopted together contribute more than they would if adopted individually (for example, shifting to a more vegetarian diet and choosing more local produce). If consumer options overlap then there are negative synergies, since their impact together is less than their sum if considered individually (for example increased biking could reduce the total impact of mass transit or vehicle electrification programmes, or increased biking could induce higher demand for meat). It is possible that initiatives to reduce carbon intensity could trigger negative ancillary effects, though in practice these are extremely rare or possibly non-existent. This size of synergistic effects was estimated by comparing the total reduction when options were incrementally adopted one-by-one against the total reduction when all options were adopted but then excluded one-by-one. We find the synergistic effects are minor, with the net positive synergistic effects contributing only ≈2% of the estimated total reduction.
The options considered in this study were chosen in such a manner as to be nonexclusive at the levels of adoption considered (e.g. it is possible for an individual to both shift 5% of their trips to bicycle and 5% to bus, changing transport for a total of 10% of their trips). At higher levels of adoption – higher than were considered in this study – synergistic effects could increase. Additionally, we did not consider how any social effects could increase or decrease the adoption rate, though this is an interesting question that has received some attention (Barnes et al., Citation2016).
The modelling approach employed in this study is a simplified one, designed to provide high-level, indicative findings. Each of the green actions considered could be (and for many, is) a specific research topic in and of itself. The model used here does not pretend to capture all of the many other factors that could determine the efficacy of each green action. These factors include social, personal, societal, economic, technical, political, and economic factors, the latter of both government and private sector actors.
Another area that can affect the reliability of the results is the MRIO table used, in particular, the degree of sectoral resolution. The EXIOBASE MRIO is one of the most detailed available, resolving 200 sectors in each country. The actions in the portfolio often target products, services, and actions that are more detailed than those described by the 200-sector classification. Though every effort is made to appropriately link actions and the parameterized value of their impact to the correct sector(s) in the MRIO, it is possible that mis-allocation or sectoral aggregation can affect the results. Overall, the effect of sectoral allocation is a known and well-studied problem in the MRIO literature (c.f. de Koning et al., Citation2015), and the newest generation of MRIO databases, of which EXIOBASE is one, provide the best available macroeconomic databases available in terms of sectoral resolution. Furthermore, the MRIO model used in this study considers each European country, individually, as well as 15 of its major trading partners as individual countries, whilst the remainder of the world is aggregated into 5 world regions. Subnational heterogeneity in production intensities is not captured, and instead the contribution of each country to global supply chains uses that country’s national sectoral-average production intensities.
Additionally, related to this underlying issue of sectoral detail are potential biases introduced by a switch to goods in the same sector but of different quality, or variations within supply chains that cannot be detected. For example, if British consumers were to buy fewer, but more high quality and expensive French shoes, and also more but cheaper German shoes, and the monetary value of both international trade flows were the same, the monetary model used here would not be able to detect this shift in purchasing patterns. Monetary MRIO databases are limited in their ability to detect changes in the quality of goods or in changes of physical flows when monetary flows remain unchanged. As with the limitations related to sectoral detail, these issues are well known and studied in the MRIO literature.
MRIO models are retrospective and do not provide any forecast of how the economic system will evolve in response to shocks or evolving technologies. Therefore, this study considers behaviour change ‘at the margin’, i.e. if taken ‘today’ (technically, if taken in the year 2015, which is the data year of the study). Forecasting how the economy will evolve and/or respond to shifting consumer demand or constraints would be a research question suitable for a different model. The main consideration excluded in our model is the additional ramification that demand change, and subsequent price change will have through the economy (macro-economic rebounds). Further research could compare the output of computable general equilibrium or other macro-economic models, which capture such effects, but operate at a higher level of aggregation.
In terms of potential over- or under-estimation of the impact effectiveness of the actions, rather than treat each model parameter value as an estimate of a mean with some associated standard deviation, the model parameters were set as ‘upper bound’ values. The values used for the impact and uptake rates of each action were estimated as the high end of what is technologically, economically, and socially feasible, in today’s context. While it could be that actions are more effective than we have modelled, or uptake rates greater than we have allowed, our expectation is that the results here are presented as an upper bound indicating the higher end of what kind of emissions reduction potential could be realized. Finally, there could be substantial variation among regions or populations in how popular or effective particular green actions(s) are. In terms of promoting green actions it is important to tailor the actions to particular regional needs and socio-geo-demographic preferences and profiles.
Conclusion
With the need to increase the political ambition, and the breadth of the policy toolbox, in order to radically reduce emissions in line with a global warming target of 2°C, attention has been placed on the potential for consumer-side policy to be increased. Here, we look at a broad range of consumer policies that could have potential direct and supply chain impacts on the level of greenhouse gas emissions produced. We use a single modelling framework that captures impacts in both domestic and foreign markets for European policy. Using a broad range of literature to parametrise the changes in both household consumption and supply chains, we find that, in total, the options considered could deliver up to a ∼25% reduction in the total carbon footprint in Europe. We consider our estimates to reflect the maximum potential impact, and expect that much higher levels of uptake of consumer mitigation options and consequent social change is required for higher levels of effectiveness.
Supplemental Material
Download Zip (155.9 KB)Disclosure statement
No potential conflict of interest was reported by the authors.
ORCID
Daniel Moran http://orcid.org/0000-0002-2310-2275
Richard Wood http://orcid.org/0000-0002-7906-3324
Edgar Hertwich http://orcid.org/0000-0002-4934-3421
Joao F. D. Rodriguez http://orcid.org/0000-0002-1437-0059
Additional information
Funding
Related Research Data
References
- Alexander, P., Brown, C., Arneth, A., Finnigan, J., & Rounsevell, M. D. A. (2016). Human appropriation of land for food: The role of diet. Global Environmental Change, 41, 88–98. doi: 10.1016/j.gloenvcha.2016.09.005
- Azevedo, I. M. L. (2014). Consumer end-use energy efficiency and rebound effects. Annual Review of Environment and Resources, 39, 393–418. doi: 10.1146/annurev-environ-021913-153558
- Barker, T., Dagoumas, A., & Rubin, J. (2009). The macroeconomic rebound effect and the world economy. Energy Efficiency, 2, 411–427. doi: 10.1007/s12053-009-9053-y
- Barnes, M. L., Lynham, J., Kalberg, K., & Leung, P. (2016). Social networks and environmental outcomes. Proceedings of the National Academy of Sciences of the United States of America, 113, 6466–6471. Retrieved from http://www.pnas.org/lookup/doi/10.1073/pnas.1523245113
- Baroni, L., Cenci, L., Tettamanti, M., & Berati, M. (2006). Evaluating the environmental impact of various dietary patterns combined with different food production systems. European Journal of Clinical Nutrition, 61, 279. doi: 10.1038/sj.ejcn.1602522
- Beylot, A., Vaxelaire, S., & Villeneuve, J. (2015). Reducing gaseous emissions and resource consumption embodied in French final demand: How much can waste policies contribute? Journal of Industrial Ecology. doi: 10.1111/jiec.12318
- Bin, S., & Dowlatabadi, H. (2005). Consumer lifestyle approach to US energy use and the related CO2 emissions. Energy Policy, 33, 197–208. Retrieved from http://www.sciencedirect.com/science/article/B6V2W-49XPHSD-2/2/2637d35c29d55f04ed2cd4b401f22af1 doi: 10.1016/S0301-4215(03)00210-6
- Chester, M., Pincetl, S., Elizabeth, Z., Eisenstein, W., & Matute, J. (2013). Infrastructure and automobile shifts: Positioning transit to reduce life-cycle environmental impacts for urban sustainability goals. Environmental Research Letters, 8, 015041. doi: 10.1088/1748-9326/8/1/015041
- Coley, D. A., Goodliffe, E., & Macdiarmid, J. (1998). The embodied energy of food: The role of diet. Energy Policy, 26, 455–459. doi: 10.1016/S0301-4215(97)00159-6
- Creutzig, F., Fernandez, B., Haberl, H., Khosla, R., Mulugetta, Y., & Seto, K. C. (2016). Beyond technology: Demand-side solutions for climate change mitigation. Annual Review of Environment and Resources, 41, 173–198. doi: 10.1146/annurev-environ-110615-085428
- Creutzig, F., Roy, J., Lamb, W. F., Azevedo, I. M. L., Bruine de Bruin, W., Dalkmann, H., … Weber, E. U. (2018). Towards demand-side solutions for mitigating climate change. Nature Climate Change, 8, 268–271. doi: 10.1038/s41558-018-0121-1
- Davis, S. J., Peters, G. P., & Caldeira, K. (2011). The supply chain of CO2 emissions. Proceedings of the National Academy of Sciences of the United States of America, 108(45), 18554–188559. doi: 10.1073/pnas.1107409108
- de Koning, A., Bruckner, M., Lutter, S., Wood, R., Stadler, K., & Tukker, A. (2015). Effect of aggregation and disaggregation on embodied material use of products in input–output analysis. Ecological Economics, 116, 289–299. Retrieved from http://www.sciencedirect.com/science/article/pii/S0921800915002232 doi: 10.1016/j.ecolecon.2015.05.008
- Dietz, T., Gardner, G. T., Gilligan, J., Stern, P. C., & Vandenbergh, M. P. (2009). Household actions can provide a behavioral wedge to rapidly reduce US carbon emissions. Proceedings of the National Academy of Sciences of the United States of America, 106, 18452–18456. Retrieved from http://www.ncbi.nlm.nih.gov/pubmed/19858494 doi: 10.1073/pnas.0908738106
- Duarte, R., Feng, K., Hubacek, K., Sánchez-Chóliz, J., Sarasa, C., & Sun, L. (2015). Modeling the carbon consequences of pro-environmental consumer behavior. Applied Energy, 184, 1207–1216. doi: 10.1016/j.apenergy.2015.09.101
- European Environment Agency. (2008). Greenhouse gas emission trends and projections in Europe 2011 – tracking progress towards Kyoto and 2020 targets.
- Fawcett, A. A., Iyer, G. C., Clarke, L. E., Edmonds, J. A., Hultman, N. E., McJeon, H. C., … Shi, W. (2015). Can Paris pledges avert severe climate change? Science 80, 350.
- Font Vivanco, D., Kemp, R., & van der Voet, E. (2016). How to deal with the rebound effect? A policy-oriented approach. Energy Policy, 94, 114–125. Retrieved from http://www.sciencedirect.com/science/article/pii/S0301421516301586 doi: 10.1016/j.enpol.2016.03.054
- Gardner, G. T., & Stern, P. C. (2008). The short list - the most effective actions US households can take to curb climate change. Environment, 50, 12–24.
- Greening, L. A. (2004). Effects of human behavior on aggregate carbon intensity of personal transportation: Comparison of 10 OECD countries for the period 1970-1993. Energy Economics, 26, 1–30. doi: 10.1016/j.eneco.2003.05.001
- Hellweg, S., & Milà i Canals, L. (2014). Emerging approaches, challenges and opportunities in life cycle assessment. Science, 80, 344.
- Hertwich, E. G. (2005). Consumption & the rebound effect: An industrial ecology perspective. Journal of Industrial Ecology, 9, 85–98. doi: 10.1162/1088198054084635
- Hilborn, R., Banobi, J., Hall, S., Pucylowski, T., & Walsworth, T. (2018). The environmental cost of animal source foods. Frontiers in Ecology and the Environment. doi:10.1002/fee.1822
- Hoekstra, A. Y., & Wiedmann, T. O. (2014). Humanity’s unsustainable environmental footprint. Science, 344, 1114–1117. Retrieved from http://www.sciencemag.org/content/344/6188/1114.abstract doi: 10.1126/science.1248365
- Hoolohan, C., Berners-Lee, M., McKinstry-West, J., & Hewitt, C. N. (2013). Mitigating the greenhouse gas emissions embodied in food through realistic consumer choices. Energy Policy, 63, 1065–1074. doi:10.1016/j.enpol.2013.09.046
- International Energy Agency. (1997). Transport, energy and climate change.
- Ivanova, D., Stadler, K., Steen-Olsen, K., Wood, R., Vita, G., Tukker, A., & Hertwich, E. G. (2015). Environmental impact assessment of household consumption. Journal of Industrial Ecology, 20, 526–536. doi: 10.1111/jiec.12371
- Ivanova, D., Vita, G., Steen-Olsen, K., Stadler, K., Melo, P. C., Wood, R., … Hertwich, E. G. (2017). Mapping the carbon footprint of EU regions. Environmental Research Letters, 12. doi: 10.1088/1748-9326/aa6da9
- Jones, C., & Kammen, D. M. (2014). Spatial distribution of U.S. household carbon footprints reveals suburbanization undermines greenhouse gas benefits of urban population density. Environmental Science & Technology, 48, 895–902. doi: 10.1021/es4034364
- Jones, C. M., & Kammen, D. M. (2011). Quantifying carbon footprint reduction opportunities for U.S. households and communities. Environmental Science & Technology, 45, 4088–4095. doi: 10.1021/es102221h
- Jones, C. M., Wheeler, S. M., & Kammen, D. M. (2018). Carbon footprint planning: Quantifying local and state mitigation opportunities for 700 California cities. Urban Plan, 3. Retrieved from https://www.cogitatiopress.com/urbanplanning/article/view/1218
- Koide, R., & Akenji, L. (2017). Assessment of policy integration of sustainable consumption and production into national policies. Resources 6(4), 48.
- Lacroix, K. (2018). Comparing the relative mitigation potential of individual pro-environmental behaviors. Journal of Cleaner Production, 195, 1398–1407. Retrieved from http://www.sciencedirect.com/science/article/pii/S0959652618313982 doi: 10.1016/j.jclepro.2018.05.068
- Lave, L. B., Hendrickson, C., & McMichael, F. C. (1994). Recycling decisions and green design. Environmental Science & Technology, 28, 19A–24A. doi: 10.1021/es00050a001
- Leontief, W. (1974). Structure of the world economy. American Economic Review, LXIV, 823–834.
- Liu, J., Daily, G. C., Ehrlich, P. R., & Luck, G. W. (2003). Effects of household dynamics on resource consumption and biodiversity. Nature, 421, 530–533. doi: 10.1038/nature01359
- McKenna, R., Hofmann, L., Merkel, E., Fichtner, W., & Strachan, N. (2016). Analysing socioeconomic diversity and scaling effects on residential electricity load profiles in the context of low carbon technology uptake. Energy Policy, 97, 13–26. doi: 10.1016/j.enpol.2016.06.042
- Miller, R. E., & Blair, P. D. (2010). Input-output analysis: Foundations and extensions. Englewood Cliffs, NJ: Prentice-Hall.
- Minx, J. C., Weidmann, T., Wood, R., Lenzen, M., Peters, G. P., Owen, A., … Ackerman, F. (2009). Input-output analysis and carbon footprinting: An overview of applications. Economic Systems Research, 21, 187–216. doi: 10.1080/09535310903541298
- Moran, D., Kanemoto, K., Jiborn, M., Wood, R., Többen, J., & Seto, K. C. (2018). Carbon footprints of 13000 cities. Environmental Research Letters, 13, 064041. Retrieved from http://stacks.iop.org/1748-9326/13/i=6/a=064041?key=crossref.db7049832435becaa9c43b1fd7349177 doi: 10.1088/1748-9326/aac72a
- Munksgaard, J., Pedersen, K. A., & Wier, M. (2000). Impact of household consumption on CO2 emissions. Energy Economics, 22, 423–440. doi: 10.1016/S0140-9883(99)00033-X
- Niamir, L., Filatova, T., Voinov, A., & Bressers, H. (2018). Transition to low-carbon economy: Assessing cumulative impacts of individual behavioral changes. Energy Policy, 118, 325–345. Retrieved from https://www.sciencedirect.com/science/article/pii/S0301421518301782 doi: 10.1016/j.enpol.2018.03.045
- O’Rourke, D. (2014). The science of sustainable supply chains. Science, 344, 1124–1127. Retrieved from http://www.sciencemag.org/content/344/6188/1124.abstractN2 - Recent advances in the science and technology of global supply chain management offer near–real-time demand-response systems for decision-makers across production networks. Technology is helping
- Pacala, S., & Socolow, R. (2004). Stabilization wedges: Solving the climate problem for the next 50 years with current technologies. Science, 305, 968–972. Retrieved from http://www.sciencemag.org/content/305/5686/968.abstract doi: 10.1126/science.1100103
- Peters, G. P., Davis, S. J., & Andrew, R. M. (2012). A synthesis of carbon in international trade. Biogeosciences Discuss, 9, 3247–3276. Retrieved from http://www.scopus.com/inward/record.url?eid=2-s2.0-84861649153&partnerID=40&md5=60f9db612d4b9b2865cce3b48afa3ee5 doi: 10.5194/bg-9-3247-2012
- Peters, G. P., & Hertwich, E. G. (2006). The application of multi-regional input-output analysis to industrial ecology – evaluating trans-boundary environmental impacts. In S. Suh (Ed.), Handbook of input-output analysis in industrial ecology (pp. 847–863). 2013.
- Poore, J., & Nemecek, T. (2018). Reducing food’s environmental impacts through producers and consumers. Science, 360, 987–992. Retrieved from http://science.sciencemag.org/content/360/6392/987.abstract doi: 10.1126/science.aaq0216
- Ripple, W. J., Smith, P., Haberl, H., Montzka, S. A., McAlpine, C., & Boucher, D. H. (2013). Ruminants, climate change and climate policy. Nature Climate Change, 4(2). doi: 10.1038/nclimate2081
- Roth, A., & Kåberger, T. (2002). Making transport systems sustainable. Journal of Cleaner Production, 10, 361–371. doi: 10.1016/S0959-6526(01)00052-X
- Schanes, K., Giljum, S., & Hertwich, E. (2016). Low carbon lifestyles: A framework to structure consumption strategies and options to reduce carbon footprints. Journal of Cleaner Production, 139, 1033–1043. Retrieved from http://www.sciencedirect.com/science/article/pii/S095965261631318X doi: 10.1016/j.jclepro.2016.08.154
- Scholz, K., Eriksson, M., & Strid, I. (2015). Carbon footprint of supermarket food waste. Resources, Conservation and Recycling, 94, 56–65. doi: 10.1016/j.resconrec.2014.11.016
- Sims, R., Schaeffer, R., Creutzig, F., Cruz-Núñez, X., D’Agosto, M., Dimitriu, D., … Tiwari, G. (2014). Transport climate change 2014: Mitigation of climate change. Contribution of Working Group III to the Fifth Assessment Report of the Intergovernmental Panel on climate change. O. Edenhofer, R. Pichs-Madruga, Y. Sokona, E. Farahani, S. Kadner, K. Seyboth, A. Adler, I. Baum, S. Brunner, P. Eickemeier, B. Kriemann, J. Savolainen, S. Schlömer, C. von Stechow, T. Zwickel and J. C. Minx (Eds.). Cambridge: Cambridge University Press.
- Sorrell, S. (2009). Jevons’ paradox revisited: The evidence for backfire from improved energy efficiency. Energy Policy, 37, 1456–1469. Retrieved from http://www.sciencedirect.com/science/article/B6V2W-4VDGTNF-1/2/16a2cbbf10e85057656fb75ad7ca17aa doi: 10.1016/j.enpol.2008.12.003
- Springmann, M., Mason, D., Croz, D., Robinson, S., Wiebe, K., Godfray, H. C. J., Rayner M., & Scarborough P. (2016). Mitigation potential and global health impacts from emissions pricing of food commodities. Nature Climate Change. Advance on online. doi.org/10.1038/nclimate3155
- Stavros, A., Marco, S., Kate, S., John, B., & Andy, G. (2016). Consumption-based carbon accounting: Does it have a future? Wiley Interdisciplinary Reviews: Climate Change, 8, e438. doi.org/10.1002/wcc.438
- Stehfest, E., Bouwman, L., van Vuuren, D., den Elzen, M. J., Eickhout, B., & Kabat, P. (2009). Climate benefits of changing diet. Climatic Change, 95, 83–102. doi: 10.1007/s10584-008-9534-6
- Steininger, K. W., Munoz, P., Karstensen, J., Peters, G. P., Strohmaier, R., & Velázquez, E. (2018). Austria’s consumption-based greenhouse gas emissions: Identifying sectoral sources and destinations. Global Environmental Change, 48, 226–242. Retrieved from https://www.sciencedirect.com/science/article/pii/S0959378017304508?via%3Dihub doi: 10.1016/j.gloenvcha.2017.11.011
- Suh, S., Lenzen, M., Treloar, G. J., Hondo, H., Horvath, A., Huppes, G., … Norris, G. (2004). System boundary selection in life-cycle inventories using hybrid approaches. Environmental Science & Technology, 38, 657–664. doi: 10.1021/es0263745
- Tukker, A., Goldbohm, R. A., de Koning, A., Verheijden, M., Kleijn, R., Wolf, O., … Rueda-Cantuche, J. M. (2011). Environmental impacts of changes to healthier diets in Europe. Ecological Economics, 70, 1776–1788. doi: 10.1016/j.ecolecon.2011.05.001
- van Brandstedt, P., & Basshuysen, E. (2018). Attributing and calculating responsibility for reproductive choices: Comment on Wynes and Nicholas. Environmental Research Letters. Retrieved from http://iopscience.iop.org/10.1088/1748-9326/aab213
- Vranken, L., Avermaete, T., Petalios, D., & Mathijs, E. (2014). Curbing global meat consumption: Emerging evidence of a second nutrition transition. Environmental Science & Policy, 39, 95–106. doi: 10.1016/j.envsci.2014.02.009
- Westhoek, H., Lesschen, J. P., Rood, T., Wagner, S., De Marco, A., Murphy-Bokern, D., … Oenema, O. (2014). Food choices, health and environment: Effects of cutting Europe’s meat and dairy intake. Global Environmental Change, 26, 196–205. doi: 10.1016/j.gloenvcha.2014.02.004
- White, R. R., & Hall, M. B. (2017). Nutritional and greenhouse gas impacts of removing animals from US agriculture. Proceedings of the National Academy of Sciences of the United States of America, 114, E10301–E10308. Retrieved from http://www.pnas.org/content/114/48/E10301.abstract doi: 10.1073/pnas.1707322114
- Wood, R., Moran, D., Stadler, K., Ivanova, D., Steen-Olsen, K., Tisserant, A., & Hertwich, E. (2017). Prioritizing consumption-based carbon policy based on the evaluation of mitigation potential using input-output methods. Journal of Industrial Ecology, 22, 540–552. doi: /10.1111/jiec.12702
- Wynes, S., & Nicholas, K. A. (2017). The climate mitigation gap: Education and government recommendations miss the most effective individual actions. Environmental Research Letters, 12, 074024. doi:10.1088/1748-9326/aa7541
- Zacarias-Farah, A., & Geyer-Allély, E. (2003). Household consumption patterns in OECD countries: Trends and figures. Journal of Cleaner Production, 11, 818–827. doi: 10.1016/S0959-6526(02)00155-5