
ABSTRACT
The production of basic materials accounts for around 25% of global greenhouse gas emissions. Existing measures to reduce emissions from industry are limited due to a combination of competitiveness concerns and a lack of technological options available to producers. In this paper, we assess the possibility of implementing a materials charge to reduce demand for basic industrial products and, hence, also reduce industrial emission levels. The modelling shows that a charge equivalent to around €80/tCO2 could reduce the EU’s total (energy plus process) CO2 emissions by up to 10% by 2050, depending on the substitution options available. The materials charge could lead to small GDP increases and a minor reduction in overall employment levels.
Key policy insights
Full carbon price pass through along the materials value chain creates incentives for resource efficiency and substitution in the value chain of material use.
Most macroeconomic models ignore mitigation opportunities in the value chain, as do carbon pricing mechanisms for industrial emitters, which largely mute incentives for mitigation opportunities with free allowance allocation.
Including consumption at a benchmark level in emission trading systems reinstates a full carbon price incentive for all mitigation opportunities while avoiding competitive distortions and carbon leakage risks.
Macroeconomic modelling shows that this allows for an additional 10% emission reduction accompanied by a slight GDP increase and employment reduction. Long-term clarity on carbon leakage protection furthermore strengthens low-carbon investment frameworks.
1. Introduction and policy background
Emissions linked to the production of basic materials like steel and cement constitute around 25% of global greenhouse gas emissions (IEA, Citation2017). Emissions from the production of materials both arise directly as part of the chemical transformation process (termed ‘process emissions’) and through the large amounts of energy that are used in production. Initially in the basic material sectors, emission reduction levers have largely been associated with improving production efficiency and developing breakthrough technologies for low-carbon production (including the use of industrial carbon capture and storage (CCS); see e.g. a review of cement sector roadmaps in Neuhoff et al., Citation2014).
It is becoming increasingly apparent that additional mitigation opportunities will be required to reduce the level of emissions linked to the production of basic materials if the world is to achieve the goals of the Paris Agreement (UNFCCC, Citation2015) without both exhausting renewable energy potentials (German Federation of Industry, Citation2018) or relying on very large amounts of (as yet unproven) negative emissions technologies (IPCC, Citation2014). Possible measures include the more efficient use of materials, material substitution, recycling and re-use, and the extension of product lifetimes (including repair and sharing of products). Climate policy design is only gradually waking up to these opportunities and may benefit from unlocking synergies with circular economy and resource efficiency policy objectives and instruments (European Commission, Citation2015).
To date, emission trading, as a central climate policy instrument, has largely focused on emission reductions at the production level while carbon price incentives along the value chain have been largely muted. This is the case because in all emission trading systems CO2 allowances are allocated freely to industrial emitters as carbon leakage protection to ensure that carbon pricing does not trigger relocation of production or investment choices. While one-off free allowance allocation would not reduce carbon price pass-through, it would also not serve as carbon leakage protection. Hence in all emission trading schemes, free allowance allocation is conditional on continued operation. As a result, decisions of new investment and closure of installations will be based on the cost of emissions net of free allowance allocation. Free allowance allocation thus reduces the product price above which plants are viable and thus the equilibrium product price and carbon price pass-through. Furthermore, the volume of free allowance allocation is increasingly linked to actual production levels. Post 2020 in Europe, for example, allocation is adjusted as soon as two-year production volumes of an installation increase or decrease by 15% (EU ETS, Citation2018). In addition, for internationally tradable materials, competition with regions with lower opportunity costs of carbon reduces the equilibrium carbon price pass-through (Monjon & Quirion, Citation2011).
The economic modelling community has also so far largely focused on price-based instruments for reducing emissions from materials production. Recent exercises have found that very high carbon prices would be required to meet ambitious emission reduction targets. In the IPCC’s 5th Assessment Report, mean carbon prices are over $5,000/tCO2 (in 2005 prices) by 2100 in the modelled decarbonization scenarios (IPCC, Citation2014). Although there is a wide range of results, 2018 assessments of 1.5°C scenarios (e.g. Rogelj et al., Citation2018) find similar values.
This finding reflects in part the difficulty for industrial sectors to reduce process emissions. In reality, such high levels of carbon pricing are politically infeasible and so models must be developed to consider alternative policy options (Mercure, Pollitt, Bassi, Viñuales, & Edwards, Citation2016). However, a high sectoral aggregation used in the models (which are limited by the level of detail in the economic data that they use) means that basic materials are interpreted as complementary production inputs. This treatment excludes the possibilities of emission reductions potentials from material efficiency, recycling, re-use, repair, and sharing in the models (Löschel, Citation2007).
Effective decarbonization will likely require a mix of policies to address different decision moments (Grubb, Neuhoff, & Hourcade, Citation2014), combining for example product standards (Scott, Roelich, Owen, & Barrett, Citation2018) with carbon pricing to make these new mitigation opportunities viable. However, concerns about carbon leakage are in particular of relevance for basic materials. In the absence of a global carbon price, policy makers must, therefore, find a way of providing a price-based incentive to reduce emissions from material production, while avoiding the potential for large-scale carbon leakage. Ultimately, such measures could help to enhance material and resource efficiency throughout the economy and thus enhance public acceptance of climate policy (Cherry, Scott, Barrett, & Pidgeon, Citation2018).
In this paper, we consider one such option, in the form of a consumption charge on selected basic materials. In the European context, the inclusion of consumption of carbon intensive materials into the European Emission Trading System (EU ETS) has been explored in detail (Neuhoff et al., Citation2016) and is an option for consideration by the European Commission in its mandate to keep the Directive under review in light of international developments and the efforts undertaken to achieve the long-term objectives of the Paris Agreement. Effectively, products sold to European consumers are subject to a charge that is proportional to the weight of the materials covered by the consumption charge, multiplied by a benchmark for the carbon intensity of the production of the material through a conventional production process (Pauliuk, Neuhoff, Owen, & Wood, Citation2016). Such benchmarks have already been defined and quantified for the free allowance allocation and power price compensation under the existing EU ETS and other emission trading schemes globally (Zipperer, Sato, & Neuhoff, Citation2017). The charge applies to materials and products irrespective of production process or location, and hence is considered a consumption charge that is compatible with World Trade Organisation rules; and therefore can be implemented as part of the environmental regulation of the EU ETS (Ismer & Haussner, Citation2016).
The design also builds on similar mechanisms that have been implemented in Chinese ETS pilots and in the Korean ETS to reinstate the carbon price signal for electricity consumers. In both countries, carbon price signals are not passed through from power generation to final consumers because the wholesale electricity market is regulated. Commercial and industrial consumers of electricity are instead required to surrender CO2 allowances for their electricity consumption based on a standardized benchmark. The carbon price signal is thus reinstated for electricity consumers (Munnings, Acworth, Sartor, Kim, & Neuhoff, Citation2018).
In our analysis, we estimate and quantify the long-term economic implications of the inclusion of consumption charges in emission trading against a reference scenario of persistent regional carbon pricing schemes that pursue carbon leakage protection solely using free allowance allocation. We focus on materials with large contributions to global CO2 emissions: cement 7%, steel 9% and aluminium 2% (based on IEA, Citation2017). The three materials would likely need to be jointly addressed by consumption charges to avoid distortions from intra-material competition in construction and automotive applications. We apply a modified version of the E3ME macro-econometric model (see Section 3) in which a demand elasticity for the selected basic materials is used as an approximation of the mitigation opportunities from material substitution, resource efficiency, recycling, re-use, repair and sharing. Three different elasticities are tested so as to assess the sensitivity of the results.
The following section describes briefly some of the previous analysis that has been carried out. Section 3 introduces the E3ME model and Section 4 describes the scenarios that were assessed. The results are presented in Section 5 and discussed further in Section 6.
2. Previous analysis
As noted above, much of the previous analysis of measures for reducing emissions from the industrial sector has focused on carbon pricing, with the same price applied to all economic sectors. The scope of previous analysis partly reflects the limitations of the modelling approaches that have been applied but also the applications of the models to find optimal pathways, rather than assess the merits of individual policies (Mercure, Lam, Billington, & Pollitt, Citation2018; Mercure et al., Citation2016).
However, the present paper is not the first modelling exercise to consider material charges. In a Computable General Equilibrium (CGE) modelling framework, Böhringer, Rosendahl, and Storrøsten (Citation2017) demonstrate the theoretical welfare benefits of complementing a scheme like the EU ETS (with output-based free allocation of allowances) with a consumption charge on the products of the sectors that receive the free allowances. The consumption charge is applied to both final consumption and the intermediate purchases of the products by other industries. The authors conduct numerical simulations with two symmetric regions and four sectors to derive the optimal consumption charge, given the value of the output-based free allocation. The overall context of the analysis is similar to that in our assessment: to implement the policy that reduces carbon leakage from unilateral climate policy, without resorting to border tax adjustments.
The model used in the present paper, E3ME, has also been applied previously to consider charges on material consumption, although at a lower level of detail. Ekins, Pollitt, Summerton, and Chewpreecha (Citation2012) describes a scenario in which charges on carbon and materials are implemented simultaneously. The modelling exercise shows that it is possible to lower material and carbon intensity while increasing slightly GDP and employment levels. However, the analysis in the paper was largely focused on aggregates (construction minerals) and other minerals, due to their higher share of weight in overall material consumption. The paper considered reducing levels of material consumption as a goal in its own right, rather than as a means to reduce CO2 emissions (our aim here), and hence did not target carbon-intensive material production. Other modelling studies using E3ME for the European Commission (see e.g. European Commission, Citation2014) use a similar classification of material types. However, the analysis in De Koning et al. (Citation2015) shows that results for more aggregate sectors cannot be extrapolated to more detailed subsectors and so it is difficult to infer estimates of emissions reductions.
The GINFORS macro-econometric model (Meyer & Lutz, Citation2007) has also been used to assess scenarios in which material consumption is reduced (see e.g. Stocker, Omann, & Jäger, Citation2012). GINFORS operates in a similar way to E3ME, with macro-econometric equations for demand fitting inside a standard accounting framework. The classifications of material types are also similar to E3ME and the analysis is therefore typically carried out at a more aggregate level.
More generally, most analysis of material flows and consumption has used an input-output based, rather than macroeconomic modelling, approach. The analysis is usually based on economic rather than physical input-output tables, but hybrid analysis is also possible (see discussion of approaches in Schoer, Wood, Arto, & Weinzettel, Citation2013). More generally, the analysis of consumption-based emissions (e.g. Hertwich & Peters, Citation2009; Minx et al., Citation2009), which also draws upon input-output analysis, also captures the emissions embodied in the trade of physical goods.
These approaches are well established and have on occasion been used for scenario analysis (e.g. De Koning, Huppes, Deetman, & Tukker, Citation2016; Wiebe, Bjelle, Többen, & Wood, Citation2018) but are less applicable to the discussion in the present paper for two reasons: first, the analysis based on these approaches is often based along the lines of the available economic data (which again is at a more aggregate level) and second, a standard input-output framework is not well equipped to deal with changes in prices. The modelling framework that we apply in this paper (see next section) in fact builds on the input-output approach; it has an input-output system at its core but allows some of the key relationships to change in response to the materials charges, representing a higher level of detail.
3. Introduction to the E3ME macro-econometric model
E3ME is a macro-econometric simulation model that combines the world’s economy, energy system and the environment to address major economic and economy-environment policy challenges in Europe and beyond. It is based on a post-Keynesian economic framework (see e.g. King, Citation2015; Lavoie, Citation2015) and does not make assumptions about optimization or optimal behaviour. The key strengths of E3ME are:
its global geographical coverage (split to 59 countries/regions, including each EU Member State explicitly)
its relatively detailed sectoral disaggregation
its econometric specification that provides a strong empirical grounding for analysis
its detailed two-way linkages and feedbacks between the economy, energy system, emissions and material demands
The model is described in more detail in the appendix. See also its online manual (Cambridge Econometrics, Citation2014) and the full list of model equations in Mercure, Pollitt, et al. (Citation2018). A summary description is provided here.
The core of E3ME is the national accounting system and a set of input-output tables and bilateral trade linkages. Together, these data provide the linkages between the sectors and the regions in the model. They are supplemented by time-series data, from which the model’s price elasticities and other behavioural parameters are estimated.
The main data sources are Eurostat and the OECD, supplemented by data from national statistical agencies for non-OECD countries. The parameters are estimated using econometric techniques, specifically an error-correction methodology (Engle & Granger, Citation1987; Hendry, Pagan, & Sargan, Citation1984) that allows for both short and long-term analysis.
The Keynesian nature of the model allows for the possibility of multiplier effects and does not rule out by assumption the possibility of ‘double dividends’ from environmental taxation (Pearce, Citation1991). In contrast to standard computable general equilibrium (CGE) models, E3ME does not assume constant returns to scale, perfect competition or maximization of social welfare. Involuntary unemployment is a standard output of the model and the interaction between the financial system and real economy is key to determining model results (Pollitt & Mercure, Citation2018).
Although one of the most detailed models of its kind, the E3ME model does not distinguish steel, aluminium and cement explicitly. Instead they fall into the sectors basic metals (steel and aluminium) and non-metallic mineral products (cement). It is not therefore possible to assess the material charges directly in the model without first carrying out a set of off-model calculations that take into account more detailed data. Furthermore, the model’s data cannot be used to estimate price elasticities at such a detailed level and so we test our scenario with a range of different elasticities. The additional calculations carried out are based on Pauliuk et al. (Citation2016) and are described in the next section.
4. Scenario descriptions
The analysis consists of a set of spreadsheet calculations and simulation with the E3ME model. The scenarios estimate the macroeconomic impacts of implementing a charge on the consumption of steel, cement and aluminium, over the period 2020–2050. There is a baseline case plus three scenarios, with the same consumption charge added in each of the three scenarios (see below). The results from the three scenarios are based on different demand-price elasticities (see ), reflecting the uncertainty on what the true price elasticity might be.
Table 1. Scenario specification.
There is a further set of three sensitivity cases in which the revenues from the materials charges are not used (see below).
Perhaps reflecting the lack of data available, there is a relatively limited literature on demand-price elasticities for basic materials. In general, the estimated values are in the region of −0.5, but there is a range of elasticity estimates available, depending on the sample characteristics and estimation approaches. For example, the E3ME long-run price estimate for ‘construction minerals’, which includes cement but also other aggregates, is −0.38. Sato and Neuhoff (Citation2007) report an elasticity of −0.3 for steel.
In our scenarios, we have chosen one scenario with zero price elasticity and two other cases to assess larger (−0.5 and unit) price elasticities. It is noted that in the scenarios assessed here, there are strong reasons to believe that the demand responses to the material charges could be higher than some of those identified previously in the literature:
The consumption charges that we are adding are permanent and increase over time, so are more likely to affect long-term behaviour than price fluctuations that are due to the changes in global commodity prices that feature in the historical data.
Our consumption charges will be applied across Europe and on all consumption of the specified materials (including imports), so substitution between different producers of the same material is not possible.
By applying the charge at European level, there is substantial incentive for companies to invest in ways of reducing material inputs and possibilities to use alternative materials, rather than relocating production.
4.1. Baseline case
The baseline case for the analysis is the set of projections published by the European Commission (Citation2016), which are derived originally from the PRIMES energy system model. For countries outside the EU, the baseline is the current policies scenario of the IEA’s World Energy Outlook publication (IEA, Citation2015).
The projections of GDP are the same as those used in the European Commission publication and the employment projections are also derived from official figures based on projections from the E3ME model (see methodological description in CEDEFOP, Citation2012). In the baseline it is assumed that there is a gradual recovery from the financial crisis and subsequent recession, with unemployment rates falling back to trend levels in most countries between 2020 and 2025.
One key aspect of the baseline projections is the level of fuel imports used, which we find below to be a key determinant of the model results. As Europe imports almost all its oil and natural gas, the baseline projections of fuel consumption define the baseline level of imports. Consumption of natural gas is expected to continue to increase, albeit at less than 0.5% pa. Oil consumption is expected to fall due to more efficient vehicles, by up to 1% pa; but the penetration of electric vehicles by 2050 remains low (electricity accounts for around 8% of total road transport energy consumption).
Within the materials sectors, total energy consumption remains broadly flat in steel and non-ferrous metals and rises by around 0.5% pa for non-metallic mineral products. The fuel mix stays comparable to that today with only minor increases in rates of electrification.
4.2. Material charge scenarios
The material charges are applied to the consumption of steel, cement and aluminium. They are defined in terms of carbon content but are applied at the same rate regardless of production method or place of production. Imported materials are subjected to the consumption charge in the same way that those domestically produced are. Exported materials are not subject to the charge.
The material charge rates are set to be equivalent to carbon charges of €20/tCO2 in 2020, gradually rising to €80/tCO2 in 2050. It is assumed that the charges are in addition to any carbon pricing from the EU ETS, which we treat as exogenous in our analysis.
As noted above, a key challenge is defining the products to be covered, as they go beyond the NACE 4-digit classification, and well beyond the NACE 2-digit classification used in the E3ME model. This means that the model inputs must be defined carefully and it is not possible to use the standard E3ME equations of material or energy consumption (and associated price elasticities), or make simple changes to the sectoral prices in the model.
The main inputs to E3ME are therefore calculations that are carried out at a more detailed level and converted to the model’s more aggregate sectors. They are changes in prices, quantities consumed and energy consumption, which are defined as:
Changes in prices paid for materials – the charges are collected by sector according to rates of material consumption. These charges are added to the unit costs of the sectors that consume the materials which, in the long run at least, will lead to higher product prices. The price increase in materials is estimated as the carbon price multiplied by the emissions per unit of production (from Pauliuk et al., Citation2016), multiplied by the share of the material in the more aggregate E3ME sector. This is added to the costs of the sectors that consume the materials.
Changes in input-output coefficients – it is assumed that all demand for the three basic materials is intermediate demand, and therefore input-output coefficients are modified accordingly, i.e. all users of the materials purchase less from the material producers. This approach captures both the direct and indirect effects of reductions in material consumption. The change in input-output coefficients is equal to the price increase (see above) multiplied by the assumed price-demand elasticity.
Changes in energy consumption – exogenous changes in energy consumption are added in the scenarios, based on the estimated changes in energy use by each material category per unit of production. We could allow the E3ME model to do this calculation endogenously but this would not be at as high a level of detail (and so would miss the importance of high energy-intensity of these three materials). The exogenous calculation therefore is more ‘bottom-up’ in nature and fits inside the more aggregate sectors of the model. Emissions levels respond in turn to the reductions in material consumption.
Changes in process emissions – the expected changes in process emissions are added to the model simulation but do not interact with the other inputs.
Finally, the revenues from the materials charges are collected by national governments. In the main scenarios we adopt the standard modelling assumption of revenue neutrality and so some other taxes must be reduced to offset the material charge revenues. We have chosen to reduce income taxes as they provide the largest source of revenue for governments at present. It is noted that the economic results depend at least to some extent on the choice of revenue recycling method (see e.g. Park, Ogawa, Kawakatsu, & Pollitt, Citation2015, for an example using the E3ME model). However, the key point is that these scenarios represent a shift in resources within the economy rather than an overall public stimulus or austerity impact on Europe’s economy.
In order to show the scale of the impacts of the reductions in income tax, we also present a set of sensitivities where the material charge revenues are not used to offset other taxes. In this case, the revenues are used to improve national governments’ budgetary positions, i.e. they are saved at national level.
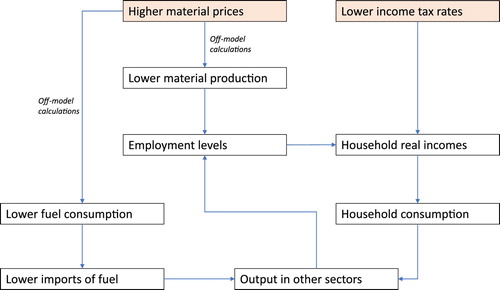
shows how the inputs relate to the main relationships in the model.
Figure 1. The main modelling interactions.
5. Results
5.1. Emissions results
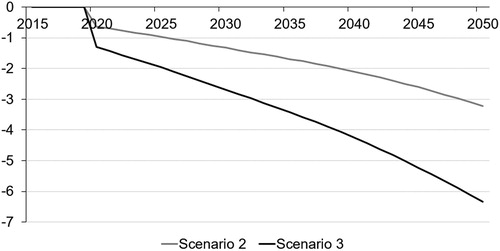
In Scenario 1 the price elasticity of demand is zero and therefore there is no response in consumption levels to the charge. The change in emissions in this scenario is therefore close to zero. There are noticeable impacts in the other scenarios, however. shows the impact on total EU energy CO2 emissions in Scenario 2 and Scenario 3. Overall, energy CO2 emissions could fall by almost 6% by 2050 in the case with a unit price elasticity. The impact is almost exactly half if the elasticity is −0.5.
Figure 2. Energy CO2 emissions compared to the baseline (%), EU28.
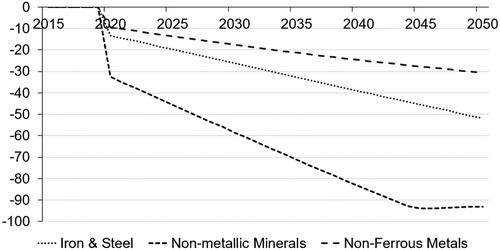
shows the estimated impacts on carbon emissions at EU level for Scenario 3, which reflects the relative weighting of the different sectors (the effects are similar in Scenario 2 but around half the size in magnitude). The results from E3ME show that by 2050 there is a considerable reduction in CO2 emissions from producing non-metallic mineral products (30%), iron & steel (52%) and, most noticeably, in non-ferrous metals, which is expected to have more than a 90% reduction in emissions compared to baseline over the next three decades. In other sectors, the effects are close to zero. This result implies a potentially large reduction in industrial energy consumption at production stage, if the consumption charges are introduced.
Figure 3. Energy CO2 emissions in S3 compared to the baseline, EU28.
In addition to reductions in energy emissions, there will be reductions in process emissions from the sectors that produce the materials. It is difficult to estimate with much precision the magnitude of these changes but they are important to the overall emissions reductions. The approach applied was to start with the reductions in production of each material (matching falls in consumption net of trade effects) and assume a linear reduction in process emissions. On this basis, the reductions could be as much as 30% for steel and 70% for cement. Overall this could lead to a reduction in EU process emissions of up to 40%, most of which comes from the decline in cement use. Summing the effects on energy and process emissions, the total reduction in CO2 emissions in the EU (excluding land use) could be as much as 10% by 2050.
5.2. Impacts on GDP
shows that GDP increases at least in the short run in all three scenarios, showing a double dividend effect for Europe as a whole. The scale of impacts is small, however (maximum around 0.25% of GDP, or a change in growth rates of less than 0.01 percentage points each year). In Scenario 1, the positive effects disappear after 2040 but in Scenarios 2 and 3 they persist or keep on growing. As we show below, the positive economic impacts may result from both the material charge itself (improving efficiency and reducing imports) and the use of the revenues that the charge raises.
Figure 4. GDP compared to the baseline (%), EU28.
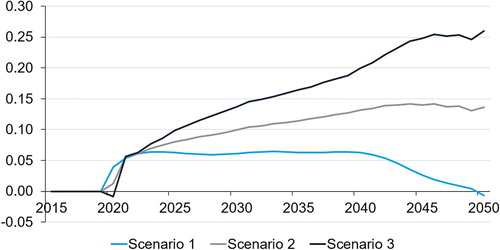
Two effects can explain the positive impacts. First, there are lags in the system that lead to a short-run redistribution of income from companies to households. Households benefit immediately from lower income tax rates (through the revenue recycling) but businesses may lose out in the short run if they do not immediately raise prices in response to higher input material costs. As companies typically have much higher savings rates than households, this redistribution from companies to households has a stimulus effect that dissipates in the long run as prices re-adjust. The results for Scenario 1 demonstrate this effect.
In Scenarios 2 and 3 there are additional benefits to Europe from reduced levels of fuel imports. If expenditure is diverted from fuel-intensive products then an improvement in Europe’s trade balance may lead to higher expenditure on domestically produced goods. There is again a stimulus effect but in this case it increases over time, as fuel imports are reduced further.
5.3. Impacts on employment
shows the overall impact on EU employment in the three scenarios. In Scenario 1, where the price elasticity of demand is zero, production methods do not change and the consumption of materials is largely unchanged. The main impact on employment in Scenario 1 therefore comes from the higher level of economic activity, as described above. Higher employment rates follow the changes in GDP with small increases up to 2040 before falling back to zero by 2050.
Figure 5. Employment levels compared to baseline (000s).
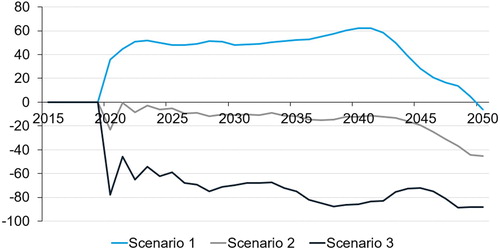
In contrast, there is an overall reduction in employment in Scenarios 2 and 3, by approximately 45,000 jobs and 88,000 jobs respectively in 2050. The reductions in employment are mainly accounted for by the basic metals and non-metallic mineral products sectors (see ). There are also inevitably some jobs lost in the energy supply sectors, although these are relatively small employers in Europe overall.
Figure 6. Output (S3) by sector compared to the baseline, EU28.
It should be noted that in the context of the total EU labour force, the impacts on employment are small (maximum −0.03%), but there could be considerable localized impacts, for example if large plants in remote locations close.
5.4. Other socio-economic impacts
shows the results of main economic indicators by 2050. In each scenario the pattern of results is quite similar, with the magnitude of impacts increasing in line with the price elasticity.
Table 2. EU28 Socio-economic results, 2050.
In Scenario 1, there is not much impact on the main macroeconomic indicators. As there is no behavioural response in this scenario by definition, it is perhaps not surprising that impacts are very limited. There are some price impacts from the charge on materials being passed on to final goods. At the aggregate level of the consumer price index the impact is small (0.08% by 2050) but there are larger increases in the prices of some goods (prices of household appliances, tools and equipment, and motor vehicles all increase by around 0.5% compared to the baseline). Investment goods, which are intensive users of carbon-intensive materials, become more expensive and there is therefore a modest reduction in total EU investment.
In Scenarios 2 and 3, the price impacts are reduced because the use of materials falls. In Scenario 3, with a unit price elasticity, the cost of materials does not change and the overall impact on consumer prices is negative (because the use of revenues from the carbon charge to reduce income tax rates leads to lower wage demands). As noted previously, however, the main boost to GDP comes from a reduction in imports.
Due to multiplier effects, real incomes and household expenditure are boosted. In these scenarios there is very little change overall in exports; in Scenario 3 there is a small increase in exports, indicating the absence of any negative competitiveness effects.
5.5. Sectoral impacts
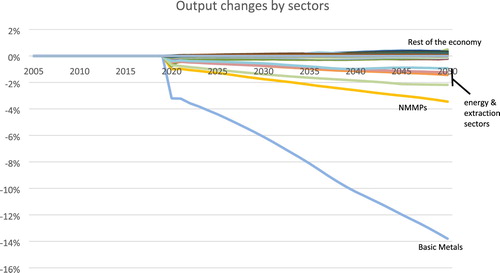
shows the impact on production levels across 70 sectors in Europe in Scenario 3. Again, in Scenario 2 the effects are similar but around half the size in magnitude and Scenario 1 has unnoticeable effects.
The results show that there is a considerable reduction in the demand for basic metals (up to 14%) and non-metallic mineral products (almost 3.5%), due to the lower material consumption. The other sectors that are most affected are those in the direct supply chains of the materials, mainly energy sectors and the non-energy mining sector (output falls about 1% to 2% by 2050).
In the rest of the economy, which accounts for the clear majority of production, the effects are very close to zero. Some sectors see small increases in output due to the reductions in income taxes, which boost real incomes and spending on retail and other leisure activities.
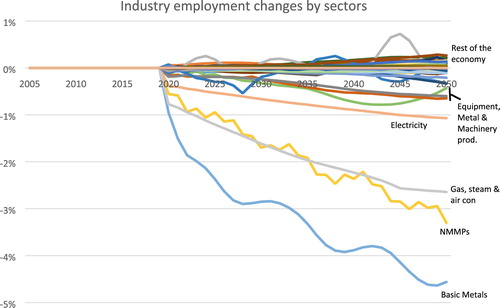
The overall pattern of structural shifts in Scenario 3 is characterized by a decrease in employment in some parts of the utilities sectors, intensive users of metals (equipment, metal and machinery products) and mostly in the basic metals and non-metallic mineral products sectors (see ). These two sectors see about 61,000 fewer jobs by 2050 which is more than two-thirds of the total industrial employment reduction. This shows the sensitivity of our charge policy towards the main users of the selected materials. There are also some small increases and decreases across other sectors but these effects roughly cancel out.
Figure 7. Employment (S3) by sector compared to the baseline, EU28.
5.6. Impacts in the rest of the world
The impacts in the rest of the world are close to zero. Total EU demand for energy-intensive materials falls but there are no competitiveness effects in basic manufacturing. The impacts on production levels in the rest of the world are thus a fall in exports of steel, cement and aluminium to the EU, and some gains in competitiveness in sectors that use these products against EU producers. In terms of emissions, the first effect is slightly stronger, meaning there is a small reduction in CO2 emissions in the rest of the world. In summary, there is no evidence of carbon leakage.
5.7. Impacts excluding offsetting tax reductions
The results above present an example of environmental tax reform, with no direct change in public balances. In real-world policy making, however, such environmental tax reform is rare and changes in the tax structure rarely balance. Here, we describe results in the case where income tax rates are not reduced.
The additional revenues in the scenarios gradually decrease as material consumption decreases, but the differences between the three cases are not great. The moldel results show that using the revenues to reduce income taxes could boost GDP by around 0.11% in each case. The boost to employment is around 0.04%.
One notable result is that it is possible to get a positive impact on GDP even without the revenue recycling. This is a result that appears to go against much of the literature on environmental tax reform (see discussion in Park et al., Citation2015), but reflects the specific nature of the charges assessed here. As shows, much of the benefit to GDP comes from reduced imports of fuel, which occur with or without the revenue recycling. Usually these direct trade benefits would be offset by a loss of competitiveness, but the design of the instrument here means that competitiveness effects are limited.
6. Conclusions
There is a consensus amongst economists that tax reform will be a crucial part of meeting ambitious decarbonization targets. However, the solid theoretical result of taxing bads instead of goods, and thus reducing distortions and improving welfare, has rarely stood up to the politics of competitiveness concerns. Hence significant environmental (and especially) energy taxes and charges have typically not been applied in areas where they would have the largest impact, i.e. price-responsive cases where energy and environmental costs constitute a large share of total costs. This experience was repeated with the EU and many other ETS systems that have provided free allocations of allowances to sectors that are deemed at risk of carbon leakage.
The addition of a consumption charge at the level of the upstream exemption offers an opportunity to unlock the economic and environmental benefits of environmental tax reform, while avoiding incentives that may create risks of carbon leakage. The development and implementation of emission benchmarks per ton of basic material production like cement, steel or aluminium now offers the opportunity to implement such a concept that would previously have been constrained to theoretical models.
To appropriately quantify the effect, it was of particular importance to capture the nature of basic materials in the modelling framework. Basic materials are not final consumption goods where reduced demand typically induces large welfare losses in modelling results. Instead, materials are intermediate inputs to production that can be used more efficiently, re-used, recycled and integrated into products that are characterized by durability or may be repaired and shared. As such, it is important to account for the various substitution opportunities among intermediaries that can allow for emission reductions with significantly lower welfare losses.
Using a modified version of the E3ME macroeconomic model, based on this approach we find that a charge on the consumption of carbon-intensive raw materials could lead to reductions in energy CO2 emissions of 6%. Just as importantly, process emissions could fall by up to 40%, and it should be noted that with current technologies there are very limited alternative means with which to reduce these emissions. There are no carbon leakage effects from the materials charges.
The modelling results also show that the costs to society need not necessarily be large. Although there may be steep falls in output in the sectors directly affected, the overall net impact on GDP may be close to zero. However, there are likely to be some negative impacts on employment levels and the model results suggest that the more successful the charges are at reducing emissions, the larger the impact on employment.
As with other economic instruments, price incentives on their own will likely be insufficient to stimulate such large reductions in emissions. The elasticities used in the modelling (particularly in Scenario 3) assume implicitly that enabling measures are also being undertaken and therefore represent a best first estimate of potential impacts, albeit based on a simplified approach. For example, building codes will need to be adjusted to allow for material substitution and product designers will need to take responsibility for ensuring the full recyclability of materials (which could be incentivized with extended producer responsibility or by extended eco-design regulation). Further analysis is needed to evaluate how these different policies might interact in reality, but initial results suggest a strong potential for emission reductions at low cost to society.
Disclosure statement
No potential conflict of interest was reported by the authors.
Additional information
Funding
References
- Böhringer, C., Rosendahl, K. E., & Storrøsten, H. B. (2017). Robust policies to mitigate carbon leakage. Journal of Public Economics, 149(2017), 35–46. doi: 10.1016/j.jpubeco.2017.03.006
- Cambridge Econometrics. (2014). E3ME model manual, version 6.0. Retrieved from www.e3me.com
- CEDEFOP. (2012). Future skills supply and demand in Europe (CEDEFOP Research Paper Number 26). Luxembourg: EU publications office. Retrieved from http://www.cedefop.europa.eu/files/5526_en.pdf
- Cherry, C., Scott, K., Barrett, J., & Pidgeon, N. (2018). Public acceptance of resource-efficiency strategies to mitigate climate change. Nature Climate Change, 8, 1007–1012. doi: 10.1038/s41558-018-0298-3
- De Koning, A., Bruckner, M., Lutter, S., Wood, R., Stadler, K., & Tukker, A. (2015, August). Effect of aggregation and disaggregation on embodied material use of products in input–output analysis. Ecological Economics, 116, 289–299. doi: 10.1016/j.ecolecon.2015.05.008
- De Koning, A., Huppes, G., Deetman, S., & Tukker, A. (2016). Scenarios for a 2°C world: A trade-linked input–output model with high sector detail. Climate Policy, 16, 301–317. doi: 10.1080/14693062.2014.999224
- Ekins, P., Pollitt, H., Summerton, P., & Chewpreecha, U. (2012). Increasing carbon and material productivity through environmental tax reform. Energy Policy, 42, 365–376. doi: 10.1016/j.enpol.2011.11.094
- Engle, R. F., & Granger, C. W. J. (1987). Cointegration and error correction: Representation, estimation and testing. Econometrica, 55, 251–276. doi: 10.2307/1913236
- EU ETS. (2018). Directive to enhance cost-effective emission reductions and low-carbon investments, 2018/410.
- European Commission. (2014). Study on modelling of the economic and environmental impacts of raw material consumption. European Commission Technical report 2014–2478. Retrieved from http://ec.europa.eu/environment/enveco/resource_efficiency/pdf/RMC.pdf
- European Commission. (2015). Closing the loop – an EU action plan for the circular economy, COM(2015) 614 final.
- European Commission. (2016). EU reference scenario 2016: Energy, transport and GHG emissions trends to 2050. Luxembourg: EU Publications Office. Retrieved from https://ec.europa.eu/energy/sites/ener/files/documents/20160713
- German Federation of Industry. (2018). Climate paths for Germany, Studie by BCG and Prognos.
- Grubb, M., Neuhoff, K., & Hourcade, J. C. (2014). Planetary economics. Abingdon: Routledge.
- Hendry, D. F., Pagan, A., & Sargan, J. D. (1984). Dynamic specification. In Z. Griliches & M. D. Intriligator (Eds.), Handbook of econometrics (Vol. II, pp. 1023–1100). Amsterdam: North Holland.
- Hertwich, E., & Peters, G. (2009). Carbon footprint of nations: A global, trade-linked analysis. Environmental Science and Technology, 43(16), 6414–6420. doi: 10.1021/es803496a
- IEA. (2015). World energy outlook. Paris: OECD/IEA.
- IEA. (2017). Energy technology perspectives. Paris: OECD/IEA.
- IPCC. (2014). Climate change 2014: Mitigation of climate change. In IPCC fifth assessment report, working group III. New York, NY: Cambridge University Press.
- Ismer, R., & Haussner, M. (2016). Inclusion of consumption into the EU ETS: The legal basis under European Union Law. Review of European Community & International Environmental Law, 25(1), 69–80. doi: 10.1111/reel.12131
- Jansen, H., & Klaassen, G. (2000). Economic impacts of the 1997 EU energy tax: Simulations with three EU-wide models. Environmental and Resource Economics, 15(2), 179–197. doi: 10.1023/A:1008309512349
- Keynes, J. M. (1921). Treatise on probability. London: Macmillan & Co.
- King, J. E. (2015). Advanced introduction to post Keynesian economics. Cheltenham: Edward Elgar.
- Lavoie, M. (2015). Post-Keynesian economics: New foundations. Cheltenham: Edward Elgar.
- Löschel. (2007). Role of auctions: The role of numerical models. In K. Neuhoff & F. Mathes (coordinating authors) The Role of Auctions for Emission Trading. Climate Strategies report.
- Lucas, R. (1976). Econometric policy evaluation: A critique. In K. Brunner & A. Meltzer (Eds.), The Phillips curve and labor markets (Carnegie-Rochester conference series on public policy, pp. 19–46). American Elsevier.
- Mercure, J.-F. (2012). FTT: Power a global model of the power sector with induced technological change and natural resource depletion. Energy Policy, 48, 799–811. doi: 10.1016/j.enpol.2012.06.025
- Mercure, J.-F., Lam, A., Billington, S., & Pollitt, H. (2018). Integrated assessment modelling as a positive science: Private passenger road transport policies to meet a climate target well below 2°C. Climatic Change. doi: 10.1007/s10584-018-2262-7
- Mercure, J.-F., Pollitt, H., Bassi, A. M., Viñuales, J. E. & Edwards, N. R. (2016, March). Modelling complex systems of heterogeneous agents to better design sustainability transitions policy. Global Environmental Change, 37, 102–115. doi: 10.1016/j.gloenvcha.2016.02.003
- Mercure, J.-F., Pollitt, H., Edwards, N.R., Holden, P.B., Chewpreecha, U., Salas, P., … Vinuales, J. E. (2018, April). Environmental impact assessment for climate change policy with the simulation-based integrated assessment model E3ME-FTT-GENIE. Energy Strategy Reviews, 20, 195–208. doi: 10.1016/j.esr.2018.03.003
- Mercure, J.-F., & Salas, P. (2012). An assessment of global energy resource economic potentials. Energy, 46(1), 322–336. doi: 10.1016/j.energy.2012.08.018
- Mercure, J.-F., & Salas, P. (2013). On the global economic potentials and marginal costs of non-renewable resources and the price of energy commodities. Energy Policy, 63, 469–483. doi: 10.1016/j.enpol.2013.08.040
- Meyer, B., & Lutz, C. (2007). The GINFORS model: Model overview and evaluation. Retrieved from http://www.petre.org.uk/pdf/sept08/petrE_WP3%202%20Ginfors.pdf
- Minx, J. C., Wiedmann, T., Wood, R., Peters, G.P., Lenzen, M., Owen, A., … Ackerman, F. (2009). Input-output analysis and carbon footprinting: An overview of applications. Economic Systems Research, 21(3), 187–216. doi: 10.1080/09535310903541298
- Monjon, S., & Quirion, P. (2011). Addressing leakage in the EU ETS: Border adjustment or output-based allocation? Ecological Economics, 70, 1957–1971. doi: 10.1016/j.ecolecon.2011.04.020
- Munnings, C., Acworth, W., Sartor, O., Kim, Y.-G., & Neuhoff, K. (2018). Pricing carbon consumption, synthesising an emerging trend. Climate Policy. doi: 10.1080/14693062.2018.1457508
- Neuhoff, K., Ismer, R., Acworth, W., Ancygier, A., Fischer, C., Haussner, M., … Zipperer, V. (2016). Inclusion of Consumption of carbon intensive materials in emissions trading An option for carbon pricing post-2020. Climate Strategies Report.
- Neuhoff, K., Vanderborght, B., Ancygier, A., Tugba Atasoy, A., Haussner, M., Ismer, R., … Schopp, A. (2014). Carbon control and competitiveness post 2020: The cement report. London: Climate Strategies.
- Park, S. J., Ogawa, Y., Kawakatsu, T., & Pollitt, H. (2015). The double dividend of and environmetnal tax reform in East Asian economies. In S. Lee, H. Pollitt, & S. J. Park (Eds.), Low-carbon, sustainable future in East Asia (Chap. 8, pp. 121–139). Abingdon: Routledge.
- Pauliuk, S., Neuhoff, K., Owen, A., & Wood, R. (2016). Quantifying impacts of consumption based charge for carbon intensive materials on products (DIW Discussion Papers, No. 1570).
- Pearce, D. (1991). The role of carbon taxes in adjusting to global warming. The Economic Journal, 101(407), 938–948. doi: 10.2307/2233865
- Pollitt, H., Lee, S., & Park, S. J. (2015). Introduction to the modelling in this book. In S. Lee, H. Pollitt, & S. J. Park (Eds.), Low-carbon, sustainable future in East Asia. London: Routledge.
- Pollitt, H., & Mercure, J.-F. (2018). The role of money and the financial sector in energy-economy models used for assessing climate and energy policy. Climate Policy, 18(2), 184–197. doi: 10.1080/14693062.2016.1277685
- Rogelj, J., Popp, A., Calvin, K. V., Luderer, G., Emmerling, J., Gernaat, D., … Krey, V. (2018). Scenarios towards limiting global mean temperature increase below 1.5° C. Nature Climate Change, 8(4), 325–332. doi: 10.1038/s41558-018-0091-3
- Sato, M., & Neuhoff, K. (2007). The contribution of a CO2 price signal on product substitution (Electricity policy research group Working Paper). University of Cambridge.
- Schoer, K., Wood, R., Arto, I., & Weinzettel, J. (2013). Estimating raw material equivalents on a macro-level: Comparison of multi-regional input−output analysis and hybrid LCI-IO. Environmental Science and Technology, 47(24), 14282–14289. doi: 10.1021/es404166f
- Scott, K., Roelich, K., Owen, A., & Barrett, J. (2018). Extending European energy efficiency standards to include material use: An analysis. Climate Policy, 18(5), 627–641. doi: 10.1080/14693062.2017.1333949
- Stocker, A., Omann, I., & Jäger, J. (2012). The socio-economic modelling of the ALARM scenarios with GINFORS: Results and analysis for selected European countries. Global Ecology and Biogeography, 21(1), 36–49. doi: 10.1111/j.1466-8238.2010.00639.x
- UNFCCC. (2015). Paris agreement. United Nations.
- Wiebe, K. S., Bjelle, E. L., Többen, J., & Wood, R. (2018). Implementing exogenous scenarios in a global MRIO model for the estimation of future environmental footprints. Journal of Economic Structures, 7, 20. doi: 10.1186/s40008-018-0118-y
- Zipperer, V., Sato, M., & Neuhoff, K. (2017). Benchmarks for emissions trading – General principles for emissions scope (Grantham Research Institute on Climate Change and the Environment Working Paper no. 287, Centre for Climate Change Economics and Policy Working Paper No. 321). Retrieved from http://www.lse.ac.uk/GranthamInstitute/publication/benchmarks-emissions-trading-generalprinciples-emissions-scope/
Appendix. Description of the E3ME model
Introduction
This appendix provides a description of the E3ME model and how it was applied in this paper. For further information, the reader is referred to the model manual (Cambridge Econometrics, Citation2014) and full list of model equations (Mercure, Pollitt, et al., Citation2018).
Treatment of the economic system
The representation of the economy in E3ME is based on post-Keynesian foundations (see e.g. King, Citation2015; Lavoie, Citation2015). The economy is demand-driven but may be constrained by limitations on supply. The starting assumption is that agents operate under conditions of fundamental uncertainty (Keynes, Citation1921).
With such uncertainty it is not possible for agents to optimize the decision-making process and therefore there are no assumptions about optimizing behaviour in the E3ME model. Instead, behavioural parameters are informed by econometric analysis that is based on historical data sets. It is assumed that such behavioural patterns remain unchanged in the projection period, a limitation that is sometimes referred to as the Lucas Critique (Lucas, Citation1976).
E3ME can be depicted as an extended version of multiplier analysis; and multiplier effects are a key feature of the model’s results. The core input-output national accounting framework is supplemented by the econometric behavioural equations. These equations determine the components of final demand (consumption, investment and trade), prices and labour market outcomes. They may introduce non-linearities to the standard input-output system, for example in changes to savings rates or labour intensities across sectors.
The econometric equations also provide supply-side constraints to the economy. For example, as the economy moves towards full employment, wages are pushed up which leads to higher unit production costs and prices passed on to final consumers. Higher prices may also have competitiveness effects on traded sectors.
Data and parameterization
The E3ME database consists of annual time series covering the period back to 1970. The main data source for European data in E3ME is the Eurostat national accounts database. This is supplemented by the IEA’s energy balances and prices databases. Trade data are taken from Comtrade.
For non-European countries, data are sourced from OECD and World Bank databases. For large non-OECD countries, national statistical agencies are consulted.
Behavioural parameters are estimated from the gathered time-series data using econometric techniques, specifically an error-correction methodology (Engle & Granger, Citation1987; Hendry et al., Citation1984) that allows for both short and long-term analysis. The model parameters are available from the modelling team at Cambridge Econometrics on request.
Baseline projections from the model are calibrated to be consistent with a standard source. In this paper we use the European Commission’s long-term projections (European Commission, Citation2016), which provide a consistent source of information for Europe’s economies and energy systems. The calibration process is described in the model manual.
Comparison to computable general equilibrium modelling
E3ME is often compared to the more common Computable General Equilibrium (CGE) modelling approach (e.g. Jansen & Klaassen, Citation2000; Pollitt, Lee, & Park, Citation2015). The modelling approaches may appear similar and are often used to answer similar questions. However, there are important theoretical differences between the modelling approaches.
In a standard CGE framework, optimal behaviour is assumed, output is determined by supply-side constraints and prices adjust fully so that all the available capacity is used. In E3ME the determination of output comes from a post-Keynesian framework. As described above, the model is demand driven; as prices do not automatically clear markets, it is possible to have spare capacity in the system.
The differences have important practical implications. If there is spare capacity then it is possible to implement policies that draw on that capacity, increasing output. In this way, it is possible to obtain ‘double dividend’ results in which there are both environmental and economic benefits (as we see in this paper). Such a result is not possible in a standard CGE modelling framework when the introduction of a new policy effectively puts a constraint on economic optimization, thereby leading to a worse outcome by definition.
Economy-energy-environment linkages
One of the main benefits of the E3ME model is its close integration of energy consumption and emissions with the wider economy. The linkages are two-way.
Final energy demand is determined by sets of econometric equations. Energy demand responds to higher rates economic production or to changes in relative energy prices. It also responds to improvements to the capital stock (proxied by investment and R&D). The equations are estimated in physical units (thousands of tonnes of oil equivalent) with feedbacks to the economic input-output coefficients to maintain consistency in the model. There are separate equations for the four main fuel types, which allows for fuel switching in response to changes in prices.
E3ME includes a separate module for the electricity sector (Mercure, Citation2012), as new technologies cannot be estimated through econometric means. The sub-model is based on the principles of technology diffusion and has limited impact on the analysis in this paper.
Fuel supplies are determined by a set of cost curves (Mercure & Salas, Citation2012, Citation2013). Lower demand for fossil fuels lead to lower global prices (and in turn rebound effects). These are included in the analysis in this paper but are marginal in scope because of the focus on three sectors in Europe only.
Application of E3ME in this paper
The scenarios in this paper consist of five different inputs to the model:
An increase in costs for all sectors that consume the three materials.
A reduction in the intermediate consumption of the three materials by all other sectors of the economy.
A reduction in energy consumption.
A reduction in process emissions.
A reduction in income tax rates to compensate the material charge revenues (excluded in the sensitivity runs).
The increase in costs of materials is estimated by multiplying the assumed carbon price by the number of emissions per unit of production of each material type (taken from Pauliuk et al., Citation2016). This is added to the non-tax material production costs to give a relative increase. It is assumed that this cost is added to the prices of the materials (as they are largely commoditized). There is therefore a higher cost to the sectors that consume the materials, which is added to their unit costs (net of the efficiency gains from reduced consumption).
The reduction in intermediate consumption is applied by adjustments to input-output coefficients. For example, when the consumption of steel falls, the coefficients in the row for basic metals are reduced. The size of the reduction in consumption depends on the cost increase due to the material charge (as described above) and the assumed demand-price elasticity. As the material charge increases, the reduction in demand does too. Usually this calculation would be handled within the E3ME model but it would be carried out at a higher level of detail, missing the key features of these materials in terms of carbon intensity. Hence the off-model calculation replaces what the model itself would usually do.
The reductions in energy consumption and process emissions could be estimated by E3ME but, again, would be determined at a lower level of detail (e.g. for the whole basic metals sector rather than steel). These inputs are therefore also entered manually in the scenarios. An estimate of units of energy consumption per unit of production (Pauliuk et al., Citation2016) is used to derive expected reductions in energy consumption. These values replace the estimates that the E3ME model would produce by itself.
Reductions in process emissions are carried out completely off-model. As noted in the main text, there is a high degree of uncertainty around these estimates but we have taken suggested values from Pauliuk et al. (Citation2016) and assumed a linear relationship between production levels and the levels of process emissions.
The change in income tax rates is set to obtain revenue neutrality. A single average income tax rate is used for each country, reflecting the macro-level data available and the limited disaggregation in the E3ME model. Reducing this rate therefore leads to similar proportional reductions in taxes for all individuals who are working.